Beyond swings in risk appetite
Many asset prices have traded sideways since the release of the previous BIS Quarterly Review in early December, while investors waited for clues on a number of sources of uncertainty. Market participants expected a change in the policy mix in the United States, with a greater role for fiscal policy, continued gradual tightening of monetary policy, a push for deregulation, and a more protectionist trade stance. However, the precise nature and timing of policy changes and their impact remained unclear. In February, stock markets rallied in the United States, while sovereign yields in a number of euro area countries came under pressure as investors shifted their focus towards political uncertainties in Europe.
More broadly, asset returns have become less correlated across classes, regions and sectors. The close co-movements that characterised markets during much of the period following the Great Financial Crisis (GFC) seem to have broken down. This suggests that, over the period under review, swings in investor risk appetite were less of a driver of overall valuations.
Stock prices were broadly supported by data confirming a general improvement in the macroeconomic outlook of advanced economies (AEs). Manufacturing and employment strengthened, while inflation edged up across the board, due in part to flattering base effects and rebounding commodity prices. The monetary policy stance of the major economies continued to diverge, in line with their central banks' assessment of country-specific circumstances. While the Federal Open Market Committee (FOMC) raised the target federal funds rate another quarter-point, and hinted at a somewhat quicker tightening pace, the ECB and the Bank of Japan (BoJ) stayed committed to sustaining "lower for longer". Core fixed income markets and exchange rates reflected this divergence.
Asset prices also hinted at shifting perceptions of the challenges faced by emerging market economies (EMEs). While markets trimmed to a large extent the initial negative reactions that followed the US presidential election, relative valuations suggest that concerns persisted for some economies regarding their growth, trade and financing outlooks. Notably, some unusual volatility prevailed in Chinese FX and bond markets at the turn of the year as ebbing liquidity interacted with a less accommodating global financial environment.
The breakdown in correlations
A salient feature of recent market developments was the broad dispersion of returns across asset classes, economic sectors and geographical regions. Cross-asset correlations, which had gradually been declining since late 2015, plummeted after the US election in November (Graph 1, left-hand panel).1 This contrasts with much of the period that followed the GFC when stock markets in advanced and emerging economies, EME sovereign spreads, AE long-term yields, the dollar, and corporate spreads in both advanced and emerging economies seemed to move in parallel. In a global environment devoid of growth but plentiful in liquidity, central bank decisions appeared to draw investors into common, successive phases of buying or selling risk. The recent collapse suggests that the common factors that had until recently been driving returns further weakened their grip on markets during the period under review.2
Returns became less correlated as policy uncertainty jumped to the foreground. Uncertainty persisted about the timing and quantum of a number of policy adjustments in the United States, even though the incoming administration reaffirmed its commitment to an agenda of deregulation, fiscal expansion and trade deficit reduction. The range of possible policy outcomes also appeared to widen in the euro area as a busy electoral year got under way. All this contributed to a surge in indicators of policy uncertainty both in the United States and globally (Graph 1, centre panel).

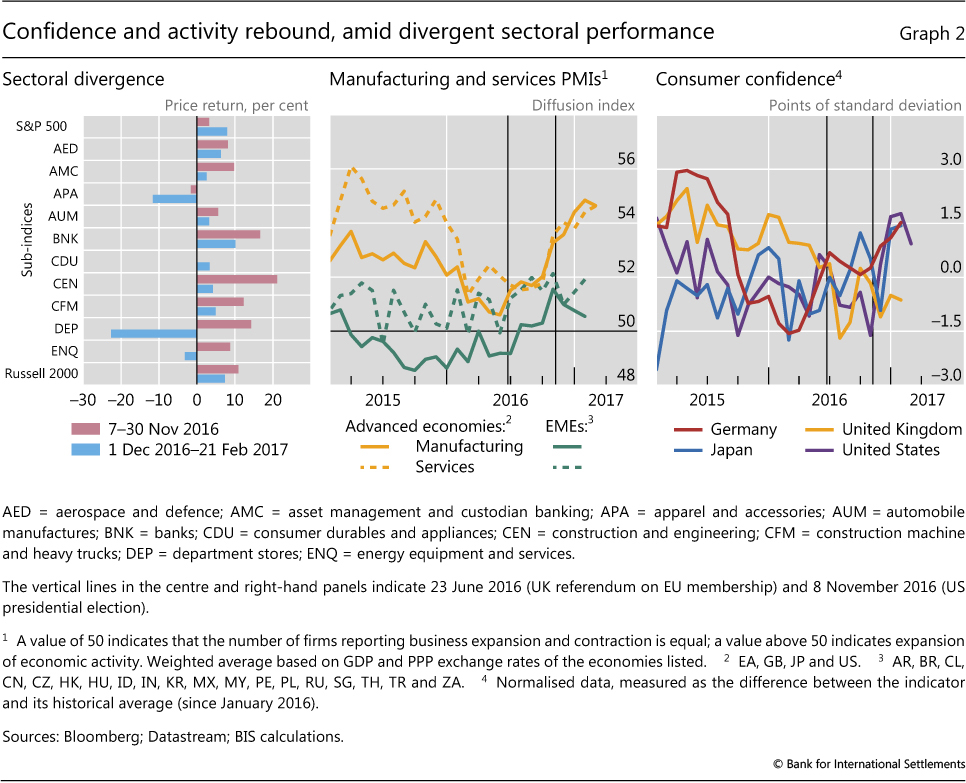
Despite this uncertain backdrop, stock markets in AEs held the ground gained after the US election, and even moved upwards in February (Graph 1, right-hand panel). Volatility as priced by the market also stayed low as the VIX visited depths rarely seen since the start of the GFC. But significant differences across sectors and countries became apparent. In the United States, there were clear winners (defence, construction, financials, manufacturing, small firms) and losers (import-intensive sectors) even as the overall indices reached new highs (Graph 2, left-hand panel). In Europe and Japan, stock markets stayed relatively flatter throughout this period. In EMEs, equity valuations recovered substantially, offsetting and in many cases reversing the losses suffered in the immediate aftermath of 8 November. But the upturn was uneven across EME regions (see next section).
The solid performance of stock markets was buoyed by convincing signs of sustained improvement in the global economy. Manufacturing and services purchasing managers' indices (PMIs) in AEs recorded large gains as from the middle of last year, which accelerated in December (Graph 2, centre panel). Market sentiment indicators improved in major AEs following the US election.3 This echoed strengthening consumer and business confidence, which in the United States reached levels not seen since late 2014, when the Fed was winding down its last programme of asset purchases amid market buoyancy (Graph 2, right-hand panel).4 The improvement in confidence was more modest in other AEs, but it was enough to overcome the negative impact of Brexit. GDP surprised on the upside in several economies in the second half of 2016. In the United States and the euro area, strong private consumption lifted growth above the perceived potential.5
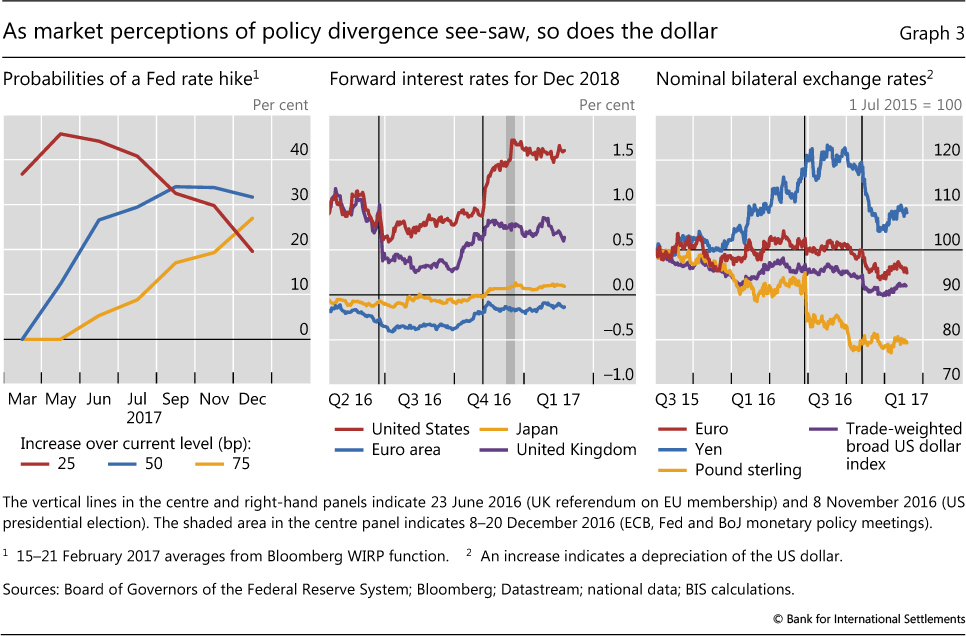
With an improved growth outlook, and as expectations of changes in fiscal and other policies took centre stage, monetary policy moved to the background. The FOMC increased the target range of the fed funds rate by 25 basis points in early December, while the "dot-plots" suggested that FOMC members anticipated three more 25 bp hikes during 2017. Investors seemed to expect one rise in the policy rate by May or June, followed possibly by a second in September, with a third remaining a distant prospect (Graph 3, left-hand panel). Meanwhile, the ECB and the BoJ stayed the course of "lower for longer". In mid-December, the ECB announced that, starting the following April, it would slow the pace of its asset purchases from €80 billion to €60 billion, but also extended the duration of its purchase programme until December 2017. The BoJ upgraded its assessment of the economy, but maintained all policy settings unchanged: a negative rate on excess bank reserves, a zero target for the 10-year Japanese government bond yield and purchases of ¥80 trillion per year. Short-term rates reflected the divergence in monetary policy expectations: the spread between the dollar's forward short-term rates and those of the euro and yen, which had surged after the election, jumped again when the Fed increased its target range. Subsequently, the gap between the rates moderated (Graph 3, centre panel).
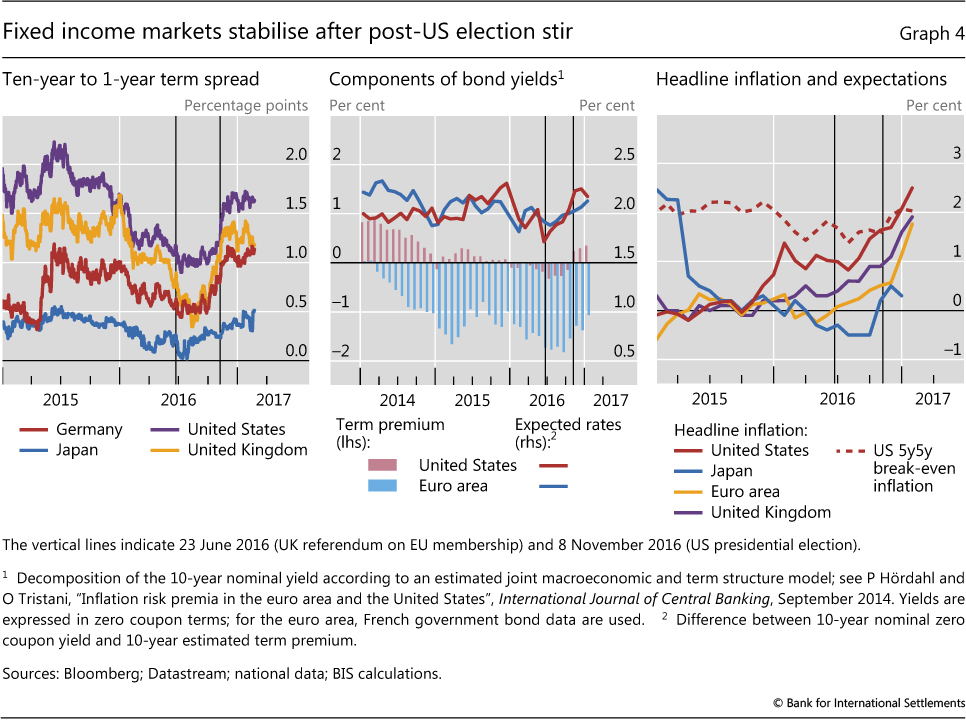
Core fixed income markets stabilised after their broad November rout. In Germany, the United Kingdom and the United States, the spread between 10-year and one-year yields see-sawed from December to February (Graph 4, left-hand panel). The initial increases in long-term rates were driven in large part by a decompression of the term premium, with the estimated premium returning to positive levels in the US and becoming less negative in the euro area. But increases in expected rates also played a role, pointing to both higher inflation expectations and the anticipated reaction of central banks (Graph 4, centre panel). Financial market-based measures of inflation compensation also rose in AEs, especially in the United States, against the backdrop of higher current inflation (Graph 4, right-hand panel). By January 2017, headline inflation exceeded 2% in the United States and neared 2% in the euro area and the United Kingdom, reflecting higher commodity prices as well as the "base effect" of a dip in inflation one year before, and in line with stronger global activity. After almost a year of zero or negative inflation, Japan saw consistently positive figures beginning in October (Graph 4, right-hand panel).
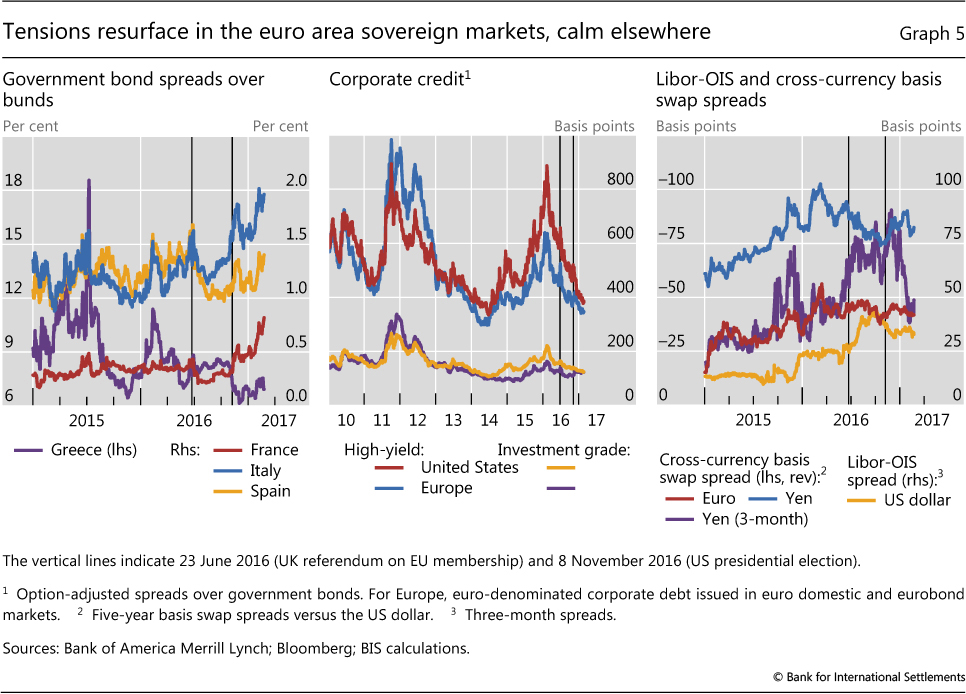
Some signals of tension resurfaced in the euro area sovereign bond markets. Spreads in government bond yields vis-à-vis German bunds widened sharply in the initial weeks of the year (Graph 5, left-hand panel). While there were heightened tensions about the implementation of the Greek adjustment programme, the pressure on sovereign spreads seemed more related to heightened political uncertainty. In particular, investors appeared unnerved by the possible policy implications of electoral contests in some euro area members in the year ahead. In this context, TARGET2 imbalances - which have been gradually growing since 2015 - received greater attention, but in fact they have so far been mainly a technical by-product of the ECB's asset purchase programme (Box A).
The US dollar, which had strengthened significantly in November and December, weakened on a broad basis in January despite the support provided by existing and expected interest rate differentials. The partial reversal seemed related to the impasse besetting the economic policy pipeline amid the political transition process. The Fed's concerns about the detrimental impact on the economy of a stronger dollar, as expressed in the minutes of the December FOMC meeting, may have played a role as well. Still, the US currency kept a large fraction of the gains made since the election, especially vis-à-vis the yen (Graph 3, right-hand panel). Sterling received a small boost from the strong performance of the UK economy towards the end of the year, and it seemed to benefit from greater clarity about the expected outcome of the Brexit process.
Equity market rallies in the large economies were matched by lower spreads in credit markets. After narrowing in November, the spreads of European and US corporate investment grade credit remained essentially unchanged thereafter (Graph 5, centre panel). High-yield spreads continued to fall throughout the review period, and US high-yields trimmed the differential with their European peers, to a large extent because of the improvement in credit spreads for firms in oil-related businesses.
Box A
What is driving the renewed increase in TARGET2 balances?
TARGET2 (T2) balances are again on the rise. Since early 2015, the T2 balances of euro area national central banks (NCBs) have risen steadily, in some cases exceeding the levels seen during the sovereign debt crisis (Graph A, left-hand panel). However, unlike then, record T2 balances should be viewed as a benign by-product of the decentralised implementation of the asset purchase programme (APP) rather than as a sign of renewed capital flight.
Because liquidity operations in the Eurosystem are decentralised, claims or liabilities of NCBs vis-à-vis the ECB can arise. Market operations are to a large extent implemented by the Eurosystem's NCBs rather than by the ECB. When an NCB disburses liquidity directly to commercial banks, it keeps the claims on those commercial banks on its own balance sheet. But the funds may end up in another commercial bank's account with a different NCB. As a consequence, the liquidity-providing NCB has a liability vis-à-vis the ECB, while the NCB receiving the reserves holds a claim on the ECB.
The net of such claims and liabilities is referred to as a "TARGET2 balance" because it is recorded as such in the main payment settlement system of the euro area, the second edition of the Trans-European Automated Real-time Gross Settlement Express Transfer System.
In the period leading up to mid-2012, T2 balances grew strongly (Graph A, left-hand panel) due to intra-euro area capital flight. At the time, sovereign market strains spiked and redenomination risk came to the fore in parts of the euro area. Private capital fled from Ireland, Italy, Greece, Portugal and Spain into markets perceived to be safer, such as Germany, Luxembourg and the Netherlands.
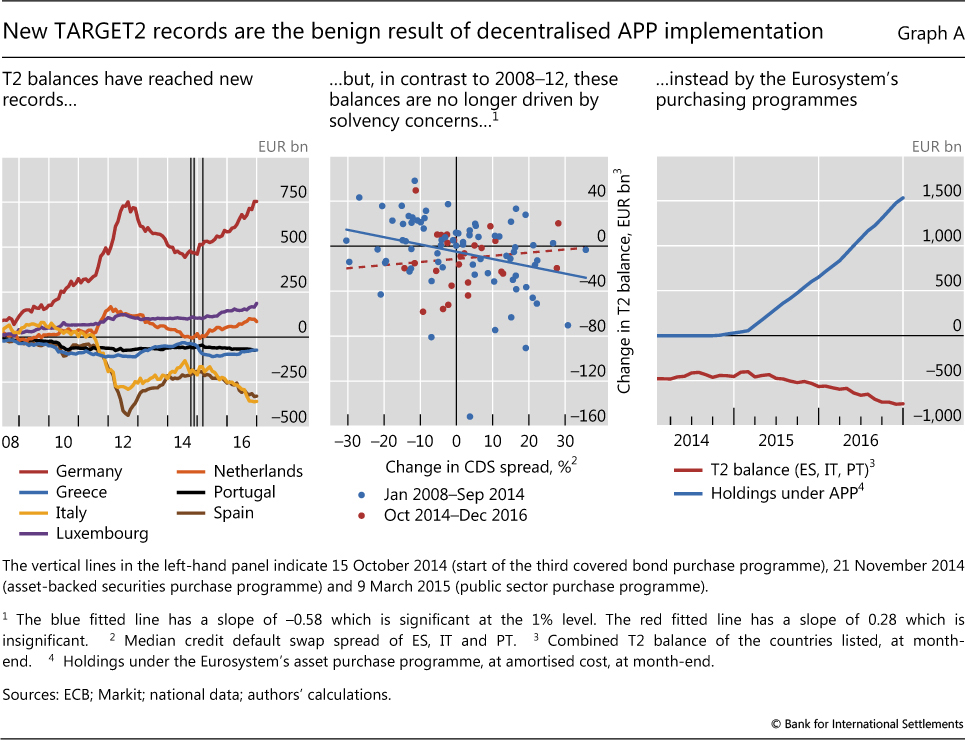
Indeed, during that period, the rise in T2 balances seemed related to concerns about sovereign risk. The blue dots in the centre panel of Graph A show the close relationship between the sovereign credit default swap (CDS) spreads of Italy, Portugal and Spain and the evolution of their combined T2 balance from January 2008 to September 2014. Whenever the CDS spreads of those economies rose, the associated private capital outflows increased their T2 deficit. When the CDS spreads decreased after confidence in the euro area was restored in mid-2012, the capital outflows partly reversed, and T2 deficits dwindled.
In contrast, the current rise seems unrelated to concerns about the sustainability of public debt in the euro area. The red dots in the centre panel of Graph A show that, between October 2014 and December 2016, there was no relationship between the sovereign CDS spreads of Italy, Portugal and Spain and the evolution of their combined T2 balance.
The current rise in T2 imbalances seems to have a different cause: the Eurosystem's APP, which mechanically affects the evolution of these balances. Many APP purchases are conducted by NCBs via banks located in other countries. One example is where the Bank of Italy, as part of its implementation of the APP, buys securities from a London-based bank that connects to the T2 system via a correspondent bank located in Germany. The purchase amount is credited to the account of the German correspondent bank at the Deutsche Bundesbank, thus increasing the T2 surplus of the Bundesbank. Similarly, the Bank of Italy's T2 deficit widens.
Thus, T2 imbalances will increase whenever any T2-debtor NCB conducts an asset purchase with a counterparty that has a correspondent bank located in a T2-creditor NCB. This is very frequently the case. For example, whereas the Bundesbank itself purchases less than a quarter of the total APP purchases, 60% of all Eurosystem purchases under the APP are conducted via banks that connect to the T2 system via the Bundesbank.
As the European interbank market is still fragmented, the liquidity does not circulate in the euro area and T2 imbalances grow as the total holdings under the APP accumulate. Indeed, the overall increase in T2 imbalances can be linked closely to the total purchases under the APP (Graph A, right-hand panel). A recent study, which takes into account the precise geography of the correspondent banks of each and every APP security purchase, shows that APP transactions can almost fully account for the re-emergence of T2 imbalances.
This mechanical impact of the APP on T2 imbalances is also confirmed by the evolution of T2 balances vis-à-vis Greece. The country's sovereign bonds are not eligible for the APP, and consequently the Greek T2 deficit has actually been more or less stable during recent months (Graph A, left-hand panel).
For a detailed description of this system and the origins of T2 imbalances during the European debt crisis, see R Auer, "What drives TARGET2 balances? Evidence from a panel analysis", Economic Policy, vol 29, no 77, 2014, pp 139-97; ECB, "TARGET balances and monetary policy operations", Monthly Bulletin, May 2013; and S Cecchetti, R McCauley and P McGuire, "Interpreting TARGET2 balances", BIS Working Papers, no 393, December 2012. See C-L Thiele, "Das Netz der Notenbanken", Handelsblatt, 7 February 2017. See ECB, "TARGET balances and the asset purchase programme", Economic Bulletin, November 2016.
Money markets also stabilised. As money market fund reform was implemented in the United States,6 the Libor-OIS spread steadied around 35 bp, some 20 bp above the pre-reform level. The five-year euro/dollar cross-currency basis swap spread fluctuated around the 45 bp level, as it has since the end of Q1 2016 (Graph 5, right-hand panel). Funding conditions continued to be a bit more stretched in the yen market, where the longer-term basis reflected Japanese banks' structural need for cross-currency swaps to fund long-term dollar assets. In shorter tenors, however, the yen/dollar basis fell significantly, in part because of calendar effects.
EMEs: between a rock and a hard place
Investor sentiment towards EME assets improved during the period under review, reversing the sell-off that followed the US presidential election. In line with the dispersion in asset returns discussed above, the extent of the reversal differed across major emerging market regions and countries, reflecting differentiated expected impacts from prospective US policies. Ultimately, however, many EMEs appeared caught between the prospects of heightened protectionism and the financial fallout of a significantly stronger dollar.
From late November, depreciation pressure on EME currencies eased and stock prices rebounded, while sovereign spreads narrowed, retracing all the increases posted in November (Graph 6, left-hand panel). Central and eastern European markets were least affected, due possibly to their limited trade and financial connections to the United States. Latin American countries - excluding Mexico - also did well, possibly benefiting from higher commodity prices. On the other hand, the currencies and equities of Asian countries, which have closer direct and indirect trade links with the US, did not improve as much (Graph 6, centre panel). Capital outflows moderated in December and turned to inflows in January and February, resulting in a net inflow of $14 billion into EME funds after two consecutive months of losses. The cumulative net outflow in the last two months of 2016 was slightly over $29 billion (Graph 6, right-hand panel).

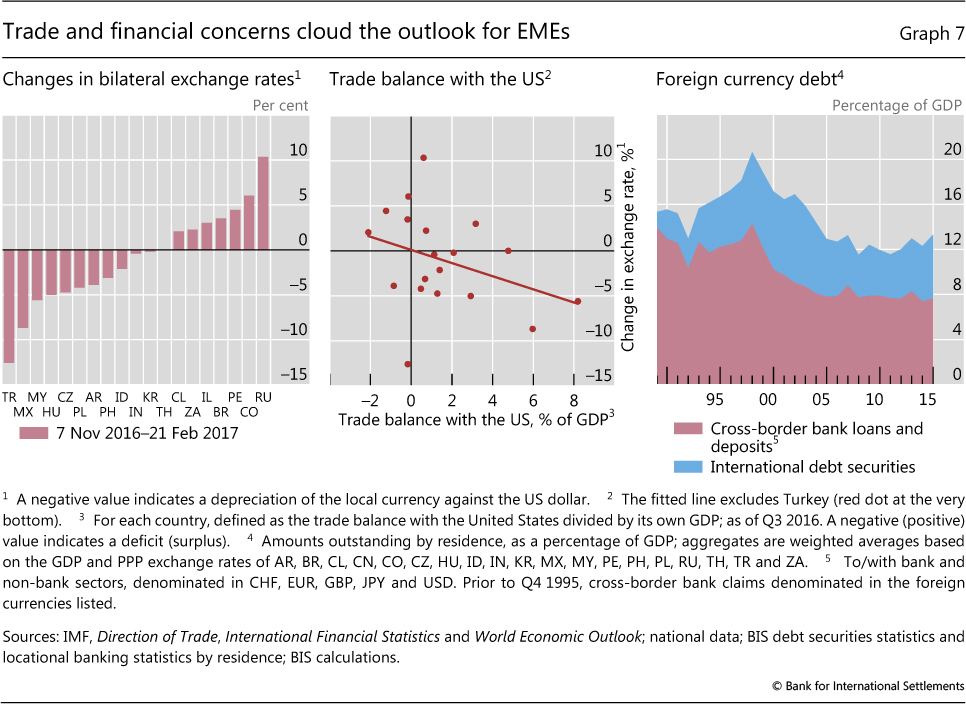
Judging from exchange rate movements (Graph 7, left-hand panel), market participants seemed to fear that a sharp reduction in international trade flows could bring heightened stress to some EMEs. The size of the bilateral trade surplus vis-à-vis the United States has been a relevant factor in explaining the difference in the recent depreciation of EME currencies vis-à-vis the dollar (Graph 7, centre panel). While large exporters to the US, such as China and Mexico, were in the spotlight, a shock to global trade could spread more widely through the disruption of global value chains.
Moreover, market developments reflected concerns that a stronger dollar and higher interest rates, on the expectation of fiscal stimulus and monetary normalisation in the United States, could put pressure on EME borrowers' balance sheets. The amount of outstanding US dollar-denominated securities issued by EMEs rose from $509 billion in 2008 to $1.25 trillion as of end-September 2016 on a residence basis. Around 40% of these were issued by non-financial corporations. Total US dollar debt (including bank loans) of EME non-bank borrowers stood at $3.6 trillion at end-September 2016. As a fraction of GDP, however, total EME debt denominated in foreign currency is still below the levels observed just before the Asian financial crisis (Graph 7, right-hand panel). And its composition has changed, as bank debt has been partially replaced by longer-term debt securities issuance. In addition, EMEs have in general much larger international reserve buffers now compared with the 1990s. Even so, the higher debt burden on the back of a stronger dollar and higher interest rates could turn into a financial headwind that could outweigh potential trade gains, especially if AEs became less open to trade.7
Big swings in Chinese financial markets as liquidity tightens
Chinese FX and bond markets went through substantial swings at the turn of the year. The gradual tightening of domestic financial conditions, amid continued capital outflows and depreciation pressures, sparked temporal dislocations in the provision of liquidity throughout the financial system.
Tight liquidity in onshore financial markets contributed to a sharp sell-off in domestic bonds in mid-December 2016. Liquidity had begun to gradually tighten in the third quarter. After largely stabilising at around 2% at the beginning of 2016, the Shanghai interbank offered rate (Shibor) benchmark rate had begun to edge higher starting in August and reached 2.20% in September. The upward path continued in the fourth quarter, with Shibor rising by another 15 bp between October and early December 2016 (Graph 8, left- hand panel). Tight liquidity conditions in the second half of 2016 in part reflected the measures taken by the People's Bank of China (PBC) to trim excessive leverage, such as diversifying the maturity structure of open market operations and introducing a tighter prudential treatment of off-balance sheet wealth management products (WMPs).
On the back of the tighter liquidity, as well as higher yields globally, 10-year Chinese government bond yields had risen by around 25 bp from the end of September to the end of November 2016. The rise in yields accelerated in the first half of December. Reportedly, worries about the potential default of a mid-size brokerage firm on unregulated repurchase agreements triggered the December turmoil. The firm had funded its bond purchases with both WMPs and repurchase agreements, a common practice in the Chinese market (Box B). With the underlying bonds in the repos trading at a loss, concerns about a more widespread breakdown of similar deals froze the wholesale funding market. The ensuing liquidity squeeze in turn forced securities firms to conduct a fire sale of bonds in order to pay back their short-term loans. On 15 December, the 10-year government bond yield and corporate high-grade yields surged by around 15 bp (Graph 8, left-hand panel). The stress affected the futures market as well: trading in 10-year government bond futures was halted after hitting circuit breakers - the first such suspension since the relaunching of futures trading in 2013. Eventually, markets stabilised after the authorities injected liquidity through short- and medium-term lending facilities.
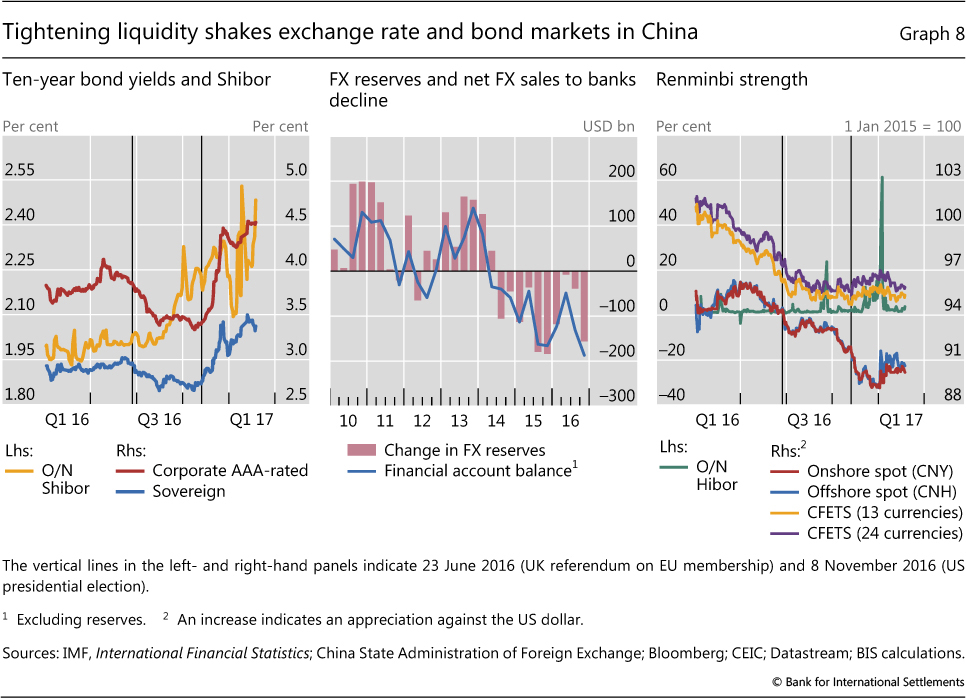
The renminbi had been subject to significant depreciation pressure against the dollar since September 2016, on the back of continued capital outflows. According to balance of payments data, 40% of the roughly $490 billion of outflows in 2016 took place during the fourth quarter (Graph 8, centre panel).8 Other indicators suggest that outflows continued in January, albeit at a slower pace. In particular, foreign currency reserves shrank by $12 billion following a $52 billion average monthly decline in the previous quarter.
Despite this backdrop, both the onshore (CNY) and the offshore (CNH) renminbi rose sharply at the beginning of the year (Graph 8, right-hand panel). From 3 to 5 January, the CNH staged the largest two-day gain on record, with a 2.5% appreciation against the dollar. During the same period, the CNY went up 1.3%, the largest two-day appreciation since China de-pegged its currency in July 2005. The sudden jump of the renminbi reflected, in part, a liquidity squeeze in the offshore funding market against the backdrop of the PBC's measures to contain capital outflows and the waning of the dollar's post-election rally. This curtailed persistent depreciation expectations, with the CNH shifting from discount to premium vis-à-vis the CNY. Liquidity in CNH, already scarce, dried up further as investors scrambled for cash to close short positions. The Hong Kong interbank offered rate (Hibor) jumped from 17.8% on 3 January to more than 61% on 6 January, close to the highest level on record. However, despite the Chinese currency's high volatility against the dollar, the CFETS index (comprising a basket of renminbi exchange rates) remained quite stable.9
Box B
From wealth management products to the bond market
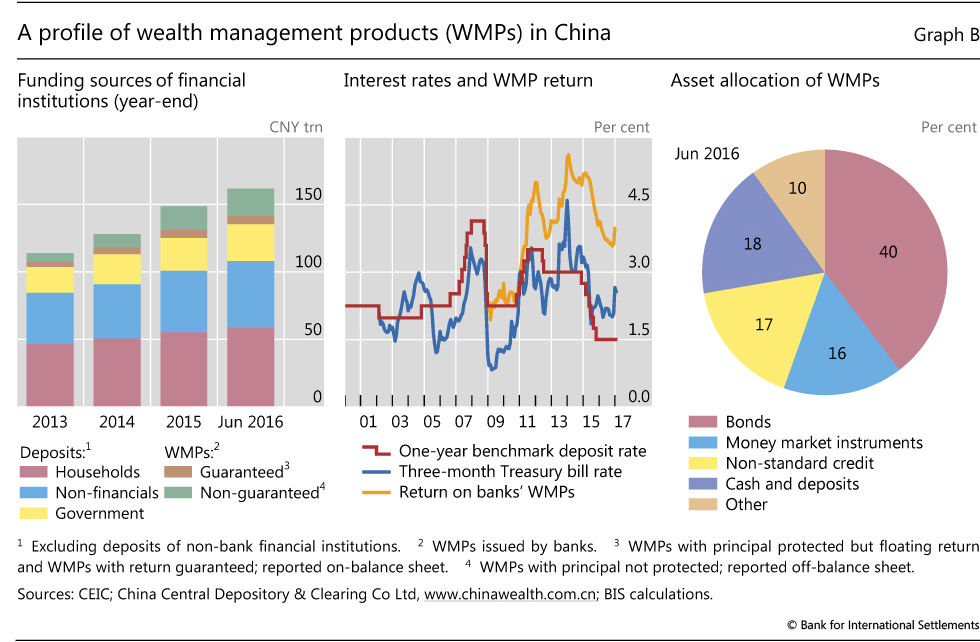
Over the past few years, banks' funding models in China have increasingly relied on wealth management products (WMPs) and corporate deposits (Graph B, left-hand panel). WMPs are saving products, issued by banks or other financial institutions, which offer relatively high returns compared with traditional bank deposits or Treasury bonds (centre panel). Some of these instruments carry principal and even return guarantees from the issuers, and are reported on-balance sheet. But the vast majority do not offer either, and are kept off the issuer's balance sheet. Despite carrying no explicit guarantees, the instruments are widely considered as safe by investors. As of end-June 2016, WMPs issued by banks totalled CNY 26.3 trillion, almost 40% of 2015 GDP. The proliferation of these instruments demonstrates that the traditional demarcations between banks and securities markets are not always clear-cut, and that any regulatory structure needs to take account of the connected nature of the system.
Banks are not only issuers but also buyers of WMPs. Reportedly, large banks often provide wholesale funding to small banks by purchasing their WMPs. Of the above total of CNY 26.3 trillion, about CNY 4 trillion was purchased by other banks. Moreover, large banks provide liquidity to small banks through interbank loans funded with the proceeds of their own issuance of WMPs. These loans made up the bulk of the 16% of money market instruments in the portfolio allocation of WMPs as of the first half of 2016 (Graph B, right-hand panel). These two channels could overlap, as the interbank loans sometimes involve the purchase of WMPs or the pledging of these as collateral.
In order to be able to keep WMPs off their balance sheets, banks often turn to securities firms to manage the funds collected through WMPs. As of last June, around 40% of the aggregate WMP portfolio was invested in the bond market (Graph B, right-hand panel). In order to enhance capital returns, and on the back of ample liquidity, securities firms reportedly leverage up their bond investments by using repurchase agreements. A significant part of these repurchase agreements take place through informal verbal agreements between market players and are not regulated. The upshot is the proliferation of fixed income portfolios with high leverage ratios.
The unwinding of these leveraged portfolios while the wholesale funding market was frozen appears to have led to the bond market stress in mid-December. As bond prices fell while liquidity tightened, the securities firms were forced to sell bonds in order to pay back the small banks, which in turn were facing pressure to repay the loans from larger banks. This eventually led to bond prices falling further as the liquidity squeeze moved through the funding chain.
1 Comparable paths can be traced for cross-regional and cross-sectoral correlations.
2 The review period ranges from late November 2016 to late February 2017.
3 See "A paradigm shift in markets?", BIS Quarterly Review, December 2016, pp 1-11.
4 See "Buoyant but fragile?", BIS Quarterly Review, December 2014, pp 1-12.
5 On consumption-driven growth, see E Kharroubi and E Kohlscheen, "Consumption-led expansions", BIS Quarterly Review, March 2017, pp 25-37.
6 See I Aldasoro, T Ehlers, E Eren and R McCauley, "Non-US banks' global dollar funding grows despite US money market reform", BIS Quarterly Review, March 2017, pp 22-3.
7 J Kearns and N Patel, "Does the financial channel of exchange rate offset the trade channel?", BIS Quarterly Review, December 2016, pp 95-113, find that the financial channel of exchange rate movements - the higher level and cost of foreign currency debt - partly offsets the trade channel for the average EME. They further find that both the trade and the financial channel are more prominent in Asia than in Latin America, and that the financial channel is stronger for EMEs that have issued more foreign currency debt.
8 Based on the preliminary balance of payments data release for Q4 2016.
9 On 29 December, CFETS announced an adjustment of the renminbi index effective from 1 January 2017. Eleven currencies were added to the basket, accounting for a 21.09% weight in the index.