Does the financial channel of exchange rates offset the trade channel?
While the trade channel indicates that an exchange rate depreciation will stimulate domestic economic activity, the financial channel can have the opposite effect. When banks and non-banks have foreign currency liabilities, an exchange rate depreciation has valuation effects that can lead to a tightening in domestic financial conditions. Using trade-weighted exchange rates and new BIS-constructed debt-weighted exchange rates to separate these influences, this article finds that the financial channel partly offsets the trade channel for emerging market economies but the effect is weaker for advanced economies.1
JEL classification: F31, F41, F43, G15.
The trade channel, or demand substitution channel, underpins the effect of the exchange rate on economic activity. An exchange rate appreciation raises the international cost of exports, reducing both export demand and the domestic cost of imports, leading to substitution away from domestic production. Thus, an appreciation is contractionary for domestic economic activity, while a depreciation is expansionary.
However, the links between economies go beyond trade. Extensive financial connections, and in particular the large stock of foreign currency borrowing, provide another crucial means by which external conditions can affect an economy. An appreciation of the local currency can strengthen the balance sheets of domestic borrowers in foreign currency, easing domestic financial conditions. This "financial channel" of exchange rates can act as a potential offset to the trade channel, in that an exchange rate appreciation boosts domestic economic activity through easier financial conditions. Conversely, a depreciation could negatively affect the economy by weakening domestic balance sheets. In this article we use the term financial channel interchangeably with "risk-taking channel", which is also sometimes used to describe this mechanism. There could also be some offsetting economic consequences from the exchange rate valuation effects of foreign currency assets. However, we expect the effects of exchange rate changes through foreign currency liabilities to predominate over those through foreign currency assets. Foreign currency assets are often held by "long-term" investors, such as pension funds, or foreign exchange reserves managers, from which valuation changes are likely to elicit smaller changes in spending. In addition, in much the same way as an interest rate cut can stimulate the economy by transferring income from savers to borrowers, an appreciation can stimulate the economy through the transfer of net wealth from foreign currency savers to borrowers.
Whether an exchange rate appreciation is contractionary or expansionary rests on whether the trade or financial channel predominates. The strength of the trade channel depends on the nature of trade flows, while the intensity of the financial channel depends on the sensitivity of domestic balance sheets to the exchange rate and the amount of foreign borrowing. The intensity of both of these channels can differ across countries for a range of reasons. So an appreciation may be contractionary for some countries but expansionary for others.
This article extends BIS (2016a) to consider empirically the relative strength of the trade and financial channels, taking into account differences between countries and providing some insight into the mechanisms at work by examining the response of GDP components. We find evidence that the financial channel partly offsets the trade channel for emerging market economies (EMEs) but that it is weaker for advanced economies. Investment is found to be particularly sensitive to the financial channel.
We first review the relevant empirical literature on the trade and financial channels. We then describe our empirical approach to examining the two channels. This involves the use of the trade-weighted exchange rate to capture the trade channel and the debt-weighted exchange rate to capture the financial channel. The construction of the latter, which draws on BIS debt statistics, is outlined in a box. We then present our results, first for GDP and then for GDP components.
The trade channel
The trade channel of exchange rates links changes in exchange rates to export and import volumes via the prices of traded goods. If export prices are fixed in domestic currency, then the full effect of an exchange rate depreciation will "pass through" to lower export prices as measured in the foreign currency. Foreign demand for exports typically increases as their foreign currency price falls, and so a depreciation will raise export volumes. Equivalently, a depreciation is typically passed through to higher domestic prices for imports, which will generally result in a lower volume of imports. Both import and export effects imply that an exchange rate depreciation increases net exports, while an appreciation reduces them.
However, pass-through to export and import prices may be incomplete, meaning that the change in foreign currency export prices and domestic currency import prices may be smaller than the change in the exchange rate. A range of factors influences the extent of exchange rate pass-through into trade prices as well as the response of trade volumes to the prices of traded goods. The strength of the trade channel can then differ widely across countries.
One important factor is the nature of trade. For example, if a country exports generic goods, such as commodities, for which there is a world price, there will likely be no pass-through of exchange rate changes to the export price, and domestic currency export prices will therefore fully reflect the exchange rate change. Conversely, for a specialised good, or one for which the exporting country is a major producer, the exporting country will generally have some influence over the world price, meaning there will be partial pass-through. Equivalently the degree of pass-through to import prices will depend on whether these prices are set in the local currency or the producer's currency.
Further, traded goods prices may not be invoiced in the currency of the importer or exporter, but in a specific "invoicing currency" such as the US dollar. In this case the exchange rate against this invoicing currency will be the one relevant for traded goods price and volume effects.2
An exchange rate depreciation can stimulate economic activity through exports even if there is no pass-through to foreign currency export prices. If foreign currency export prices are unchanged with a depreciation, then the domestic currency price of exports will rise. The increased profits resulting from higher prices can stimulate investment through greater retained earnings, or consumption through higher payments to the owners of exporting firms. Through the same mechanism, an appreciation can depress economic activity.
Researchers have documented several ways in which the composition of a country's trade flows can influence the observed aggregate pass-through. Service prices have been found to be more responsive to exchange rates in the short run (Cole and Nightingale (2016)), while more specialised goods tend to have variable markups and so their prices are less sensitive to exchange rate movements (Burstein and Gopinath (2014)). Pass-through can depend not only on the type of export but also the characteristics of the exporting firm. Amiti et al (2014) show that, while pass-through is nearly complete for small non-importing firms, for large import-intensive exporters it is only half so. Berman et al (2012) find that highly productive firms vary their markup and so have less pass-through in response to exchange rate movements. Trade elasticities can also be influenced by country-level factors. Bussière et al (2014) find that export price elasticities are higher in EMEs than in advanced economies, primarily because of macroeconomic factors. Indeed, they find that export and import price elasticities are correlated across countries.
The extent of pass-through can also vary over time, for structural and cyclical reasons. Campa and Goldberg (2005) showed that much of the change in exchange rate pass-through had resulted from shifts in the composition of countries' imports. Pass-through can also decline because of growing trade integration (Gust et al (2010)) and in particular because of the increasing role of global value chains (see Ahmed et al (2015) and Kharroubi (2011) on how this also influences trade balances). Cyclically, the extent of pass-through can also depend on a range of factors including the strength of external demand (Bussière et al (2013)) and the level of interest rates (Alessandria et al (2013)). Moreover, pass-through can also vary depending on the nature of shocks hitting the economy, as shown by Forbes et al (2015).
Overall, the strength of the trade channel for an economy will depend not only on the responsiveness of traded goods prices and volumes to the exchange rate but also on the share of exports and imports in economic activity (the trade share). Hence it is not surprising that the strength of this channel is typically found to differ markedly across countries. Auboin and Ruta (2011) and Leigh et al (2015) provide more detailed surveys of the extensive literature on the relationship between the exchange rate and trade.
The financial channel
The financial channel of exchange rates, sometimes also referred to as the risk-taking channel, works in the opposite direction to the trade channel. The financial channel describes how exchange rate movements influence the supply and cost of foreign funding, and hence domestic economic activity.3
The risk-taking channel is present whenever borrowers' balance sheets are sensitive to exchange rate changes. This sensitivity can result from an imbalance in the currency denomination of a firm's assets and liabilities or in the relationship of net cash flows to the exchange rate. The simplest case is when there is an unhedged currency mismatch, for example when a non-financial corporate borrows in foreign currency to finance domestic currency assets such as real estate. Also, if a bank makes foreign currency loans to domestic firms, currency fluctuations will ultimately affect the bank's credit quality, and hence lending and funding decisions. If a borrower has local currency assets but foreign currency borrowing, then its net worth rises with an appreciation of the local currency. Similarly, firms' cash flows may rise with the local currency; for example, the price of oil tends to be inversely related to the strength of the dollar and so non-US oil producers' revenue can rise with a dollar depreciation.
There can be both a price and quantity aspect to the financial channel. The improved creditworthiness of borrowers that comes with a local currency appreciation can lift the supply of foreign currency lending.4 Bruno and Shin (2015a) find that a depreciation of the dollar, from expansionary US monetary policy, results in an increase in cross-border banking capital flows and a rise in the leverage of international banks. Bruno and Shin (2015b) find empirical support for their model in which local currency appreciation is associated with higher leverage of the domestic banking sector through its interaction with global banks. Indeed, BIS (2016b) shows that a 1% depreciation of the dollar is associated with a 0.6 percentage point increase in the quarterly growth rate of dollar-denominated cross-border lending. In addition, if an appreciation results in an apparently lower risk profile for foreign currency borrowers, this may reduce their risk spreads and hence their borrowing costs. But this effect only seems to be present for appreciation vis-à-vis the funding currency: Hofmann et al (forthcoming) find that risk spreads decline as EME currencies appreciate against the dollar but not if they appreciate against other currencies.
The financial channel can thus lead to a cycle through which appreciation against global funding currencies increases the supply, and reduces the cost, of foreign lending. This will boost interest-sensitive domestic spending. Conversely, a contraction in financial conditions and economic activity will follow a local currency depreciation. These effects will generally be more potent in EMEs, where unhedged foreign currency exposures are more likely to be present, in part because of less-developed financial systems. However, advanced economies may be affected too. Rey (2015) finds that US monetary policy shocks are transmitted internationally even to countries with developed financial markets and flexible exchange rates.
Importantly, the relevant exchange rate for the financial channel is the one against international funding currencies, predominantly the US dollar and increasingly the euro, but also the yen, Swiss franc and pound sterling. In contrast, the trade channel is sensitive to the trade-weighted exchange rate, ie the weighted exchange rate against countries with which the country trades and competes in global markets.5
Data and methodology
To test empirically the relative importance of the trade and financial channels, we estimate models of GDP growth and its components with the trade-weighted and debt-weighted exchange rates as key explanatory variables. The nominal effective exchange rate (NEER, which is trade-weighted) should capture the trade channel, while the BIS-constructed debt-weighted exchange rate (DWER) proxies for the financial channel.6 The DWER uses the shares of foreign currency debt to weight a country's bilateral exchange rates, as described in Box A.
We use a univariate autoregressive distributed lag (ARDL) model to compute the short- and long-run elasticity of GDP and its components with respect to the two exchange rate variables. In principle, both GDP and exchange rates could be driven by a common (unmodelled) factor, or the causality may run from GDP growth to exchange rates. For instance, financial booms can coincide with exchange rate appreciations. We take two steps to limit such concerns. First, we include control variables to account for domestic and foreign factors that could influence the relationship between exchange rates, and GDP and its components. Second, acknowledging the autocorrelation in the data given the quarterly frequency, we include lags of both the dependent and the independent variables. The lagged dependent variables are particularly useful in mitigating the consequences of model misspecification in quarterly data.
The model is given by Equation (1):
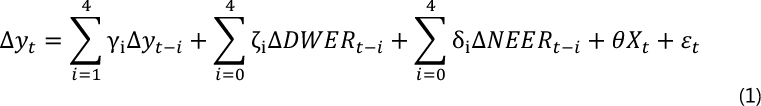
where the dependent variable is the growth of quarterly GDP (or its components:
Box A
Debt-weighted exchange rate indices
There are several possible ways of calculating debt-weighted exchange rate (DWER) indices, depending on what measure of debt is used to weight bilateral exchange rates. More concretely, the debt measure could vary along two main dimensions: the currency of denomination and the residence of lenders (Table A).
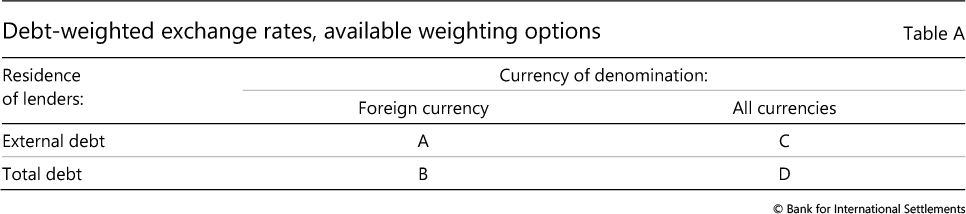
The first possible debt measure is foreign currency-denominated external debt (cell A in Table A). This is the narrowest of the four possible measures. It does not take into account the importance of external debt in total debt and the importance of domestic currency debt in external debt. Consequently, for countries whose foreign currency-denominated external debt is a modest share of total debt (eg the United States), even large swings of the index would have a minor impact on domestic financial conditions.
The second potential debt measure is total foreign currency-denominated debt (cell B in Table A). This is a more complete measure than the one in cell A since it incorporates local debt denominated in foreign currencies. That said, it still suffers from the problem that total foreign currency debt could be a relatively small share of total debt for certain economies (eg China).
The third possible debt measure is external debt denominated in all currencies (cell C in Table A). This measure, which is conceptually very close to the one constructed by Bénétrix et al (2015), is more complete than the one in cell B since it also incorporates information on external debt denominated in the local currency of the borrowing country. Nevertheless, it ignores any local debt, including local debt denominated in foreign currencies. Therefore, it could provide a misleading picture for countries in which a large portion of the domestic debt is denominated in foreign currencies (eg the Czech Republic, Hungary and Poland).
The final potential debt measure is total debt denominated in all currencies (cell D in Table A). This is the most comprehensive of the four measures since it includes total debt and a weight is given to debt in domestic currencies. Nevertheless, this measure tends to be too broad for addressing a large number of questions. For example, the value of the index is likely to be very close to 1 for countries in which the share of domestic debt in domestic currency is large (eg China). In theory, the "total debt" used for the construction of DWER indices should encompass the debt of only those entities that can actually choose their financing currency. In practice, however, this perimeter is not easily identifiable.
We opt to construct our benchmark DWER indices using the weights based on foreign currency-denominated total debt (ie cell B in Table A). While none of the above four measures is perfect, we select that particular one because it strikes the optimal balance between conceptual comprehensiveness and computability. Furthermore, it is the most direct counterpart to the trade-weighted exchange rate (NEER and REER) indices that are typically used in the existing empirical literature. That is, it captures the distribution of the foreign currency components of total debt (regardless of how large foreign currency debt is relative to debt in all currencies) in the same way that trade-weighted exchange rate indices capture the distribution of the foreign trade component of GDP (regardless of how large foreign trade is relative to GDP).
In more concrete terms, the DWER that we construct for each country is the geometric average of its bilateral exchange rates against each of the five major global funding currencies (US dollar, euro, Japanese yen, pound sterling and Swiss franc), weighted by the shares of these global funding currencies in that country's foreign currency debt. The weight of currency j at quarter t in the DWER index for country i is calculated using the following formula:
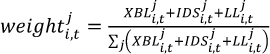
where: XBL = cross-border loans to non-banks denominated in foreign currencies (BIS LBS data)
data)
IDS = international debt securities statistics denominated in foreign currencies, issued by non-banks (BIS IDSS data)
data)
LL = local loans to non-banks denominated in foreign currencies (BIS LBS data)
Weights are calculated on a quarterly basis. For all days in a quarter, the end-of-quarter weights of the preceding quarter are applied (eg using end-Q3 2015 weights for all days in Q4 2015). When one of the five currencies is the home currency of a given country (eg the yen in Japan), only the remaining four currencies are used to calculate the DWER weights for the respective country. For countries that joined the euro after the currency's launch, the euro is treated as a foreign currency until the quarter in which the country joined the euro. For example, in the case of Estonia, the euro is treated as a foreign currency until Q1 2011.
The XBL and the LL series are taken directly from the BIS locational banking statistics (LBS). The IDS series are taken directly from the BIS international debt securities statistics data. When not available, we use one of the three following estimates:
- For countries which do not report data to the BIS LBS, local loans in foreign currency j are proxied by cross-border loans denominated in currency j to banks in the respective country. Since the United States does not report local loans in foreign currencies, this estimate is used for the United States as well.
- For countries that started reporting local loans in foreign currency after the sample period started, LL in currency j are proxied by multiplying cross-border loans to banks (in currency j) by the maximum of 1 and the average of the ratio of reported local claims on non-banks to cross-border claims on banks for the first eight reported quarters. When the ratio exceeds 1, the new-reporter estimate follows the same methodology as that of the non-reporter estimate.
- For China, local loans in foreign currencies are taken from national data and are assumed to comprise 80% USD, 10% EUR, 10% JPY, 0% GBP and 0% CHF, following a methodology similar to the one used by McCauley et al (2015).
The 61 countries for which debt-weighted exchange rate indices were calculated can be roughly split into four groups:
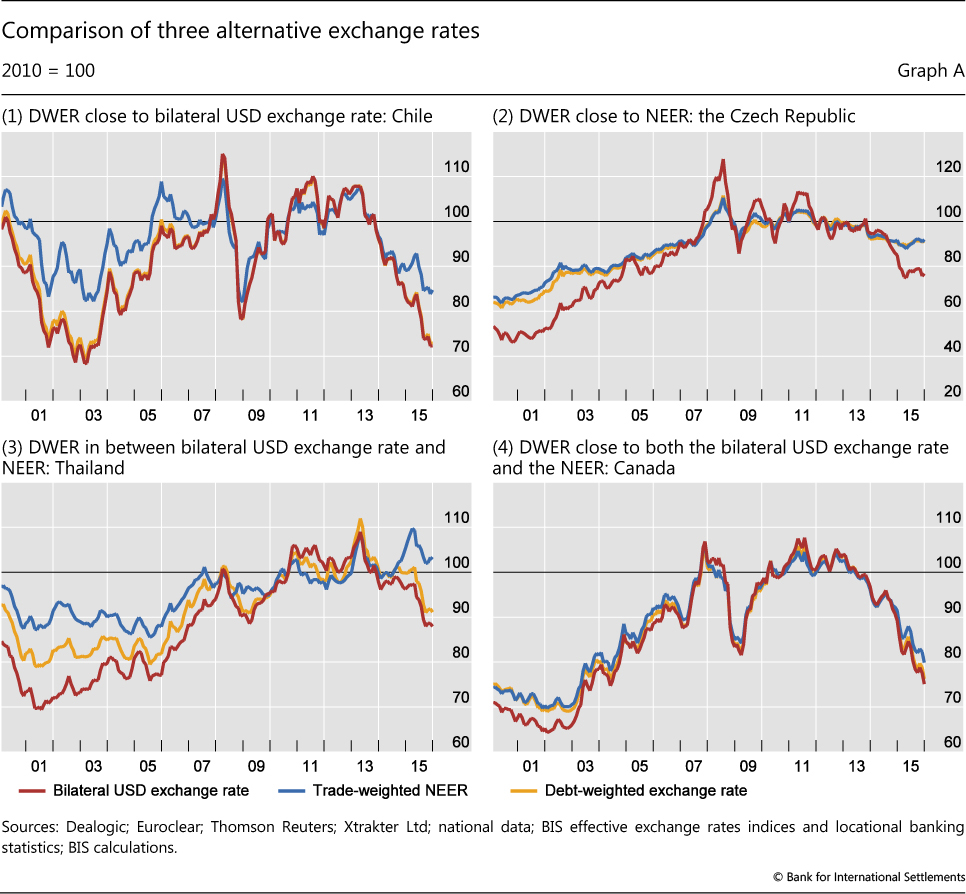
1. Countries for which the DWER closely follows the bilateral US dollar exchange rate. This is, for example, the case for most Latin American countries, as illustrated by Chile in the upper left-hand panel of Graph A above. About 25% of the countries in the sample fall in this category.
2. Countries for which the DWER and the trade-weighted NEER index (as measured by the BIS effective exchange rate indices) are very similar. This is the case for several emerging European countries, as can be seen for the Czech Republic in the upper right-hand panel of Graph A, but is not very common in general (less than 10% of the sample falls into this category).
3. Countries for which the DWER falls between the bilateral US dollar exchange rate and the trade-weighted index. This is the case for more than half of the countries in the sample and is most prominent among euro area countries and several countries in emerging Asia. An example is Thailand, whose exchange rate is shown in the lower left-hand panel of Graph A.
4. Countries for which the DWER, the bilateral US dollar exchange rate and the trade-weighted NEER index are virtually the same, which is the case for slightly more than 10% of the sample. Often this involves countries that trade heavily with the United States, as Canada illustrates in the bottom right-hand panel of Graph A (the average trade weight of the United States in the NEER index for Canada was 62.6% between 1999 and 2013).
BIS locational banking statistics. BIS international debt securities statistics.
investment, private consumption, government consumption, exports and imports) and ΔDWER and ΔNEER are the exchange rate variables. For each country, we estimate the regressions using the first differences of the log of each variable and include contemporaneous values as well as four lags of the exchange rate variables, and four lags of the dependent variable. The control variables, Xt, are: changes in domestic prices (measured by the GDP deflator); the policy rate; a global commodity price index; a foreign producer price index and a measure of foreign demand (measured respectively as the export-weighted change in the foreign producer price index and foreign GDP); a dummy variable for financial crisis (which takes the value 1 for years 2008 and 2009) and the financial crisis dummy interacted with the foreign demand variable.7 A time trend is also included in all regressions. In addition, the regressions for exports and imports also include domestic absorption (measured as the sum of private consumption, government consumption and investment) to control for domestic demand.8 While the exchange rate can be expected to affect aggregate economic activity though its impact on absorption, in the import and export regressions we include absorption as a control variable in order to see if there is an additional effect on trade volumes through the financial channel, given that tradeable sectors are particularly exposed to exchange rate movements.
Our sample consists of 44 countries: 22 advanced economies and 22 EMEs. The full list of countries along with the country group classifications and sample periods is shown in the Appendix. The full sample runs until Q3 2016 and starts as early as Q1 1990 for some countries. However, for most countries, it is constrained by data availability to start in the mid-1990s.
Results and discussion
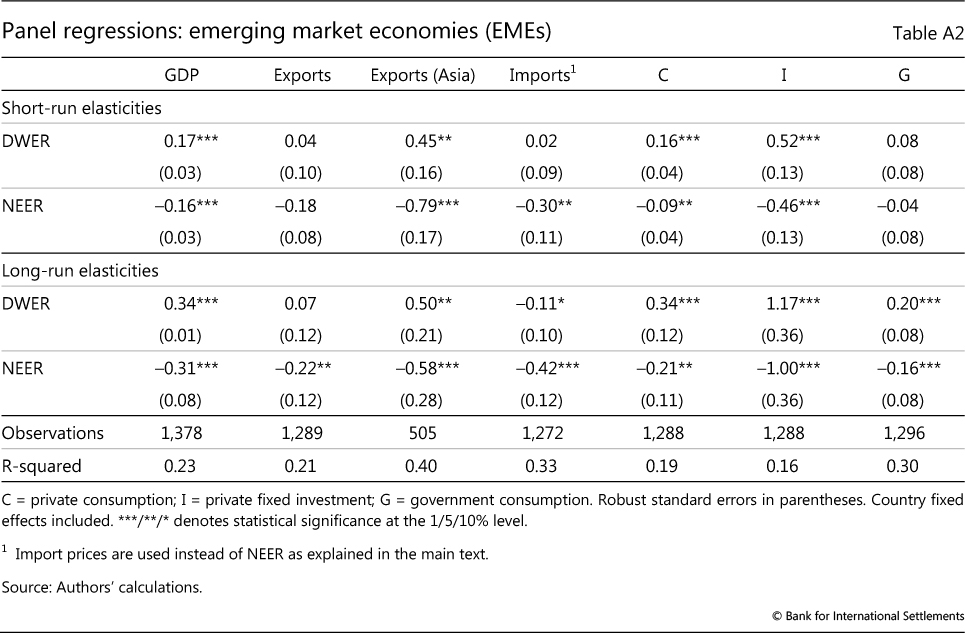
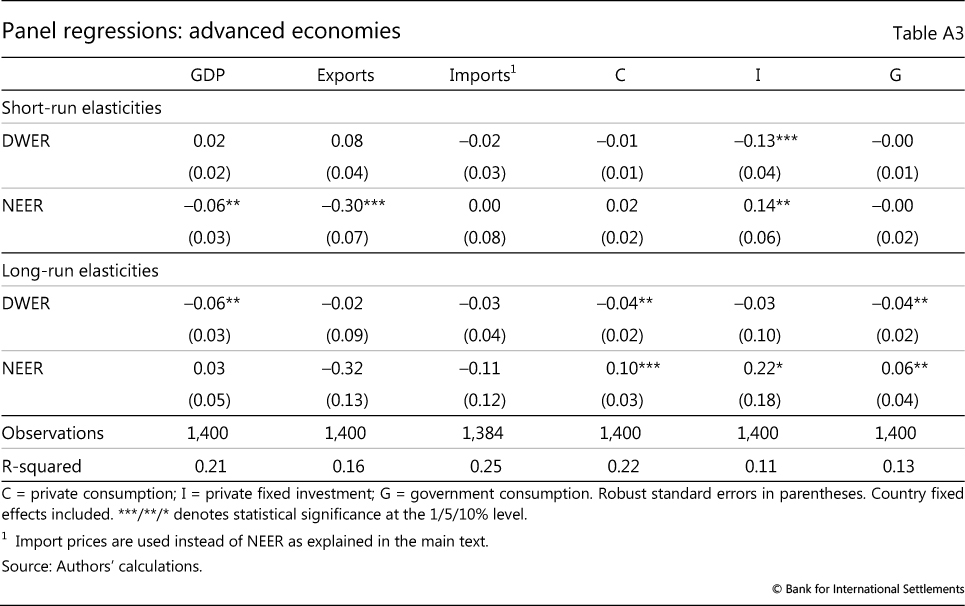
In order to allow for heterogeneity across countries, we analyse results from time series regressions that are run separately on each country and report medians across different country groups. As a complement to this analysis and to check for robustness and statistical significance, we also conduct panel regressions, which are reported in Appendix Tables A2 and A3.
GDP
Table 1 summarises the results for GDP growth, reporting the medians across country groups of short-run and long-run elasticities with respect to the two exchange rate measures.9 The estimates provide strong support in favour of the existence of both the financial and the trade channels for EMEs.
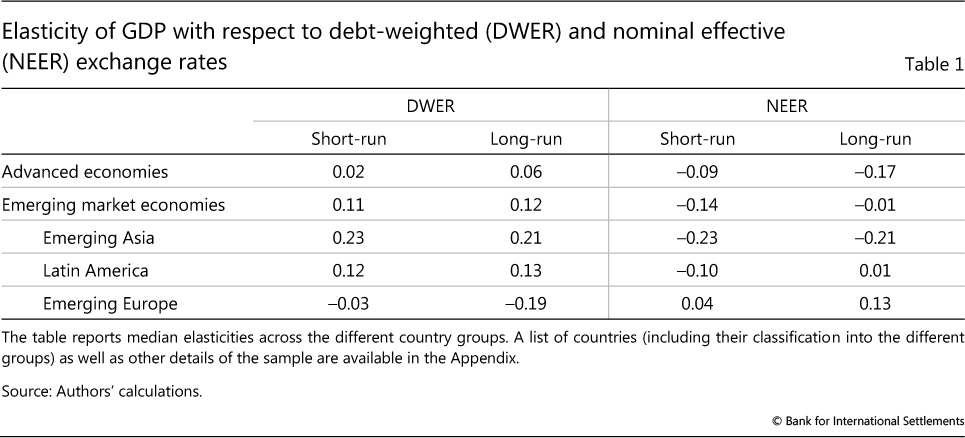
The positive elasticity for the DWER indicates that an appreciation tends to raise growth, while the negative elasticity for the NEER indicates that an appreciation tends to reduce growth. For the median EME, a 1% appreciation of the debt-weighted exchange rate leads to an increase in quarterly GDP growth of 0.1% in both the short and long run.10 Indeed, for 13 out of 22 EMEs, the sum of the DWER and NEER elasticities is positive, indicating that an equal appreciation of both measures would be expansionary. The coefficient estimates are statistically significant for many, but not all, of the individual countries. An alternative approach, using a panel that imposes identical elasticities for all EMEs, also implies that the trade and financial channels are both important with statistically significant positive and negative elasticities on the DWER and NEER, respectively, in both the short and long run (Appendix Tables A2 and A3). For advanced economies, while evidence for the trade channel is also strong, evidence for the financial channel is weaker, with the median elasticity with respect to the DWER being small. For only five out of 23 advanced economies is the sum of the DWER and NEER elasticities positive. These results are in line with estimates from panel regressions in BIS (2016a) that did not consider country heterogeneity
Both the trade and financial channels are more prominent in Asia than in Latin America. The DWER elasticity is twice as large in Asia as in Latin America, and the difference in NEER elasticity is even starker. Interestingly, and somewhat surprisingly, we do not find any evidence of a financial channel for European EMEs.11
The financial channel is stronger for EMEs with more foreign currency debt. Specifically, in the EME sample there is a positive, and statistically significant, relationship across countries between the DWER elasticity and foreign currency debt as a fraction of GDP in the short run (Graph 1).12 This positive relationship exists for the full sample of EME countries and is also present for those with a statistically significant relationship between GDP and the DWER.
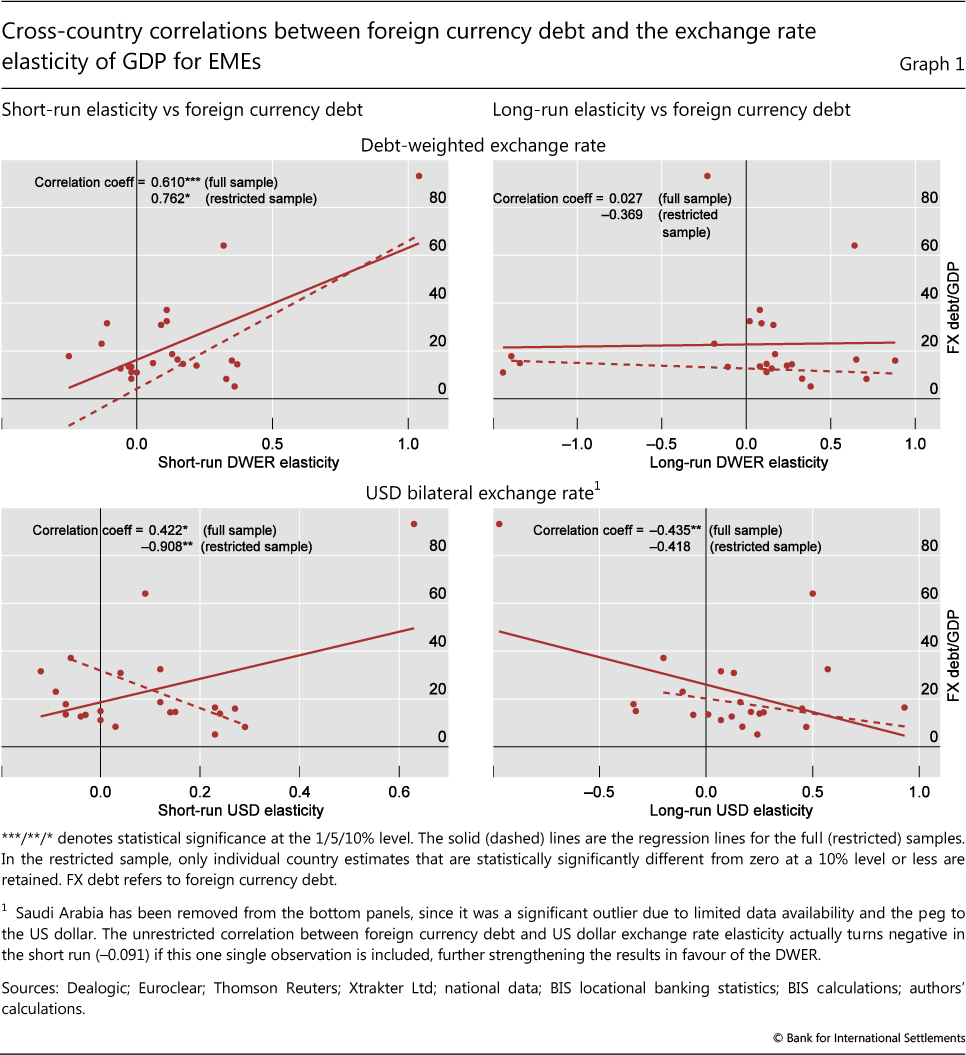
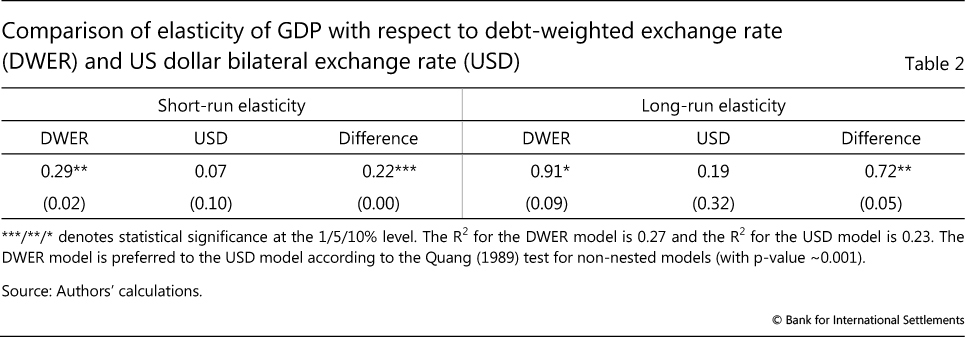
The natural alternative to our DWER measure for capturing the financial channel is the US dollar. Rey (2016) has argued that the dollar exchange rate is the main driver of the global financial cycle through its link to US monetary policy. To evaluate the strength of this alternative, we re-estimate our benchmark model by replacing the DWER with the bilateral nominal dollar exchange rate. It is noteworthy that the positive cross-correlation between the DWER elasticity and the share of foreign currency debt to GDP across EMEs is weaker in the short run when the DWER is replaced by the dollar exchange rate. In fact, it is negative when based only on those countries with a statistically significant relationship between GDP growth and the bilateral dollar exchange rate (Graph 1, lower panel).13 The DWER is seemingly a better measure of the financial impact of exchange rates, as it can explain the differences in the strength of the financial channel across countries.
To further compare the ability of the DWER and dollar exchange rate to uncover the financial channel, we conduct panel regressions. These use the same specification above for the five EMEs for which the correlation between quarterly changes in the DWER and dollar exchange rate is lowest (less than 0.85). As shown in Table 2, the model with the DWER outperforms the model with the dollar based on a model comparison test (the test for non-nested models from Quang (1989)). In addition, the elasticity on the DWER is significantly higher than the equivalent elasticity on the dollar in both the short and long run.
In order to provide some indication of how the financial channel affects output growth, Equation (1) is estimated for imports, exports and other components of GDP. These results follow.
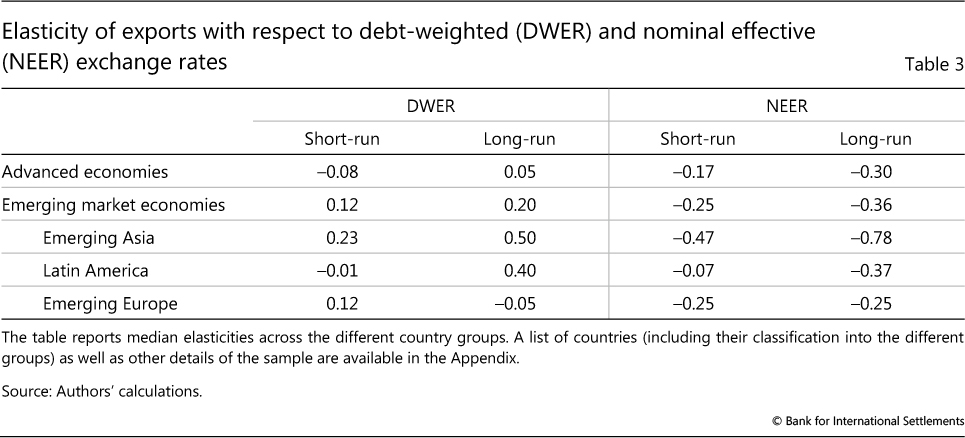
Exports
Just as for GDP growth, country regressions for export growth suggest that the financial and trade channels are both evident for EMEs, whereas for advanced economies the financial channel is weak (Table 3). Moreover, both channels are stronger for Asian EMEs than for Latin American economies, which is also confirmed by our panel regression results as reported in the Appendix. While the signs of these elasticities are generally confirmed by alternative panel models, only the trade channel is found to be statistically significant (Appendix Tables A2 and A3). Overall, while the export elasticities indicate that the trade channel has a significant effect on GDP growth through exports, there is tentative evidence of an offsetting impact through the financial channel.
Imports
Unlike in the case of GDP and export growth, the theoretical implications of the financial channel for imports are ambiguous. An improvement in financial conditions can lead to an increase in imports because of easier access to trade finance for importers or increases in net wealth resulting from a currency mismatch in assets and liabilities (including households with foreign currency mortgages). This would imply a positive elasticity of imports with respect to the DWER. Alternatively, easier financial conditions could enhance the competitiveness of domestically produced import substitutes that may reduce the demand for imports, implying a negative elasticity of imports with respect to the DWER. In contrast, the implications for imports through the trade channel are clear: an appreciation boosts the import of cheaper foreign goods and services.
In order to capture the trade channel for imports, we replace the NEER with import prices measured in local currency, which is a better measure of the competitiveness of imports vis-à-vis domestic production.14 The results in Table 4 show that for advanced economies and EMEs (with the exception of those in Europe) the trade channel is apparent in the negative elasticities on import prices (implying that a fall in import prices leads to a rise in imports).
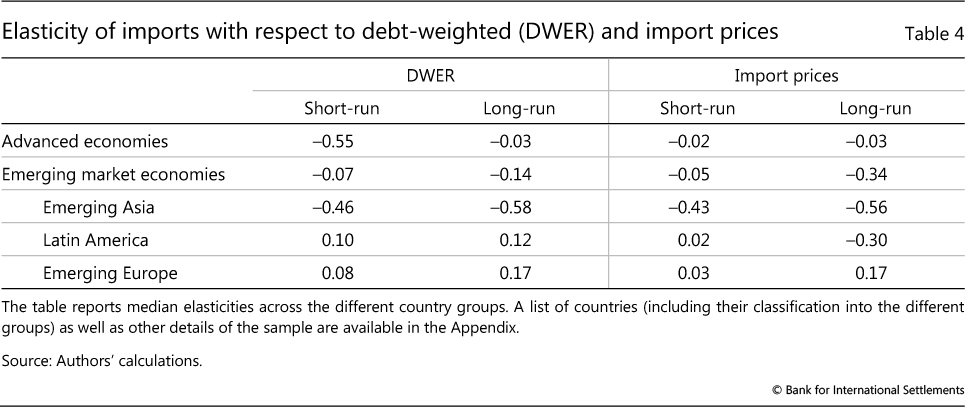
In contrast, the results for the financial channel vary across countries. For EMEs in Latin America and Europe, the elasticity of the DWER is positive, indicating that the effect of the cost of funding for imports dominates, with an exchange rate appreciation boosting imports. In contrast, for Asian EMEs and advanced economies, the DWER elasticity is negative, indicating that an appreciation reduces imports, possibly because it boosts import-competing industries through the financial channel. As was the case for exports, alternative panel models suggest that the impact through the trade channel is statistically significant, but that through the financial channel is not (Appendix, Tables A2 and A3).
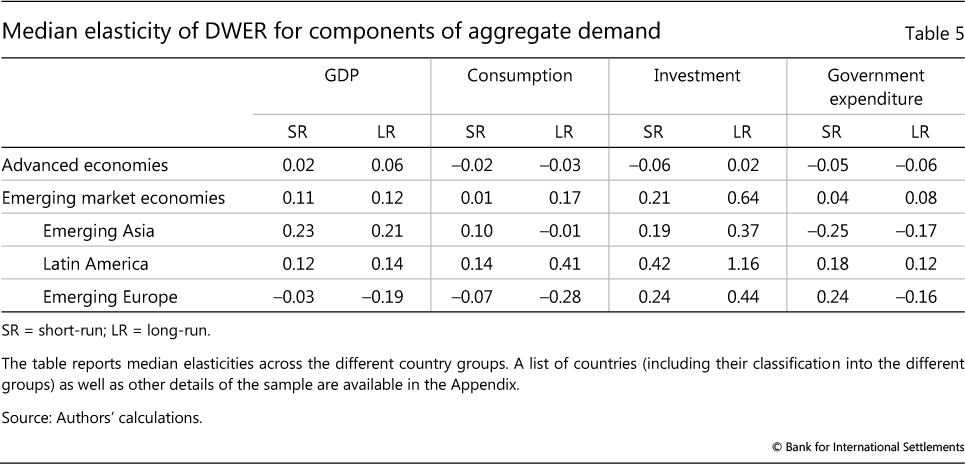
Domestic absorption: investment and private and public consumption
Examining the components of GDP suggests that the financial channel of exchange rates operates strongly through investment, a finance-intensive form of spending. The exchange rate elasticities for investment (gross fixed capital formation), private consumption and government consumption are shown in Table 5. For EMEs, the elasticities of investment with respect to the DWER are substantially higher than those of the other components of aggregate demand, in particular private consumption. The relative magnitudes and statistical significance are also confirmed in panel regressions (Appendix Tables A2 and A3). These results are consistent with the view that financial frictions matter more for investment than they do for consumption. This is especially so in EMEs, where the corporate sector often has more unhedged foreign currency debt.
Conclusion
Our evidence suggests that the trade channel is not the only determinant of how economies respond to exchange rate movements; the financial channel also matters. We find that the financial channel can be a significant offset to the trade channel at the macroeconomy level, particularly for EMEs. Our results suggest that the BIS debt-weighted exchange rate is an improvement over the alternative of using the bilateral US dollar exchange rate to capture the financial effects of exchange rates. Among the components of GDP, the financial channel is seemingly present for exports, pointing to a link between financial conditions and trade competitiveness. The financial channel is also stronger for investment than for private consumption. Since investment is more reliant on foreign currency debt than is consumption, especially in EMEs, these findings provide further support for the presence of a risk-taking channel that amplifies the financial cycle.
By showing how the financial channel can substantially offset the impact of the traditional trade channel, these results outline the challenges faced by policymakers in countries where the financial channel of exchange rates is prominent. For instance, in an economy requiring a stimulus because of an adverse demand shock, if the trade and financial channels are likely to offset each other, then exchange rate devaluation would fail to provide the desired stimulus, and in some cases could even be contractionary. The onus then falls on other demand management policies.
This article offers a first attempt at quantifying the extent of the offset between the trade and financial channels of exchange rates. It also opens up several avenues for future exploration. Our exercise focuses on the dynamic elasticities of GDP and its components to exchange rates. Thus, studying dynamic responses to specific episodes of large exchange rate changes would be a natural complement to our analysis. Moreover, our focus is on cross-country comparisons. A complementary approach would be to examine potential non-linearities in the relationships we document and to look at changes in the strength of the two channels over time by considering longer samples for selected countries.15
References
Ahmed, S, M Appendino and M Ruta (2015): "Depreciations without exports? Global value chains and the exchange rate elasticity of exports", World Bank Policy Research Working Paper, no 7390, August.
Alessandria, G, S Pratap and V Yue (2013): "Export dynamics in large devaluations", Board of Governors of the Federal Reserve System, International Finance Discussion Papers, no 1087, August.
Amiti, M, O Itskhoki and J Konings (2014): "Importers, exporters and exchange rate disconnect", American Economic Review, vol 104, no 7, pp 1942-78.
Auboin, M and M Ruta (2011): "The relationship between exchange rates and international trade: a review of economic literature", World Trade Organization, Staff Working Paper, ERSD-2011-17, October.
Bank for International Settlements (2016a): 86th Annual Report, "Exchange rates: stabilising or destabilising?", Box III.B, pp 54-5.
--- (2016b): 86th Annual Report, "The global economy: realignment under way?", Chapter III, pp 43-61.
Bénétrix, A, P Lane and J Shambaugh (2015): "International currency exposures, valuation effects and the global financial crisis", Journal of International Economics, vol 96, no 1, pp 98-109.
Berman, N, P Martin and T Mayer (2012): "How do different exporters react to exchange rate changes?", Quarterly Journal of Economics, vol 127, no 1, pp 437-92.
Bordo, M, C Meissner and D Stuckler (2010): "Foreign currency debt, financial crises and economic growth: a long-run view", Journal of international Money and Finance, vol 29, no 4, pp 642-65.
Borio, C and H Zhu (2012): "Capital regulation, risk-taking and monetary policy: a missing link in the transmission mechanism?", Journal of Financial Stability, vol 8, no 4, pp 236-51.
Bruno, V and H S Shin (2015a): "Capital flows and the risk-taking channel of monetary policy", Journal of Monetary Economics, vol 71, pp 119-32.
--- (2015b): "Cross-border banking and global liquidity", Review of Economic Studies, vol 82, no 2, pp 535-64.
Burstein, A and G Gopinath (2014): "International prices and exchange rates", Handbook of International Economics, fourth edition, Elsevier, pp 391-451.
Bussière, M, G Callegari, F Ghironi, G Sestieri and N Yamano (2013): "Estimating trade elasticities: demand composition and the trade collapse of 2008-09", American Economic Journal: Macroeconomics, vol 5, no 3, pp 118-51.
Bussière, M, S Delle Chiaie and T Peltonen (2014): "Exchange rate pass-through in the global economy: the role of emerging market economies", IMF Economic Review, vol 62, no 1, pp 146-78.
Campa, J, M and L Goldberg (2005): "Exchange rate pass-through into import prices", Review of Economics and Statistics, vol 87, no 4, pp 679-90.
Casas, C, F Diez, G Gopinath and P Gourinchas (2016): "Dollar pricing redux", mimeo.
Cespedes, L, R Chang and A Velasco (2004): "Balance sheets and exchange rate policy", American Economic Review, vol 94, no 4, pp 1183-93.
Cole, D and S Nightingale (2016): "Sensitivity of Australian trade to the exchange rate", Reserve Bank of Australia Bulletin, September, pp 13-20.
Forbes, K, I Hjortsoe and T Nenova (2015): "The shocks matter: improving our estimates of exchange rate pass-through", Bank of England, Discussion Paper, no 43, November.
Gillitzer, C and A Moore (2016): "Trade invoicing currency and first-stage exchange rate pass-through", Reserve Bank of Australia, Research Discussion Paper, no 2016- 05, June.
Gopinath, G (2015): "The international price system", proceedings of the Federal Reserve Bank of Kansas City Jackson Hole symposium, forthcoming.
Gopinath, G, O Itskhoki and R Rigobon (2010): "Currency choice and exchange rate pass-through", American Economic Review, vol 100, no 1, pp 304-36.
Gust, C, S Leduc and R Vigfusson (2010): "Trade integration, competition, and the decline in exchange-rate pass-through", Journal of Monetary Economics, vol 57, no 3, pp 309-24.
Hofmann, B, I Shim and H S Shin (forthcoming): "Sovereign yields and the risk-taking channel of currency appreciation", BIS Working Papers.
Jasova, M, R Moessner and E Takats (2016): "Exchange rate pass-through: what has changed since the crisis?", BIS Working Papers, no 583.
Kharroubi E (2011): "The trade balance and the real exchange rate", BIS Quarterly Review, September, pp 33-42.
Leigh, D, W Lian, M Poplawski-Ribeiro and V Tsyrennikov (2015): "Exchange rates and trade flows: disconnected?", IMF, World Economic Outlook, October, pp 105-42.
McCauley, R, P McGuire and V Sushko (2015): "US monetary policy, leverage and offshore dollar credit", Economic Policy, vol 30, no 82, pp 187-229.
Quang, V (1989): "Likelihood ratio tests for model selection and non-nested hypotheses", Econometrics, vol 57, no 2, pp 307-33.
Rey, H (2015): "Dilemma not trilemma: the global financial cycle and monetary policy independence", National Bureau of Economic Research, NBER Working Paper, no 21162.
--- (2016): "International channels of transmission of monetary policy and the Mundellian trilemma", IMF Economic Review, vol 64, no 1, pp 6-35.
Shin H S (2015): "Exchange rates and the transmission of global liquidity", speech to Bank of Korea-IMF conference, 11 December.
--- (2016): "Global liquidity and procyclicality", speech to the World Bank conference, "The state of economics, the state of the world", Washington DC, 8 June.
Appendix:
Sample
Quarterly: ending Q2 2016, with the start date varying by country according to data availability.
Countries (beginning of sample is given in parenthesis):
- Advanced economies (22):
- Austria (Q1 1993), Australia (Q1 1993), Belgium (Q1 1994), Canada (Q1 1993), Switzerland (Q1 1999), Germany (Q1 1993), Denmark (Q1 1993), Spain (Q1 1994), Finland (Q1 1993), France (Q1 1993), United Kingdom (Q1 1993), Greece (Q1 1994), Ireland (Q1 1996), Italy (Q1 1993), Japan (Q1 1993), Luxembourg (Q1 1994), Netherlands (Q1 1993), Norway (Q1 1993), New Zealand (Q1 1998), Portugal (Q1 1994), Sweden (Q1 1993), United States (Q1 1993).
- EMEs - Asian (10):
- China (Q1 1999), Hong Kong SAR (Q1 1998), Indonesia (Q1 1995), India (Q1 1999), Korea (Q1 1993), Malaysia (Q1 1994), Philippines (Q1 1997), Saudi Arabia (Q1 2009), Singapore (Q1 1993), Thailand (Q1 1999).
- EMEs - Latin American (five):
-
Argentina (Q1 1994), Brazil (Q1 1994), Chile (Q1 1996), Colombia (Q1 1996), Peru (Q1 1999).
- EMEs - European (five):
-
Czech Rep. (Q1 1995), Hungary (Q1 1994), Israel (Q1 1995), Poland (Q1 1994), Turkey (Q1 2001).
- EMEs - Other (two)
-
Russia (Q1 1994), South Africa (Q1 1993).
Panel regressions
Tables A2 and A3 display results from estimation of Equation (1) for different GDP components for a panel on EMEs and advanced economies separately. Country fixed effects are included in each regression.
1 We thank Emese Kuruc for excellent research support and Stefan Avdjiev, Claudio Borio, Ben Cohen, Hyun Song Shin and Christian Upper for useful comments and suggestions. The views expressed are those of the authors and do not necessarily reflect those of the BIS.
2 Gopinath (2015) shows that countries with more trade invoiced in their local currency generally have lower pass-through to import prices. Other studies find equivalent results for individual countries, including Gopinath et al (2010), and Gillitzer and Moore (2016). See also Casas et al (2016).
3 The financial channel relates to the broader risk-taking channel of monetary policy, as outlined in Borio and Zhu (2012). The financial channel has been described in Shin (2015, 2016) and BIS (2016b). It also relates to the broad literature on the implications of foreign currency debt and currency mismatches in EMEs, see eg Cespedes et al (2004) and Bordo et al (2010).
4 For example, Shin (2015) notes that foreign lenders with a fixed exposure limit, say resulting from a value-at-risk (VaR) constraint, can increase the supply of lending as local currency appreciation strengthens balance sheets. See also Bruno and Shin (2015a,b).
5 In general, in addition to the trade-weighted exchange rate, the trade channel is also likely to be particularly sensitive to the exchange rate against currencies used in trade invoicing. However, incomplete data on the currency of invoicing prevent us from exploring this question.
6 While the trade channel is typically quantified through the real effective exchange rate (REER), we use the NEER to make the comparison with the debt-weighted exchange rate (which is a nominal measure) more meaningful. That said, the REER and NEER are highly correlated, with the correlation of quarterly changes in the two variables averaging 0.8 for our sample of countries.
7 The financial crisis dummy is included to acknowledge the unusual response of trade to changes in demand during the crisis - what has been dubbed the "Great trade collapse". See Leigh et al (2015) for a similar approach.
8 Four-quarter changes are used for all variables except for the two exchange rate variables, instead of multiple lags, in order to preserve degrees of freedom.
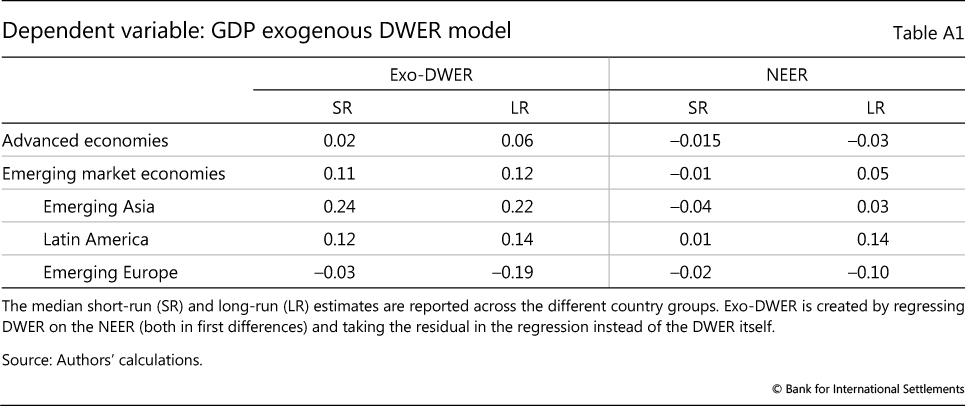
9 This model includes both exchange rates simultaneously in the regression. As a robustness check (Appendix Table A1), we first regress changes in the DWER on the NEEER and include the residuals (ie the component of DWER that is orthogonal to NEER) in the second stage regression instead of the DWER itself. The results are similar.
10 While the short-run elasticity measures the contemporaneous impact of a one-time change in the exchange rate variable in the immediate aftermath of the change, the long-run elasticity measures the contemporaneous impact in a new equilibrium characterised by a persistent change in the exchange rate. Mathematically, the short-run elasticity of DWER is given by ζ0, and the long-run elasticity is given by 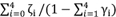 . The corresponding short-run and long-run elasticities for NEER are given by δ0 and
 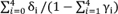 , respectively.
11 Although estimates in Table 1 do not provide evidence even in favour of the trade channel for European EMEs, this result is not robust to changes in the specification. In particular, if we include the NEER and the component of DWER that is uncorrelated with (orthogonal to) NEER, then the trade channel clearly shows up, as is evident in Appendix Table A1.
12 This pattern is not observed for advanced economies, for which the elasticities are themselves negligibly small. Note that lack of sufficient variation in the level of foreign currency debt-to-GDP ratios within countries across the sample period prevents us from uncovering this relationship explicitly in the regressions by employing interaction terms. However, with sufficient cross-sectional variation, the scatter plot indicates that there is a strong relationship.
13 This is based on excluding Saudi Arabia which is a notable outlier. Including Saudi Arabia, the correlation based on the dollar is essentially zero.
14 While replacing the NEER with trade prices improves the identification of the trade channel for imports, the same is not true when export prices are used in the exports regression. Unlike in the case of imports, the competitiveness of exports is not captured by export prices in local currency (or any other individual currency). Instead, their competitiveness is best captured by export prices in a synthetic export-weighted currency, which is closely related to the NEER itself. Hence we make the switch from the NEER to trade prices only when the dependent variable is imports.
15 See Jasova et al (2016) for evidence of change in the pass-through of exchange rates to inflation over time in EMEs.