Highlights of global financing flows
The BIS, in cooperation with central banks and monetary authorities worldwide, compiles and disseminates data on activity in international financial markets. This chapter summarises the latest data from the BIS international banking statistics and global liquidity indicators, available up to September 2014. A box looks at the background and interpretation of the global liquidity indicators.1
Takeaways
- Aggregate international banking activity expanded further during the third quarter of 2014, after a turning point in the first. International debt securities issuance continued to grow at a healthy pace, supported by very low (and in some cases negative) sovereign yields.
- At end-September 2014, credit in US dollars to non-bank borrowers outside the United States totalled $9.2 trillion, an increase of 9% over a year earlier. This represents an increase of over 50% since end-2009. The total comprised $4.2 trillion of debt securities and $4.9 trillion of bank loans.
- Bank lending in the euro area increased, but with divergences among countries that did not conform to the traditional core-periphery pattern.
- Cross-border lending to Asian emerging market economies (EMEs) continued to grow rapidly. While claims of BIS-reporting banks on China were 40% higher than a year earlier, they showed signs of peaking, rising by only 3% on a quarterly basis in the third quarter of 2014. The reporting banks' claims on Chinese banks fell in the third quarter.
- The current strength of cross-border capital flows to some EMEs, particularly in East Asia, could further boost domestic credit booms in these countries. In other EME countries and regions, cross-border lending continues to lag domestic credit growth.
- Credit to Russian borrowers fell especially sharply in the third quarter of 2014, contributing to a year-on-year decline of 15%.
- As in previous business cycle recoveries, the last several years have seen an increase in equity issuance. At the same time, at least in the US, share repurchases have exceeded new issuance. A box explores these trends.
- This section also includes a box on the background and interpretation of the BIS global liquidity indicators.
International credit flows and the multi-speed economy
In the second half of 2014, global banking and capital flows continued to adjust to shifting patterns of global demand. For several years after the Global Financial Crisis, the largest advanced economies struggled with overburdened balance sheets and weak banking systems, while capital flowed to fast-growing EMEs. More recently, this has been replaced by a "multi-speed" global economy featuring stronger growth in some advanced economies, notably the United States and United Kingdom; a disappointing outlook in the euro area and Japan; and a slowdown in some, but not all, of the emerging markets.
As banking systems have recovered, and risk appetite has stayed strong, international bank lending has started to revive amongst the advanced economies, though it remains well below pre-crisis levels. At the same time, international lending has continued to grow at a brisk pace in EMEs, particularly in Asia. Bank lending has thus resumed its role as a key vehicle for global liquidity.
The revival of international bank lending has occurred alongside persistently high levels of global bond market issuance (which some have described as a "second phase of global liquidity").2 In this environment, some economies continue to experience rapid credit growth that is characteristic of the late stage of financial cycles, and in some cases international credit flows have helped to amplify these financial booms.
These highlights review developments in international financing flows, focusing on the banking and securities data compiled by the BIS. Developments are presented against the backdrop of the broader evolution of global liquidity and credit aggregates. Most of the data are available through the third quarter of 2014, though some data sources and market price developments can give us insights as to likely developments in the fourth quarter of 2014 and the start of 2015. The discussion makes use of the global liquidity indicators developed at the BIS and formerly published as a separate statistical release on the BIS website. Box 1 offers further detail on the background and interpretation of these indicators.
Global credit flows remain strong as bank lending revives
Global credit flows, comprising international bank lending and issuance of international debt securities, remained strong in the third quarter of 2014, though still below pre-crisis levels (Graph 1).
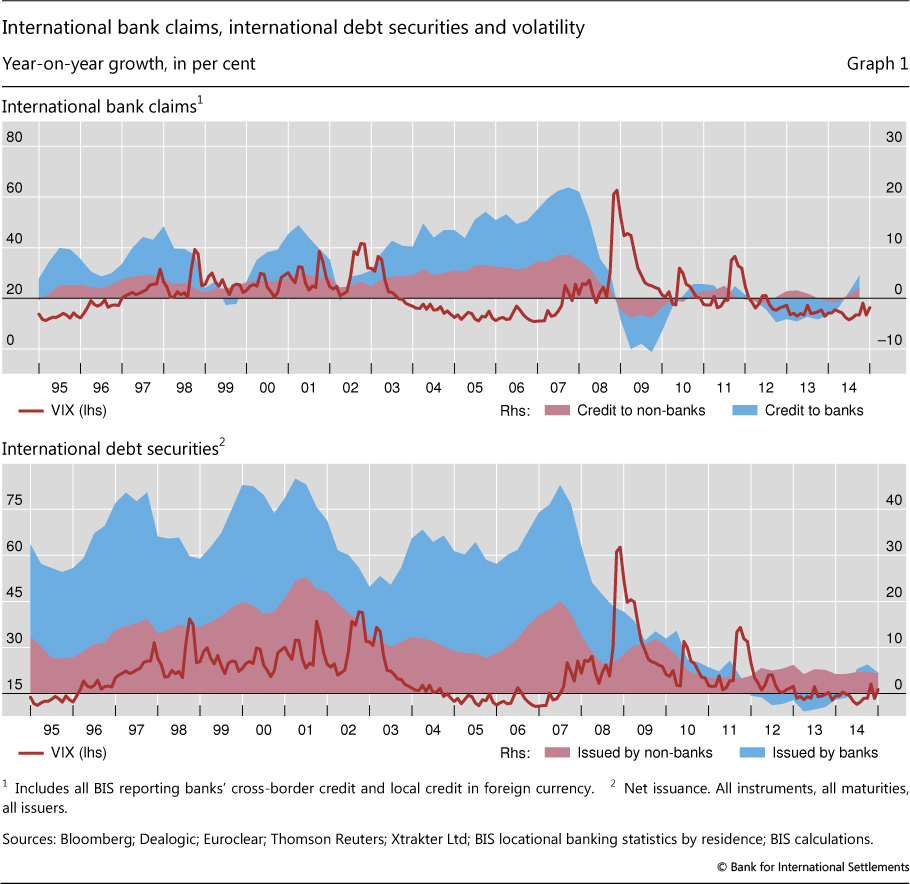
The historical pattern whereby international bank claims tend to rise in aggregate when market volatility is low or falling appears to have reasserted itself in the course of 2014 (Graph 1, top panel). The full impact of the increase in market volatility back towards historical averages at the end of 2014 and the early months of 2015 will only become apparent when banking data for those time periods become available.3 Preliminary data from the syndicated lending market, however, suggest that international bank credit remained strong during the fourth quarter.
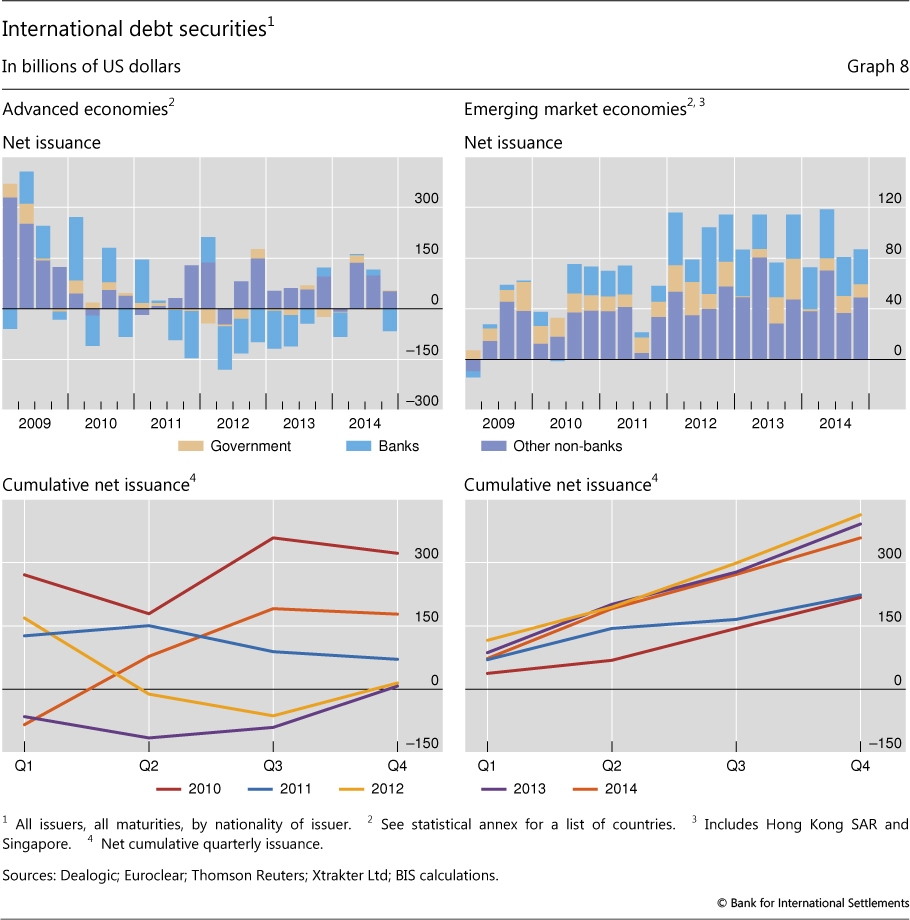
In parallel with the recovery in bank lending, debt securities continued to be an important channel for global credit flows (Graph 1, bottom panel). Net of repayments, cumulative international debt securities issuance in 2014 was $178 billion for advanced economies and $359 billion for emerging markets (Graph 8, bottom panels).4
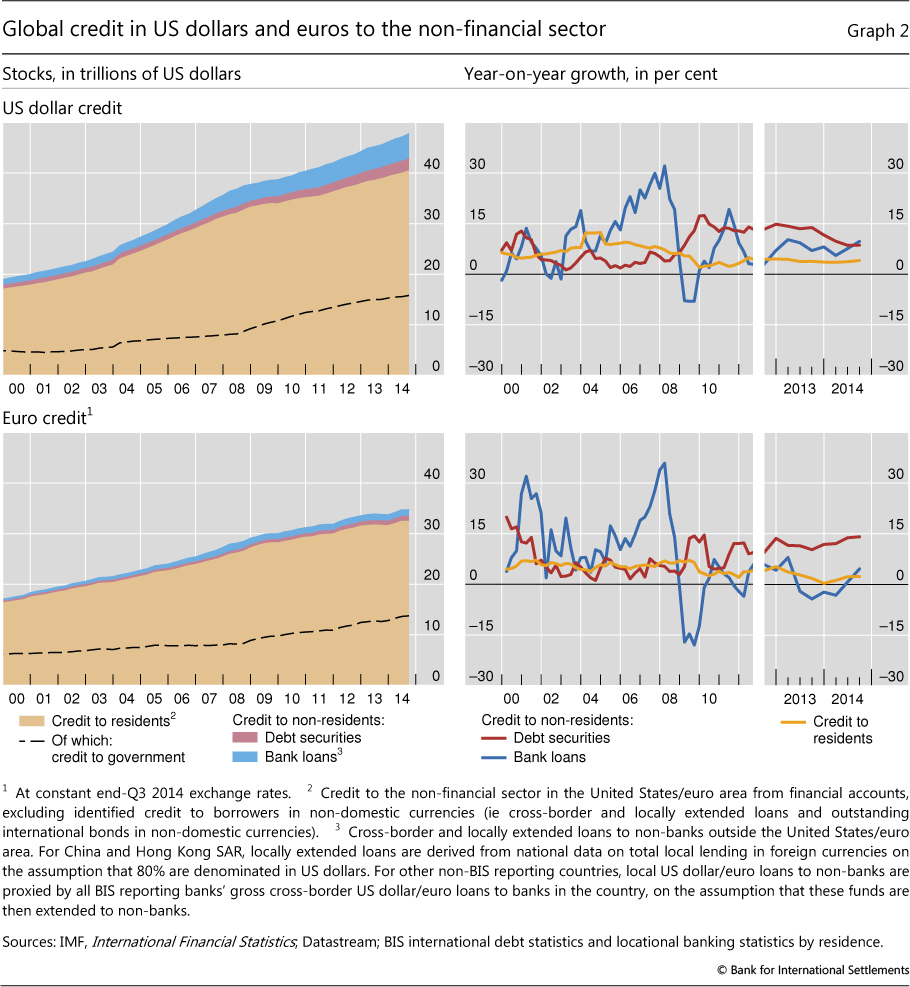
Turning to credit aggregates more broadly, the growth of credit (through banks and securities markets, but excluding interbank flows) to non-residents in US dollars and euros respectively continued to outpace that to residents of the corresponding currency areas (Graph 2, right-hand panels). For the first time since 2011, US dollar bank lending to the non-financial sector outside the United States grew faster than credit to non-residents through international debt security issuance, pointing to the ongoing revival of activity on the part of globally active banks.
At end-September 2014, credit in US dollars to non-financial borrowers outside the United States totalled $7.3 trillion, an increase of 9% over a year earlier (Graph 2, top panels). Bank loans in dollars to non-US non-financial borrowers rose 9.7% in the year to September 2014 to $4.9 trillion, while securities issued by these borrowers rose 8.6% to $2.4 trillion. When non-bank financial borrowers are added, the total comes to $9.2 trillion.5 The latter figure may give a better picture of non-resident US dollar credit, since many of these non-bank financial entities provide dollar funding directly to non-financial corporations.
Credit in euros to non-financial borrowers outside the euro area totalled $2.3 trillion, an increase of 8.5% on a year earlier (Graph 2, bottom panels). Bank lending in euros to non-banks outside the euro area increased by 5% year on year, to €1.3 trillion. This was the second straight quarter of growth in euro-denominated bank lending to non-resident non-banks, after four quarters when such lending declined.
In parallel with the growth in domestic and cross-border credit, equity issuance has gained strength in advanced economies in recent years, though, at least in the US, this has been balanced by an increase in share buybacks (see Box 2).
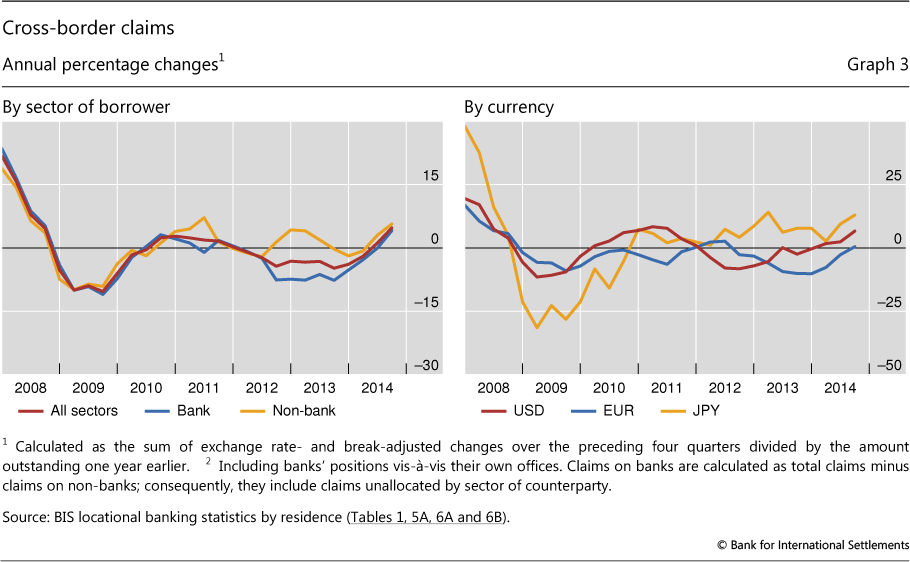
Returning to aggregate banking flows, international banking activity (including the interbank market) began to grow in the first quarter of 2014, and continued to expand in the second and third (Graph 3, left-hand panel).6 Global cross-border bank claims on all sectors increased by $494 billion between end-June and end-September 2014, after adjusting for breaks in series and exchange rate movements. As a result, the year-on-year growth rate rose to 5% at end-September 2014 from 1% at end-June 2014. Lending to non-banks increased slightly faster, at 6%, than lending to banks, which rose 4% (Graph 3, left-hand panel).
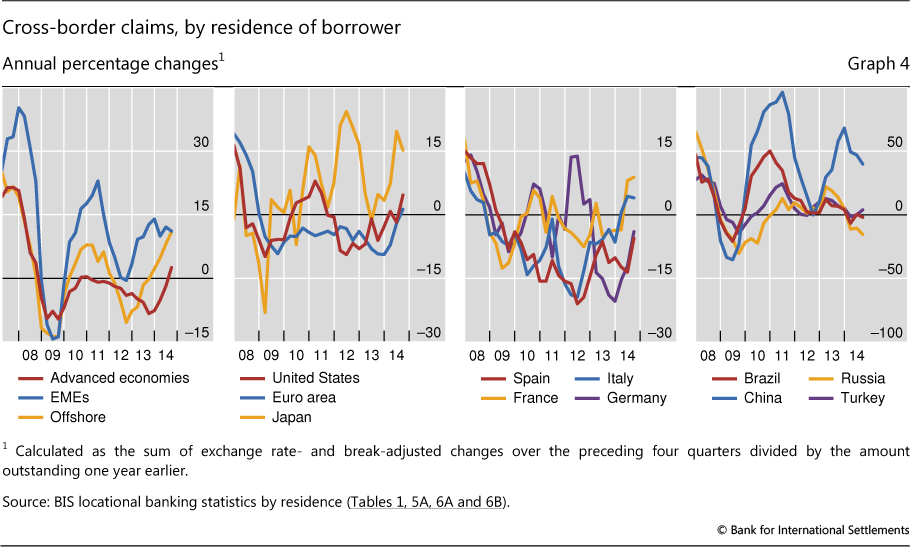
Cross-border lending to all borrowers (banks and non-banks) in advanced economies grew 3%, while cross-border lending to EMEs expanded at an annual rate of 11% in the year to September 2014 (Graph 4, first panel). Since advanced economies continue to account for the bulk of the total, the recent growth of global cross-border claims is still well below the pre-crisis pace. Cross-border lending to advanced economies increased 22% (in exchange rate-adjusted terms) in the year to September 2007, while lending to EMEs grew 33%. The outstanding amount of cross-border claims on advanced economies, at $21.1 trillion in September 2014, is still below the $28.4 trillion level reached in the first quarter of 2008. Claims on emerging markets, by contrast, are now substantially above pre-crisis levels. Such claims stood at $3.9 trillion in September 2014, compared with $2.7 trillion in the first quarter of 2008.
In line with the developments in total US dollar credit to the non-bank, non-resident sector discussed above, the annual growth rate of aggregate cross-border bank lending in US dollars jumped from 2% for the year through June 2014 to almost 7% for the year through September 2014 (Graph 3, right-hand panel). Claims denominated in yen expanded even faster, reaching almost 13% year on year through the third quarter, up from 9% in the second. In contrast, euro-denominated claims were essentially flat. This represents an increase in relative terms, however, in that euro-denominated claims stopped contracting on an annual basis in September 2014 for the first time since 2012.
Banking flows to Asia continue as other regions lag
Within this broad global picture, credit flow developments varied across countries and regions. Lending to Japan and other Asian countries remained strong, and flows to advanced economies, including some euro area countries, showed signs of a revival, while flows to EMEs outside Asia were generally weak.
Among the advanced economies, the revival of cross-border bank lending to Japan stands out (Graph 4, second panel). Claims on residents of Japan continued to expand at a very fast pace (15% year on year), primarily fuelled by a sharp increase in the growth rate of lending to non-banks (from 20% at end-June 2014 to 31% at end-September 2014).
Cross-border lending to residents of the United States grew 5% year on year through September 2014, led by a 7% increase in claims on US banks.
Cross-border claims on the euro area also grew on an annual basis, albeit at a much slower pace. The 1% annual increase in the year to end-September 2014 was the first since the last quarter of 2008, pointing to the gradual revival of cross-border financial activity in the wake of the 2011-12 sovereign debt crisis. Within the euro area, the aggregate increase masks large divergences between individual countries. On the one hand, cross-border claims on France and Italy grew at annual rates of 9% and 4%, respectively (Graph 4, third panel). On the other hand, cross-border lending to Spain and Germany contracted at annual rates of almost 6% and 4%, respectively. These developments do not conform to the traditional division of the euro area into "core" and "peripheral" countries.
Box 1
Global liquidity indicators: background and interpretation
Over the past several years, BIS researchers have developed indicators intended to track global liquidity conditions. The term global liquidity is used here to mean the ease of financing in global financial markets. Defined this way, it encompasses both funding liquidity (the ease of raising cash by selling new obligations to investors) and market liquidity (the ease of raising cash by selling assets). Global liquidity thus depends on the actions of private investors, financial institutions and monetary authorities. It is essentially an unobservable property of the financial system - we can gauge it by analysing different price and quantity indicators, but no single indicator on its own will give a full picture. The information content of these indicators changes over time, implying that a flexible approach is needed when assessing global liquidity conditions.
Financial institutions provide market liquidity to securities markets through their trading activities, and provide funding liquidity to borrowers through their lending activities. The terms on which these intermediaries can fund themselves, in turn, depend on the willingness of other market participants to interact with them. Macroeconomic and prudential policies are another factor, including the terms and conditions on which central banks provide funding.
The interaction between these private and official factors determines the economy's overall ease of financing. This, in turn, influences the build-up of financial system vulnerabilities in the form of asset price inflation, leverage, or maturity or funding mismatches. Indicators tend to measure these "footprints" of liquidity rather than liquidity itself, which is unobservable.
On this basis, and seen from a financial stability perspective, global credit is among the key indicators of global liquidity. The stock of credit outstanding shows how far ease of financing has led to the build-up of exposures. In other words, global private sector credit reflects the outcome of financial intermediation activity in global markets. Changes in these stocks are closely associated with the build-up of vulnerabilities, with potential implications for financial stability. These flows comprise both a domestic and an international element.
Of particular interest for assessing global liquidity is the international component of credit (cross-border lending to non-residents or lending in foreign currency). This cross-border element has often provided the marginal source of financing in credit booms. Although often small relative to the total stock of credit, swings in these international components can amplify domestic trends and are highly correlated with booms and busts in global financial conditions. Global liquidity is thus linked to - but distinct from - domestic liquidity conditions and the financial cycle in a given country or region.
Any assessment of global liquidity conditions requires that measures of global credit be put into perspective. Much of this credit, although not all, is provided by banks, so that the indicators focus on this component. More, however, is also being provided by other investors in debt securities, as the asset management industry has grown. A range of supplementary price and quantity indicators can be used to capture additional aspects of global liquidity that are relevant for financial stability. These include measures of financing conditions in key financial markets and incentives for position-taking across market segments. Key indicators in this regard are proxies for risk perceptions and tolerance (such as the VIX), which are a major driver of leverage and the willingness of private investors to provide funding. One would also be interested in the terms and conditions at which finance is granted, as well as the consequences of these terms for credit volumes and prices.
These concepts have been developed and elaborated in a series of BIS research papers, committee reports and speeches. Some of the most useful ones are the following:
·Borio, C (2010): "Ten propositions about liquidity crises", CESifo Economic Studies, vol 56, no 1, pp 70-95. Also available as BIS Working Papers, no 293, November 2009.
·Borio, C, R McCauley and P McGuire (2011): "Global credit and domestic credit booms", BIS Quarterly Review, September, pp 43-57.
·Bruno, V and H S Shin (2014): "Cross-border banking and global liquidity", BIS Working Papers, no 458, September.
·Caruana, J (2012): "Assessing global liquidity from a financial stability perspective", speech at the 48th SEACEN Governors' Conference and High-Level Seminar, Ulaanbaatar, November.
·--- (2013): "Global liquidity: where do we stand?", speech at the Bank of Korea Annual Conference, Seoul, June.
·--- (2013): "Ebbing global liquidity and monetary policy interactions", speech at the Central Bank of Chile Fifth Summit Meeting of Central Banks, Santiago, November.
·--- (2014): "Global liquidity: where it stands, and why it matters", IMFS Distinguished Lecture at Goethe University, Frankfurt, Germany, March.
·Committee on the Global Financial System (2011): "Global liquidity - concepts, measurement and policy implications", CGFS Papers, no 45, December.
·Domanski, D, I Fender and P McGuire (2011): "Assessing global liquidity", BIS Quarterly Review, December, pp 57-71.
·Eickmeier, S, L Gambacorta and B Hofmann (2013): "Understanding global liquidity", BIS Working Papers, no 402, February.
·Shin, H S (2013): "The second phase of global liquidity and its impact on emerging economies", proceedings of the Federal Reserve Bank of San Francisco Asia Economic Policy Conference, November, pp 1-10.
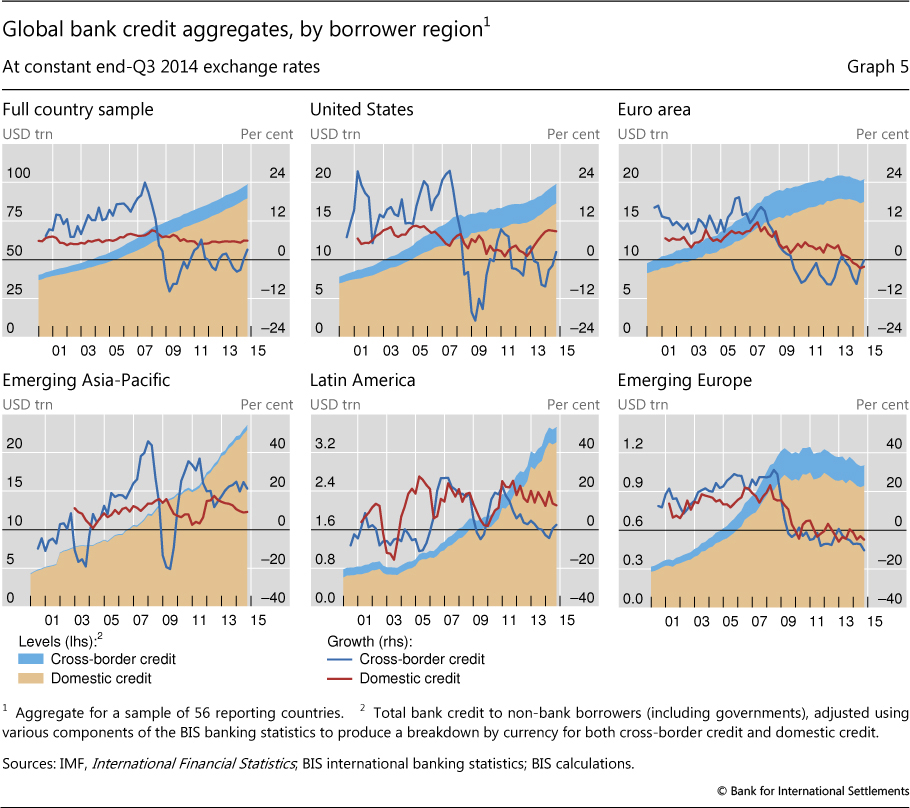
These patterns in aggregate cross-border banking flows were reflected in the provision of credit to the non-bank sector across regions (Graph 5). In most regions, domestic bank credit to non-banks continues to grow faster than cross-border lending to these borrowers, with the current stock of domestic credit far exceeding the stock of cross-border credit. In the case of the US, cross-border lending to non-banks rose 2% year on year, compared with a 9% increase in domestic credit (Graph 5, top centre panel). For Latin America, cross-border bank credit grew 3%, and domestic credit by 13% (bottom centre panel). In the euro area as well as emerging Europe, domestic and cross-border lending to non-banks were either stagnant or declining (Graph 5, right-hand panels).
At the same time, cross- border credit to the emerging Asia-Pacific region maintained a strong pace (Graph 5, bottom left-hand panel). Cross-border bank credit to non-banks in that region rose by no less than 21% year on year, while domestic credit grew 9%. Most of the former increase was driven by China (see below). However, the share of cross-border credit in Asia relative to domestic lending is by far the lowest across all regions.
Within this broad picture, patterns vary in important ways for individual countries. This can be seen by examining two distinct, but related, sets of data: cross-border lending to all residents, including banks and non-banks (as shown in Graph 4), and bank credit, domestic and cross-border, to non-banks (as shown in Graph 6).
The growth of cross-border bank credit to the non-banking sector in China was relatively rapid in the year to September 2014 (Graph 6, first row). China's international borrowing is large in an absolute sense: China ranks seventh in terms of total cross-border claims (to banks and non-banks) in the BIS locational banking statistics. However, cross-border credit is still quite small relative to Chinese domestic credit, and shows signs of having peaked in the second quarter of 2014. While total cross-border claims on Chinese borrowers (to banks and non-banks) in the BIS locational banking statistics rose by almost 40% between end-September 2013 and end-September 2014 (Graph 4, fourth panel), these claims increased by only 3% in the third quarter of 2014 compared with the second. Claims on China as tracked by the BIS consolidated banking statistics actually decreased in the third quarter (foreign claims, ultimate risk basis).7 This was driven by a lower increase in claims on Chinese banks, suggesting that efforts by authorities to tighten credit conditions in the banking sector have started to have an impact.
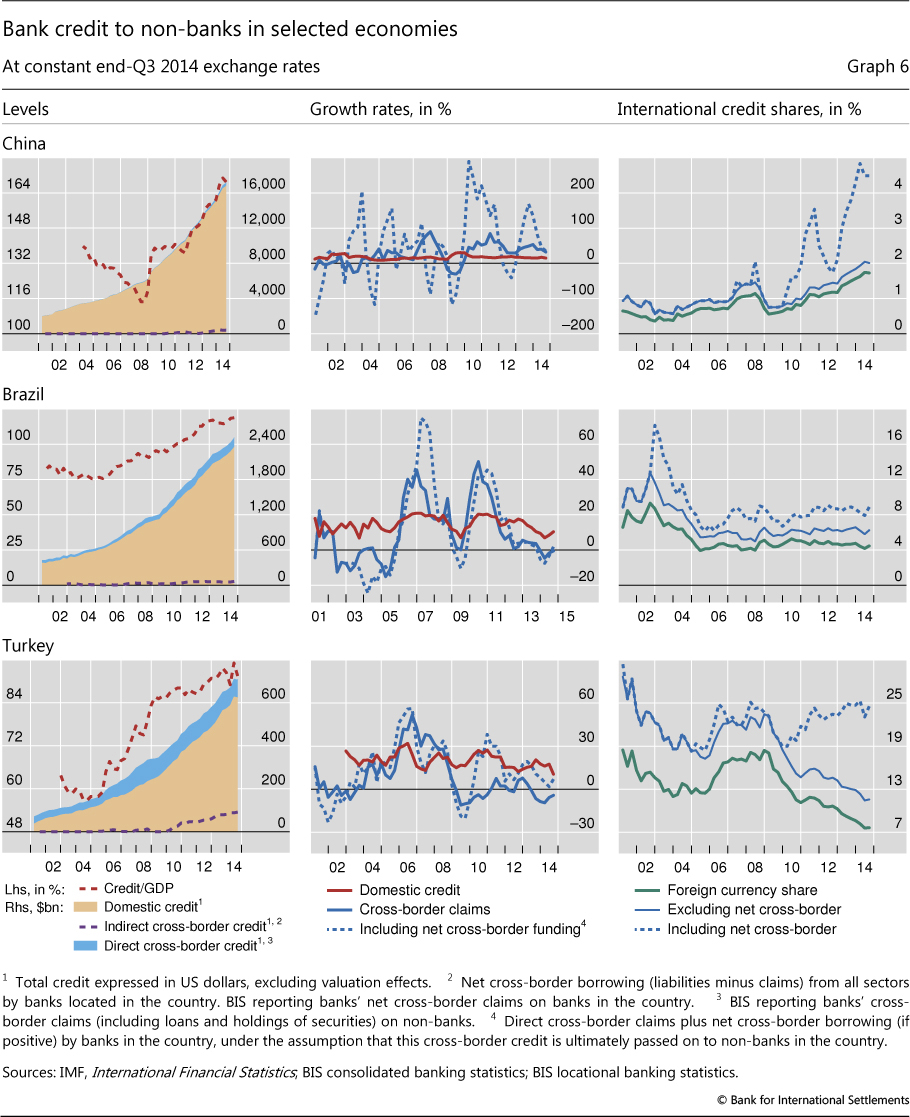
Cross-border claims on Brazil declined by almost 2% in the year to end-September 2014 (Graph 4, fourth panel). Cross-border credit to non-banks in Brazil has moderated over the past three years, reinforcing a gradual slowdown in the previously rapid rate of domestic credit growth (Graph 6, middle row of panels).
In Turkey the overall growth of cross-border claims remains low (Graph 4, fourth panel). This primarily reflects low growth in direct cross-border credit to non-banks. However, there has been a somewhat more rapid expansion of "indirect" funding of the non-bank sector, which includes cross-border lending to domestic banks (Graph 6, bottom row of panels).
Credit to Russian borrowers (banks and non-banks) fell sharply in the third quarter of 2014 in the face of falling oil prices and economic sanctions. Claims on residents of Russia contracted by $11 billion between end-June and end-September 2014, contributing to a cumulative year- on-year decline of 15% (Graph 4, fourth panel). In addition to cross-border claims, internationally active banks also had claims on Russia that were booked by their local affiliates. The consolidated banking statistics reveal that, as of end-September 2014, BIS reporting banks' locally booked claims on residents of Russia totalled $81 billion. French, Italian, US and Austrian banks accounted for the bulk of outstanding claims at end-September 2014 (Graph 7). French banks had the largest outstanding foreign claims on Russia at $44 billion, followed by Italian and US banks at $27 billion and $25 billion, respectively.
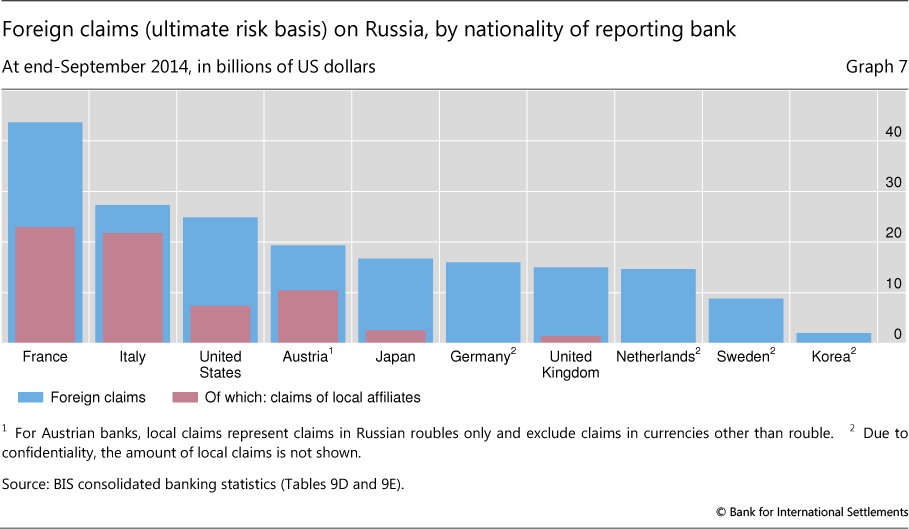
The bulk of these local claims were denominated in roubles. In turn, those rouble-denominated local claims were mostly financed by rouble-denominated liabilities to Russian residents. Summing cross-border and local affiliate claims, at end-September 2014 BIS reporting banks had foreign claims on Russia totalling $196 billion on an ultimate risk basis (ie after adjusting for credit risk mitigants such as guarantees and collateral).8 French banks' foreign claims were roughly evenly split between cross-border claims and claims booked by their local Russian affiliates. At the same time, local claims accounted for the majority of Italian banks' foreign claims. Conversely, US banks' foreign claims mostly took the form of cross-border exposures.
Low term premia support debt issuance
Long-term debt securities issuance was supported by the rapid decline in sovereign yields, especially towards the end of 2014.9 For advanced economies, net international debt issuance in 2014 approached the rapid pace experienced in the immediate aftermath of the global financial crisis (Graph 8, bottom left-hand panel). The pace of new issuance in EMEs in 2014 closely tracked previous years (bottom right-hand panel).
As has been the case for the last few years, the strength of the US dollar encouraged dollar-denominated issuance.10 International debt issues denominated in US dollars, net of repayments, totalled $106 billion in the fourth quarter of 2014, while net issuance denominated in euros was only $9.8 billion. For the year as a whole, dollar-denominated net issuance was $650 billion, compared with $5 billion in net repayments of euro-denominated securities.
Non-bank corporations accounted for the bulk of net borrowing on the international debt securities markets in the advanced economies (Graph 8, top left-hand panel). In contrast, banks, non-banks and governments all made use of this channel in EMEs (Graph 8, top right-hand panel). Oil and gas firms have accounted for a significant share of international debt securities by emerging market borrowers in recent years.11
Shifting patterns of financing flows put pressure on borrowers
Changing patterns in global banking and capital flows can have implications for financial stability risks. Early warning indicators can help identify the build-up of such risks, by focusing on unusually strong financial booms and aggregate vulnerabilities to interest rate increases. That said, such indicators are inevitably subject to a considerable margin of error and should be interpreted with great caution. Those that have been found useful in the past include the increase in the ratio of credit to GDP and the growth of property prices as well as the debt service ratio (principal and interest payments as a share of income), all measured relative to long-term trends.12 For a number of countries, these indicators point to the possible build-up of risks (Table 1).13
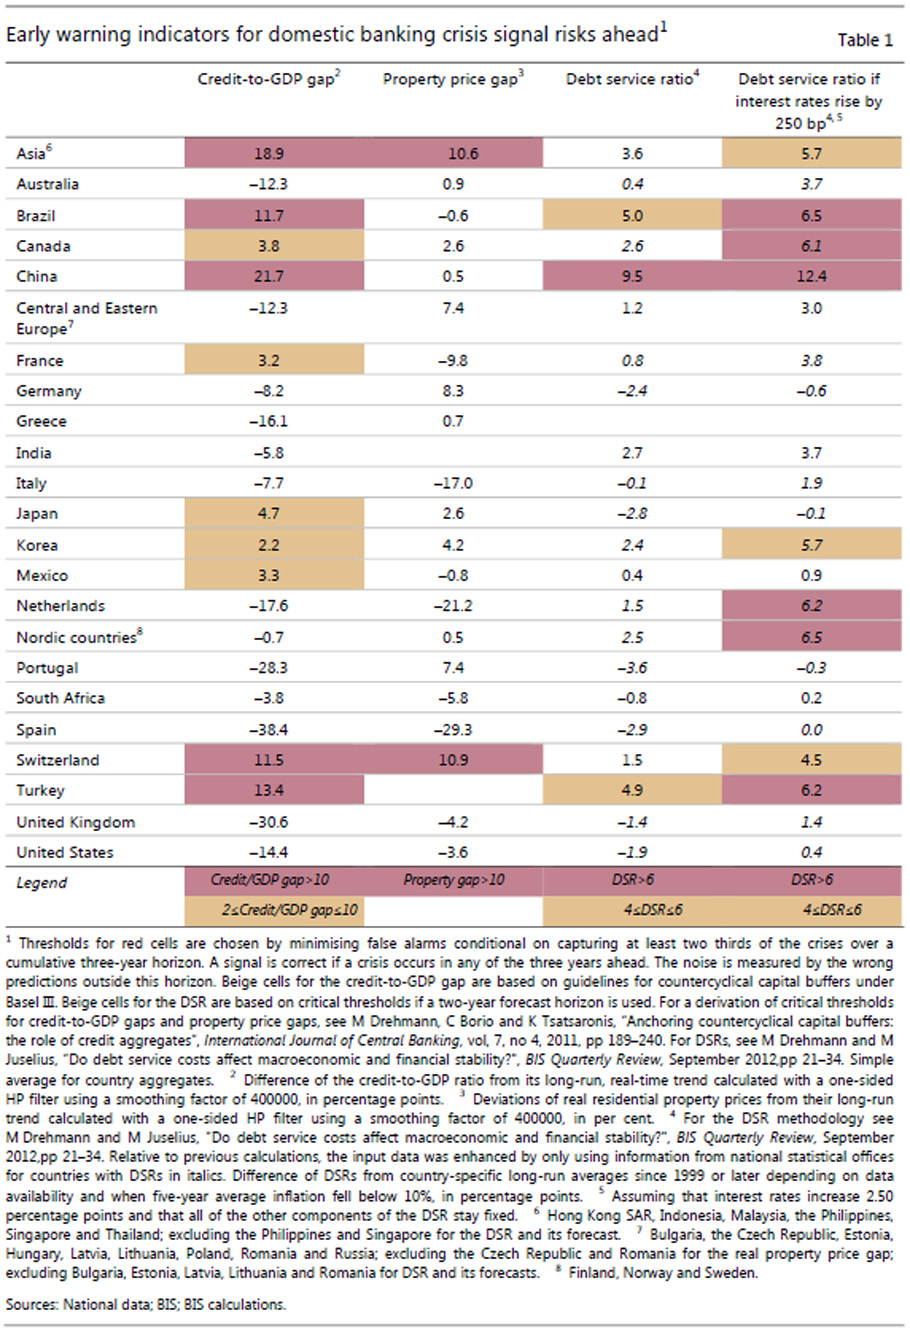
Typically, cross-border financing boosts the upswing of domestic financial cycles, and, through an eventual reversal, accentuates the subsequent bust.14 As such, the current strength of cross-border capital flows to China and other East Asian economies could help to reinforce the cyclical booms in those countries, although, as noted above, at least for China the trend may now be reversing. A number of countries may also be vulnerable to an increase in global bond yields, such as may happen if major central banks start to move towards an exit from their currently accommodative monetary policy stance. This is measured in the last column of Table 1, which estimates the long-run increase in debt service ratios (principal and interest payments as a share of income) that may result from a 250 basis point rise in the cost of outstanding debt, under the assumption that other components of the debt service ratio stay fixed.
Box 2
Equity issuance and share buybacks
Adrian van Rixtel and Alan Villegas
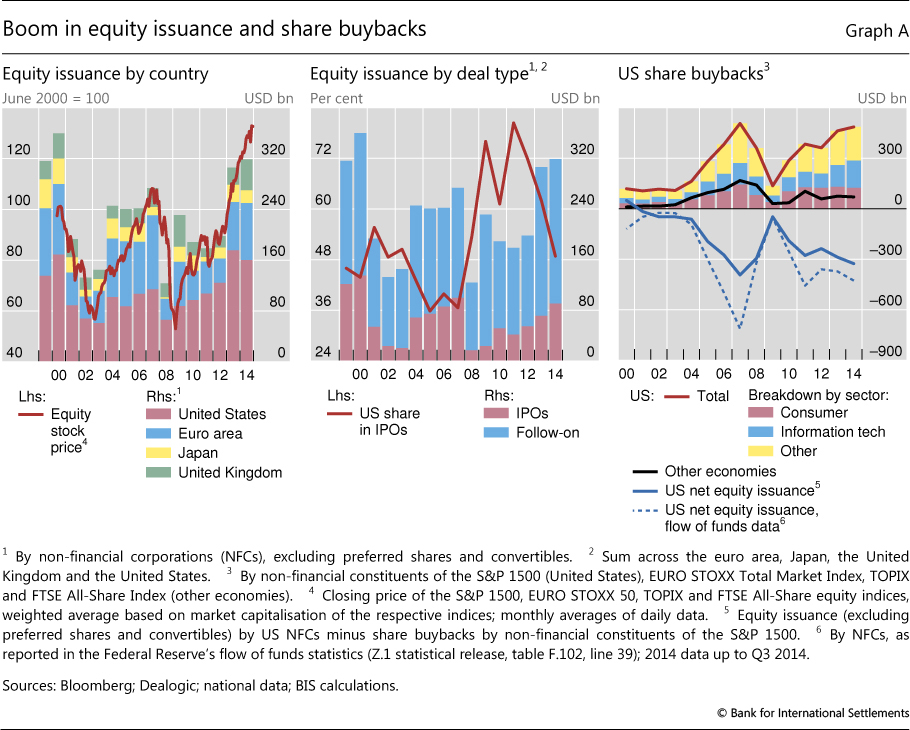
Non-financial corporations have been issuing large amounts of equity in gross terms in recent years. Against the backdrop of rising stock prices, those from the four largest advanced economies - the euro area, Japan, the United Kingdom and the United States - raised $625 billion in new equity during 2013-14, up 66% from the previous two years (Graph A, left-hand panel). US corporations raised more than half of the amount, while those in the euro area accounted for around one fourth. Issuance by firms that are already quoted ("follow-on" or secondary offerings) accounted for 74% of the total (Graph A, centre panel), and that of initial public offerings (IPOs) was 26%, around the same as in the previous two years. US non-financial corporations remained IPO leaders, but their share declined rather sharply, from around 70% at end-2012 to just below 50% at end-2014 (Graph A, centre panel, red line). UK firms, in particular, gained prominence.
Even as US non-financial corporations issued equity en masse, the amount raised on a net basis actually fell, as share buybacks exceeded issuance. Indeed, after a steep rise, in 2014 share buybacks approached their pre-crisis peak (Graph A, right-hand panel, red line). Such share repurchases totalled almost $950 billion in 2013-14. As a result, the corresponding share capital fell by at least $610 billion on net (Graph A, right-hand panel, blue line). And this figure is an underestimate, as it compares total equity raised by the aggregate US non-financial corporate sector as covered by Dealogic with share buybacks for the non-financial companies included in the S&P 1500 index only. The official US flow of funds statistics, which cover all non-financial corporations in the US and are methodologically more broadly based, show a larger decline in net new equity raised for 2013-14 (Graph A, right-hand panel, blue dashed line).
Since the mid-1980s, corporations have increasingly turned to share buybacks rather than dividends as a way to return cash to shareholders. The initial motivations were tax advantages and protection against the risk of hostile takeovers, although managements also used buybacks to signal the undervaluation of a firm.
 More recently, they have been associated more with management compensation policies, the reduction of free cash flows and outright share price support. Share repurchases have now overtaken aggregate dividends as the main form of corporate payout in the United States. The active use of share repurchases started much later in Europe. Despite their more rapid growth over the past decade, the value of European firms' share buybacks is still only a fraction of that of their US counterparts. And the total amount of buybacks by non-financial corporations included in broad stock price indices for the euro area, UK and Japan was $145 billion in 2013-14 (Graph A, right-hand panel, black line) - almost seven times smaller than that by US firms. Large IT firms (including Apple, IBM, Cisco, Oracle and Microsoft) accounted for around 30% of all share repurchases in the United States (Graph A, right-hand panel).
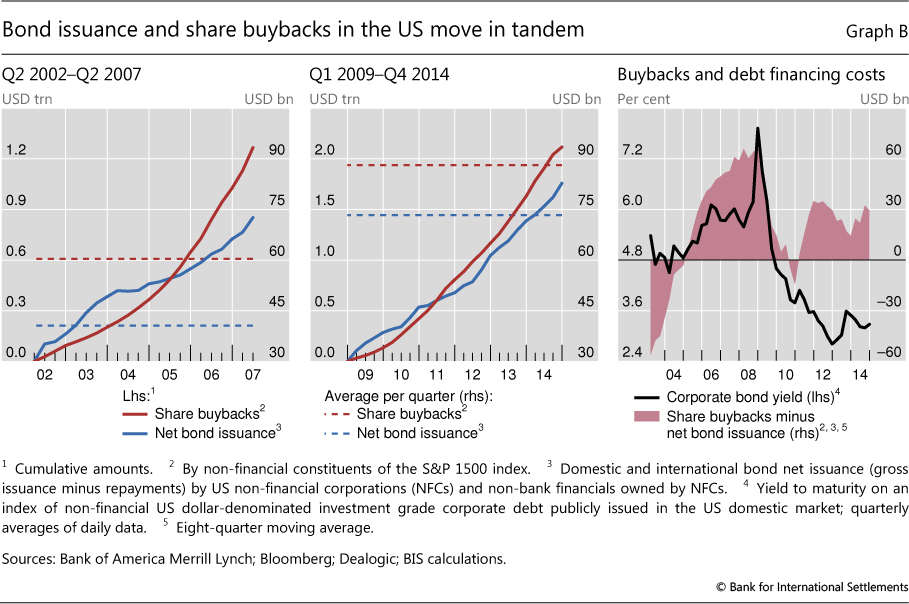
Share buyback booms in the United States have typically coincided with surges in net bond issuance, suggesting that the former have been financed, at least in part, through the latter. During the past 15 years, there have been two periods of rapidly growing share repurchases: Q2 2002-Q2 2007 and Q1 2009-Q4 2014 (Graph B, left-hand and centre panels). The net amount of bonds issued during these episodes moved in tandem with that of total buybacks (blue and red lines) and was supported by low or declining interest rates (Graph B, right-hand panel). All in all, Graph B suggests that when debt financing costs are favourable and equity markets are rallying, US non-financial corporations issue bonds heavily and use some of the proceeds to finance stock repurchases. During 2009-14, the average quarterly amount of net bond issuance was almost twice that during the previous boom (Graph B, left-hand and centre panels, dashed blue lines). US non-financial corporations repurchased $2.1 trillion in shares and raised $1.8 trillion in net bond financing in this period, compared to $1.3 trillion and $850 billion, respectively, during 2002-07.
Our calculations of net issuance do not include the effects of the exercise of stock options (positive net issuance) and debt or cash-funded mergers and acquisitions (negative net issuance). The latter probably accounts for why the US flow of funds data show a larger decline in net equity issuance. See ECB, "Share buybacks in the euro area", Monthly Bulletin, May 2007, pp 103-11; and D Skinner, "The evolving relation between earnings, dividends, and stock repurchases", Journal of Financial Economics, vol 87, 2008, pp 582-609. On the "signalling" hypothesis, see T Vermaelen, "Common stock repurchases and market signalling", Journal of Finance, vol 53, 1981, pp 139-83.
1 This article was prepared by Benjamin Cohen (ben.cohen@bis.org) and Cathérine Koch (catherine.koch@bis.org). Statistical support was provided by Pablo García-Luna, Sebastian Goerlich, Branimir Gruić, Jeff Slee and Jhuvesh Sobrun.
2 See H S Shin, "The second phase of global liquidity and its impact on emerging economies", proceedings of the Federal Reserve Bank of San Francisco Asia Economic Policy Conference, November 2013, pp 1-10.
3 See BIS, "A wave of further easing", BIS Quarterly Review, March 2015, pp 1-12.
4 The financial flows represented by the securities issuance figures in the bottom panel of Graph 1 are not strictly comparable to the bank claims in the top panel. In particular, the bank claims are based on balance of payments concepts, while the securities issuance data are not. For example, a portion of "international debt securities" (essentially defined as securities issued by non-residents) are bought by domestic residents (this would not be recorded as cross-border investment), while domestic securities (securities not classified here as international) are often bought by non-residents.
5 See R McCauley, P McGuire and V Sushko, "Global dollar credit: links to US monetary policy and leverage", BIS Working Papers, no 483, January 2015.
6 The locational banking statistics are structured according to the residence of banking offices and capture the activity of all internationally active banking offices located in the reporting country regardless of the nationality of the parent bank. Banks record their positions on an unconsolidated basis, including those vis-à-vis their own offices in other countries. The depreciation of the euro and other major currencies against the US dollar between end-June and end-September 2014 resulted in a decline in the reported US dollar value of the outstanding stock of claims denominated in currencies other than US dollars. The growth rates reported here, however, are adjusted for exchange rate effects.
7 The consolidated banking statistics are structured according to the nationality of reporting banks and are reported on a worldwide consolidated basis, ie excluding positions between affiliates of the same banking group. Banks consolidate their inter-office positions and report only their claims on unrelated borrowers. For the consolidated banking statistics, a currency breakdown is not reported and thus, unlike for the locational banking statistics, exchange rate-adjusted changes cannot be calculated.
8 Cross-border claims in the locational banking statistics differ from those in the consolidated banking statistics mainly due to different reporting populations and the treatment of inter-office claims, which are included in the former but not in the latter.
9 See BIS, "A wave of further easing", BIS Quarterly Review, March 2015, pp 1-12.
10 See B Cohen, "Currency choice in international bond issuance", BIS Quarterly Review, June 2005, pp 53-66.
11 For further discussion, see D Domanski, H S Shin, M Lombardi and J Kearns, "Oil and debt", BIS Quarterly Review, March 2015, pp 55-65.
12 See M Drehmann and M Juselius, "Evaluating early warning indicators of banking crises: satisfying policy requirements", BIS Working Papers, no 421, August 2013; and M Drehmann and M Juselius, "Do debt service costs affect macroeconomic and financial stability?" BIS Quarterly Review, September 2012, pp 21-34.
13 For further discussion, see BIS, 84th Annual Report, June 2014, Chapter IV.
14 See S Avdjiev, R McCauley and P McGuire, "Rapid credit growth and international credit: challenges for Asia", BIS Working Papers, no 377, April 2012.