Debt and the financial cycle: domestic and global
Abstract
Financial cycles encapsulate the self-reinforcing interactions between perceptions of value and risk, risk-taking and financing constraints, which translate into financial booms and busts. Financial cycles tend to last longer than traditional business cycles. Countries are currently at very different stages of the financial cycle. In the economies most affected by the 2007-09 financial crisis, households and firms have begun to reduce their debt relative to income, but the ratio remains high in many cases. In contrast, a number of the economies less affected by the crisis find themselves in the late stages of strong financial booms, making them vulnerable to a balance sheet recession and, in some cases, serious financial distress. At the same time, the growth of new funding sources has changed the character of risks. In this second phase of global liquidity, corporations in emerging market economies are raising much of their funding from international markets and thus are facing the risk that their funding may evaporate at the first sign of trouble. More generally, countries could at some point find themselves in a debt trap: seeking to stimulate the economy through low interest rates encourages even more debt, ultimately adding to the problem it is meant to solve.
Full text
A pure business cycle view is not enough to understand the evolution of the global economy since the financial crisis of 2007-09 (Chapters I and III). This view cannot fully account for the interaction between debt, asset prices and output that explains many advanced economies' poor growth in recent years. This chapter explores the role debt, leverage and risk-taking have played in driving economic and financial developments, in particular by assessing where different economies stand in terms of the financial cycle.
Financial cycles differ from business cycles. They encapsulate the self- reinforcing interactions between perceptions of value and risk, risk-taking and financing constraints which translate into financial booms and busts. They tend to be much longer than business cycles, and are best measured by a combination of credit aggregates and property prices. Output and financial variables can move in different directions for long periods of time, but the link tends to re-establish itself with a vengeance when financial booms turn into busts. Such episodes often coincide with banking crises, which in turn tend to go hand in hand with much deeper recessions - balance sheet recessions - than those that characterise the average business cycle.
High private sector debt levels can undermine sustainable economic growth. In many economies currently experiencing financial booms, households and firms are in a vulnerable position, which poses the risk of serious financial distress and macroeconomic strains. And in the countries hardest hit by the crisis, private debt levels are still high relative to output, making households and firms sensitive to increases in interest rates. These countries could find themselves in a debt trap: seeking to stimulate the economy through low interest rates encourages the taking-on of even more debt, ultimately adding to the problem it is meant to solve.
The growth of new funding sources has changed the character of risks. In the so-called second phase of global liquidity, corporations in emerging market economies (EMEs) have tapped international securities markets for much of their funding. In part, this has been done through their affiliates abroad, whose debt is typically off authorities' radar screens. Market finance tends to have longer maturities than bank finance, thus reducing rollover risks. But it is notoriously procyclical. It is cheap and ample when conditions are good, but can evaporate at the first sign of problems. This could also have knock-on effects on domestic financial institutions, which have relied on the domestic corporate sector for an important part of their funding. Finally, the vast majority of EME private sector external debt remains in foreign currency, thus exposing borrowers to currency risk.
This chapter begins with a short description of the main characteristics of the financial cycle, followed by a section analysing the stage of the cycle particular countries find themselves in. The third section looks at drivers of the financial cycle in recent years. The final section discusses risks and potential adjustment needs.
The financial cycle: a short introduction
While there is no consensus definition of the financial cycle, the broad concept encapsulates joint fluctuations in a wide set of financial variables including both quantities and prices. BIS research suggests that credit aggregates, as a proxy for leverage, and property prices, as a measure of available collateral, play a particularly important role in this regard. Rapid increases in credit, particularly mortgage credit, drive up property prices, which in turn increase collateral values and thus the amount of credit the private sector can obtain. It is this mutually reinforcing interaction between financing constraints and perceptions of value and risks that has historically caused the most serious macroeconomic dislocations. Other variables, such as credit spreads, risk premia and default rates, provide useful complementary information on stress, risk perceptions and risk appetite.
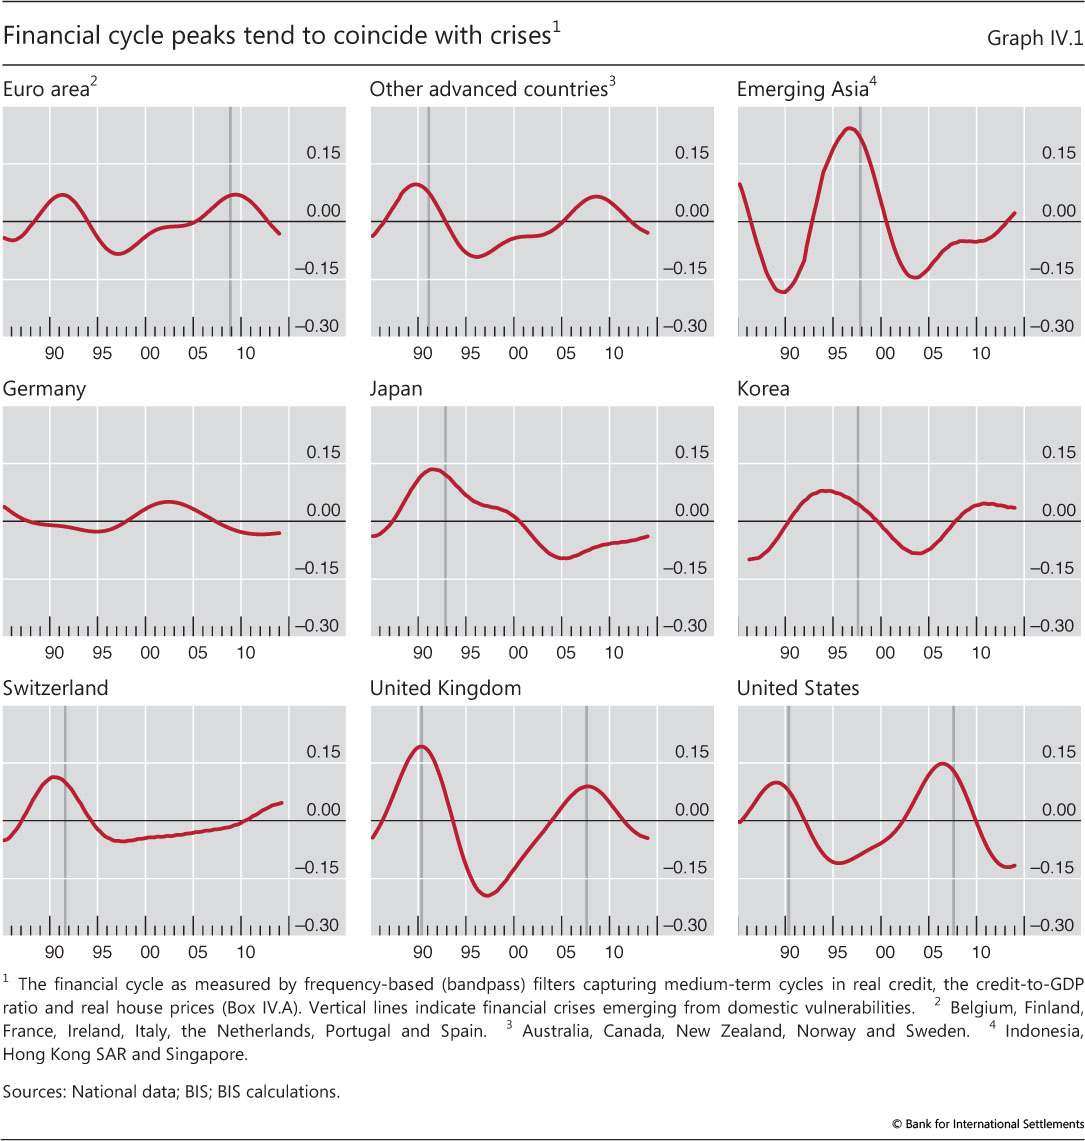
Four features characterise financial cycles empirically (Box IV.A describes how financial cycles can be measured). First, they are much longer than business cycles. As traditionally measured, business cycles tend to last from one to eight years, and financial cycles around 15 to 20 years. The difference in length means that a financial cycle can span several business cycles.
Second, peaks in the financial cycle tend to coincide with banking crises or periods of considerable financial stress. Financial booms in which surging asset prices and rapid credit growth reinforce each other tend to be driven by prolonged accommodative monetary and financial conditions, often in combination with financial innovation. Loose financing conditions, in turn, feed into the real economy, leading to excessive leverage in some sectors and overinvestment in the industries particularly in vogue, such as real estate. If a shock hits the economy, overextended households or firms often find themselves unable to service their debt. Sectoral misallocations built up during the boom further aggravate this vicious cycle (Chapter III).
Third, financial cycles are often synchronised across economies. While they do not necessarily move in lockstep globally, many drivers of the financial cycle have an important global component. For example, liquidity conditions tend to be highly correlated across markets. Mobile financial capital tends to equalise risk premia and financing conditions across currencies and borders and acts as the (price-setting) marginal source of finance. External capital thus often plays an outsize role in unsustainable credit booms, amplifying movements in credit aggregates, and may also induce overshooting in exchange rates. It does so directly when a currency is used outside national jurisdictions, as exemplified by the international role of the US dollar. Monetary conditions can also spread indirectly through resistance to exchange rate appreciation, if policymakers keep policy rates lower than suggested by domestic conditions alone and/or intervene and accumulate foreign currency reserves.
Fourth, financial cycles change with the macroeconomic environment and policy frameworks. For example, they have grown both in length and amplitude since the early 1980s, probably reflecting more liberalised financial systems, seemingly more stable macroeconomic conditions and monetary policy frameworks that have disregarded developments in credit. The significant changes in regulatory and macroeconomic policy frameworks after the financial crisis may also change the dynamics going forward.
These four features are evident in Graph IV.1, which depicts financial cycles in a large range of countries. In many advanced economies, the financial cycle as measured by aggregating medium-term movements of real credit, the credit-to-GDP ratio and real house prices peaked in the early 1990s and again around 2008 (Box IV.A). Both turning points coincided with widespread banking crises. The financial cycles in many Asian economies show a markedly different timing, peaking around the Asian financial crisis in the late 1990s. Another boom started in these economies just after the turn of the millennium and persists today, barely interrupted by the financial crisis. In some cases, for instance the banking distress in Germany and Switzerland in 2007-09, strains have developed independently from the domestic financial cycle through banks' exposures to financial cycles elsewhere.
The loose link between business and financial cycles over prolonged periods may tempt policymakers to focus on the former without paying much heed to the latter. But setting policy without regard to the financial cycle comes at a peril. It may result in financial imbalances, such as overindebted corporate or household sectors or bloated financial systems, that render certain sectors fragile to even a small deterioration in macroeconomic or financial conditions. This is what happened in Japan and the Nordic countries in the 1980s and early 1990s and in Ireland, Spain, the United Kingdom and the United States in the years before the financial crisis.
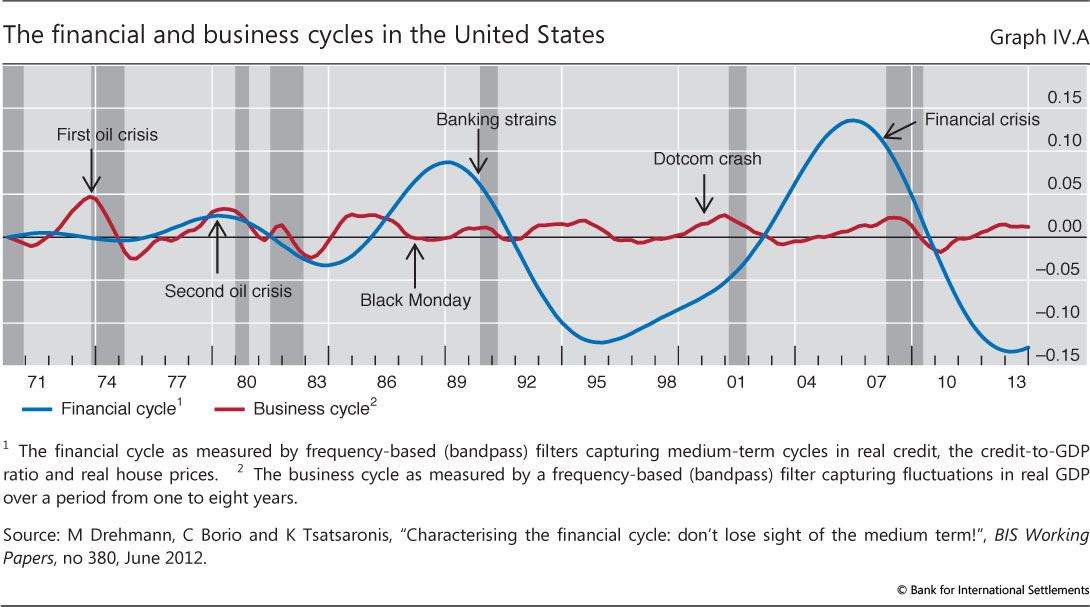
Diverging financial and business cycles can also help to explain the phenomenon of "unfinished recessions". For example, in the wake of the stock market crashes in 1987 and 2000, monetary policy in the United States was eased substantially, even though the financial cycle was in an upswing (Graph IV.A). Benefiting from lower interest rates, property prices and credit did not contract but expand, only to collapse several years later.
Box IV.A
Measuring financial cycles
Policymakers and researchers can build on a wealth of knowledge to measure business cycles, but the same is not true for financial cycles. This box discusses the main ideas and insights in the emerging literature on how to measure financial cycles.
Two methods have been used to identify both business and financial cycles. The first is known as the turning point method, and goes back to the original work in the 1940s to date business cycles, still used today by the NBER Business Cycle Dating Committee. This approach identifies cyclical peaks and troughs by looking at growth rates of a broad range of underlying series. For example, a business cycle peaks when the growth rate of several series, including output, employment, industrial production and consumption, changes from positive to negative. For financial cycles, BIS research has shown that real credit growth, the credit-to-GDP ratio and real property price growth represent the smallest set of variables needed to depict adequately the mutually reinforcing interaction between financing constraints and perceptions of value and risks that can cause serious macroeconomic dislocations and banking crises. That said, other variables, such as credit spreads, equity prices, risk premia and default rates, also measure risk or risk perceptions and hence financial cycles. The second approach is based on statistical filters that extract cyclical fluctuations with a particular cycle length from a specific series, for instance output.
The financial cycle estimates shown in this chapter follow the second approach and are based on joint developments in real credit growth, the credit-to-GDP ratio and real property price growth. Cycles in the individual series are extracted by using a bandpass filter with cycles lasting between eight and 30 years, which are then combined into a single series by taking a simple average. Bandpass filters are useful for identifying historical financial cycles, yet observations for recent years must be treated more carefully, as trends and thus cyclical fluctuations may change when more data become available in the future.
The traditional business cycle frequency is around one to eight years. By contrast, the financial cycles that matter most for banking crises and major macroeconomic dislocations last 10-20 years. This is evident from Graph IV.A. Focusing on medium-term frequencies is appropriate for two reasons. First, credit and property prices move much more closely together at these frequencies than at higher ones. Second, these medium-term cycles are an important driver of overall fluctuations in these two series, much more so than medium cyclical fluctuations are for real GDP. Financial cycles identified in this way are closely associated with systemic banking crises and serious economic damage. This holds irrespective of whether they are identified with a turning point approach or a statistical filter.
This box is based on M Drehmann, C Borio and K Tsatsaronis, "Characterising the financial cycle: don't lose sight of the medium term!", BIS Working Papers, no 380, June 2012. See also D Aikman, A Haldane and B Nelson, "Curbing the credit cycle", prepared for the Columbia University Center on Capital and Society Annual Conference, New York, November 2010; and S Claessens, M Kose and M Terrones, "How do business and financial cycles interact?", IMF Working Papers, no WP/11/88, April 2011. See Drehmann et al, op cit.
Where are countries in the financial cycle?
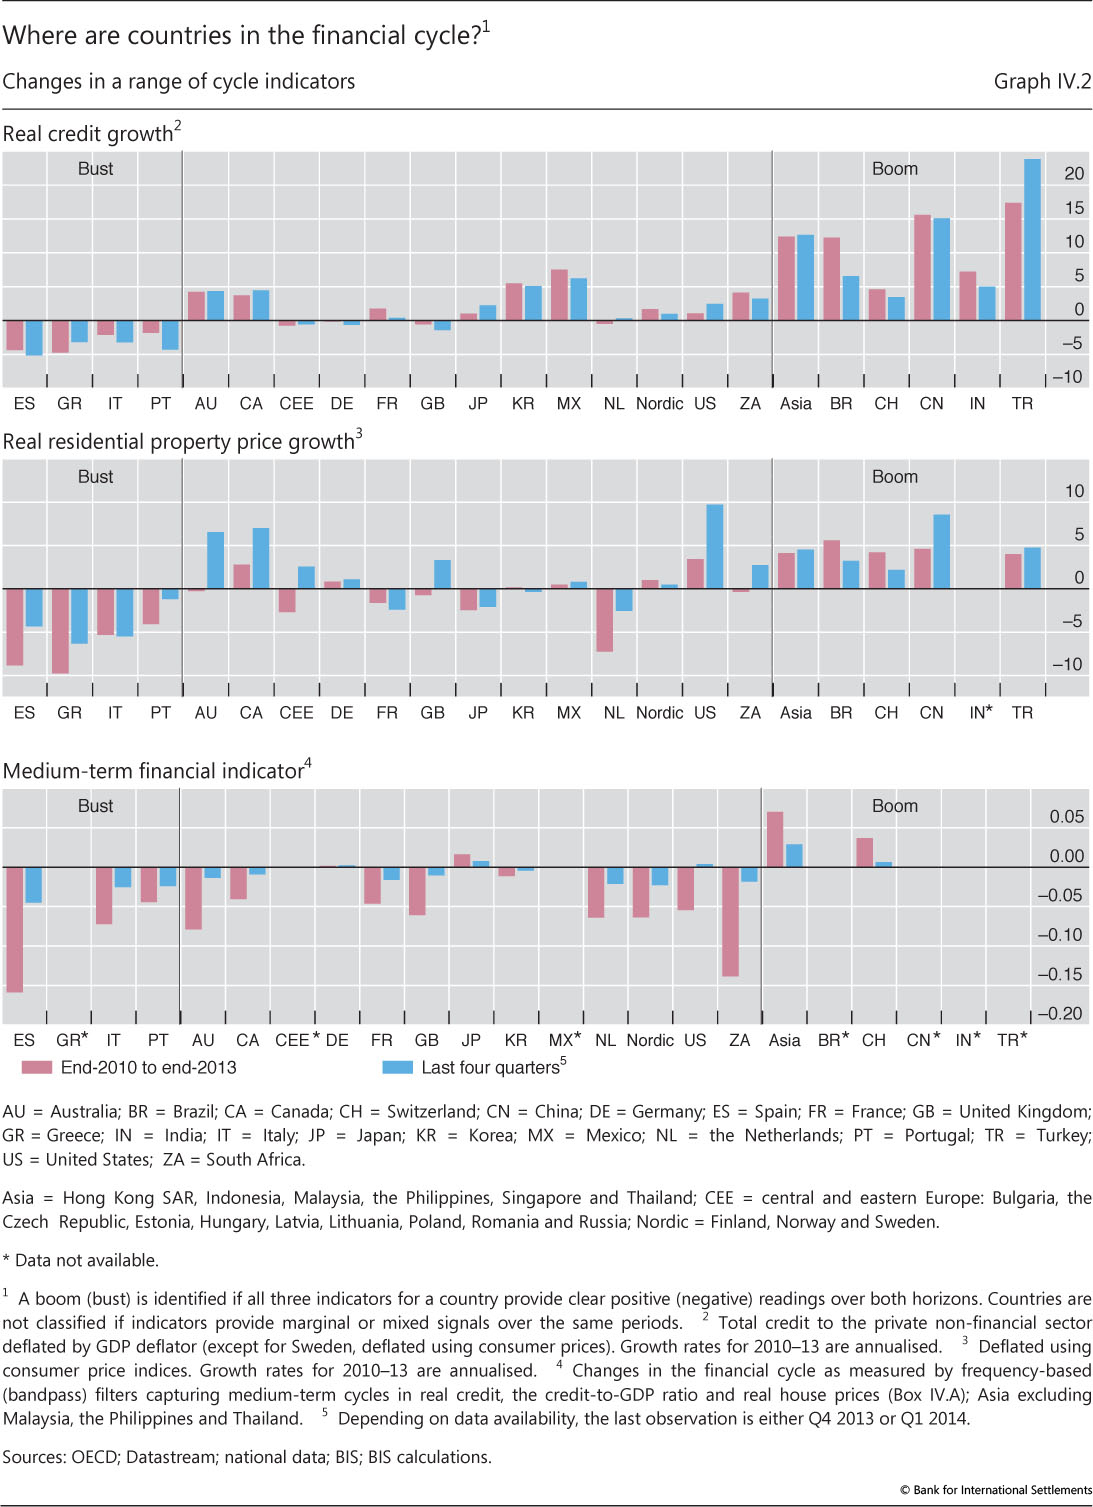
In recent years, financial cycle downswings in most advanced economies have coincided with upswings in large EMEs and other countries. Unfortunately, the lack of long series on credit and property prices precludes the construction of the financial cycle indicator illustrated in Graph IV.1 for several important economies. But recent credit and property price developments offer a useful picture, if an incomplete one. These data suggest that countries are at very different stages of the financial cycle (Graph IV.2).
Many euro area countries are in a financial downswing. Following a prolonged boom, the euro area countries that were most affected by the financial crisis and the subsequent European debt crisis, such as Greece and Spain, have seen real credit and property prices fall by an average of 5-10% annually in recent years. But downward pressures appear to be receding somewhat, as the decline in credit and house prices has slowed in recent quarters.
Financial cycles in other economies that experienced a crisis seem to have bottomed out. The United States saw a large run-up in credit and asset prices that ended with the onset of the financial crisis. The subsequent downswing in asset prices and non-financial corporate borrowing ended in 2011, and household borrowing started to pick up in 2013. The picture is less clear-cut for the United Kingdom and many central and eastern European economies - countries that also experienced boom-bust cycles in the last decade. Deleveraging in these countries continues, but the pace is slowing and property prices have started to rise again, suggesting that the downward trend in the financial cycle may have reversed.
Signals are mixed for advanced economies that did not see an outright crisis in recent years. Australia, Canada and the Nordic countries experienced large financial booms in the mid- to late 2000s. But the global and European debt crises dented these dynamics; asset prices fluctuated widely and corporate borrowing fell as global economic activity deteriorated. This pushed the medium-term financial cycle indicator on a downward trend, even though households in all these economies continued to borrow, albeit at a slower pace. But the strong increase in commodity prices in recent years prevented a lasting turn of the cycle, and over the last four quarters real property price and (total) credit growth in Australia and Canada has picked up to levels close to or in line with developments in large EMEs.
Booms are clearly evident in several other countries, in particular EMEs. In many cases, the surge in credit and asset prices slowed in 2008 and 2009 but resumed full force in 2010. Since then, credit to the private sector has expanded by an average of about 10% per year. In China, this growth was mainly driven by non-banks, whereas banks financed the expansion in Turkey. At present, there are signs that some of these booms are stalling. For example, property price growth in Brazil has weakened, which is typical of the later stages of the financial cycle. Rising defaults in the property sector in China also point in this direction.
What is driving the financial cycle in the current context?
To some extent, the current state of the financial cycle reflects the self-reinforcing adjustment after the financial crisis. The ratios of private sector debt to GDP have slid by roughly 20 percentage points from their recent peaks in the United States, the United Kingdom and Spain. While substantial, these reductions still fall well short of both the size of the prior increases in these countries and the average drop of 38 percentage points seen after a set of historical crises.1
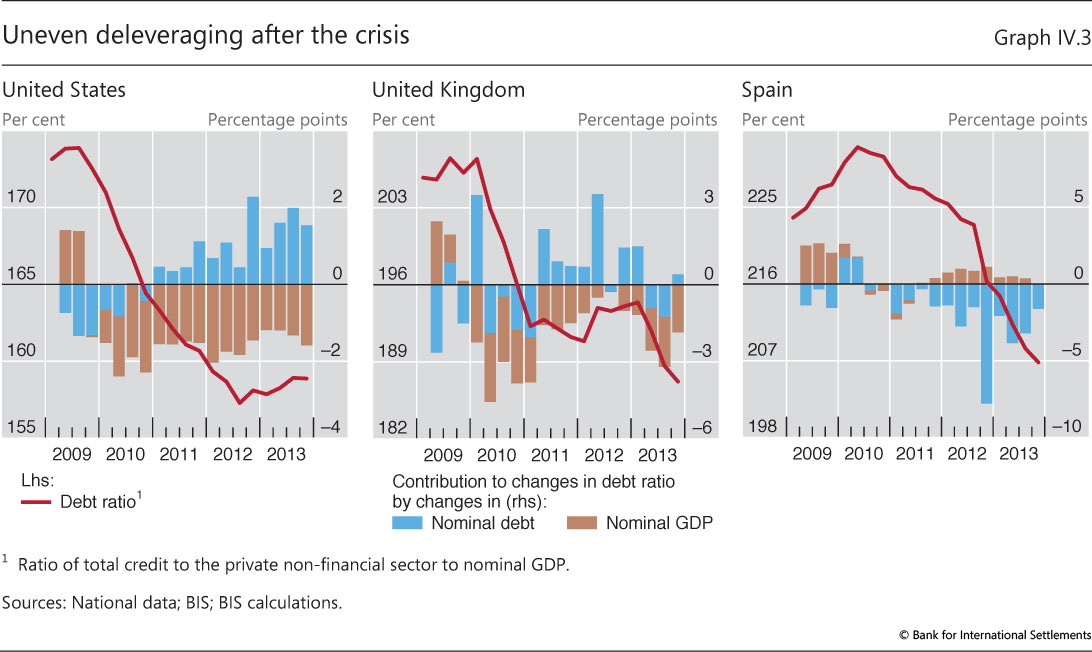
These developments could indicate that in at least some cases the ratios of debt to income still have some way to fall. This could particularly be the case for Spain, where the decrease in the debt ratio was achieved mainly through a reduction in the amount of nominal debt outstanding (Graph IV.3). This pattern is typical of the early stages of deleveraging. In the United States, nominal debt fell during 2009 and 2010 but has grown since. Instead, the main driver of deleveraging has been nominal GDP growth. The picture for the United Kingdom is more mixed: both debt reductions and nominal GDP growth have played a role.
Accommodative monetary policy has had an ambiguous impact on the adjustment to lower debt ratios (Chapter V). It has supported adjustment to the extent that it has succeeded in stimulating output, raising income and hence providing economic agents with the resources to pay back debt and save. But record low interest rates have also allowed borrowers to service debt stocks that would be unsustainable in more normal interest rate conditions, and lenders to evergreen such debt. This tends to delay necessary debt adjustments and result in a high outstanding stock of debt, which in turn can slow growth.
Global liquidity and domestic policies fuel credit booms
The strong post- crisis monetary policy easing in the major advanced economies has spurred a surge in global liquidity. Near zero policy rates and large-scale asset purchases by the Federal Reserve and other major central banks have boosted asset prices around the globe and fuelled investors' appetite for risk (the "risk-taking channel").
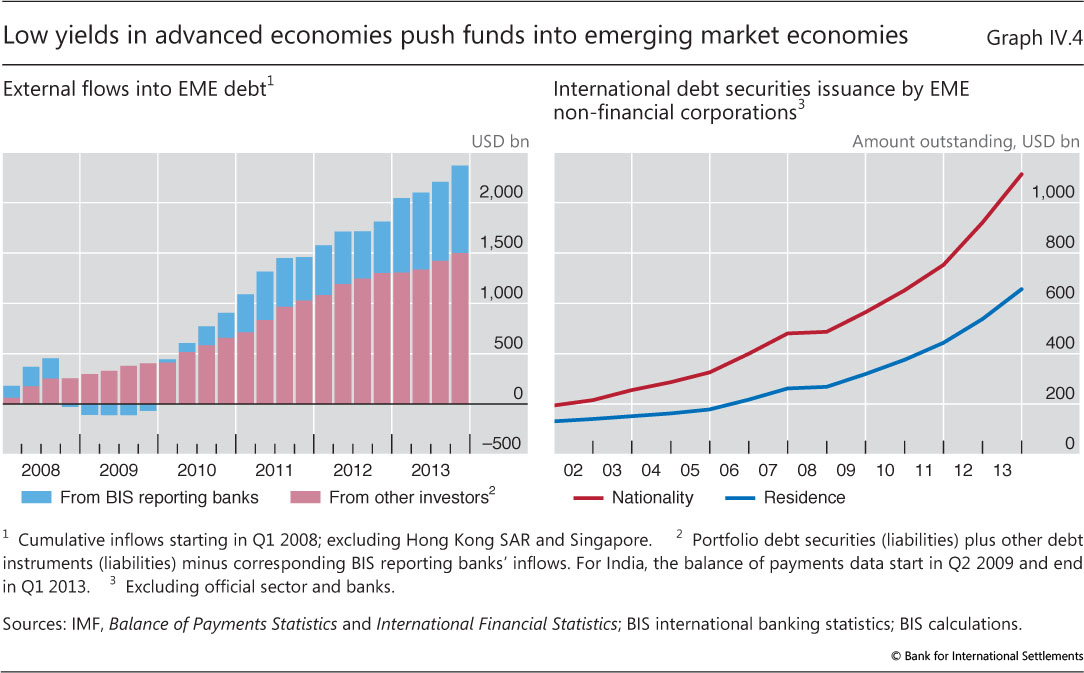
Large capital inflows have amplified the domestic financial expansion in many EMEs. Since the beginning of 2008, residents in EMEs have borrowed over $2 trillion abroad (Graph IV.4, left-hand panel).2 At 2.2% of their annual GDP this may not look large relative to current account balances, but over the period in question it represents a significant additional stock of external debt.
These residence-based figures actually underestimate the amount of external debt incurred by EME nationals because they ignore debt issued by offshore affiliates. Classifying issues by the immediate borrower's nationality (ie where its parent company is headquartered) rather than residence, as in the balance of payments, boosts the amount of debt securitities issued by EME corporations by over one third (Graph IV.4, right-hand panel).
Much of this debt was raised in the bond market from investors other than banks (red bars in Graph IV.4). This second phase of global liquidity contrasts with the period before the financial crisis, when bank lending played a central role.3 Two factors explain this shift. First, many globally active banks have been repairing their balance sheets in the wake of the crisis and have been less willing to lend outside their core markets (Chapter VI). Second, low interest rates and bond yields in the large advanced economies have pushed investors into higher-yielding asset classes such as EME debt (Chapter II). As a result, the average nominal long-term bond yield in EMEs, based on a sample of those economies with genuine long-term bond markets and floating exchange rates, fell from about 8% at the beginning of 2005 to around 5% by May 2013. Using the year-on-year change in consumer prices in those countries, this amounted to real long- term rates of just 1% in 2013.4
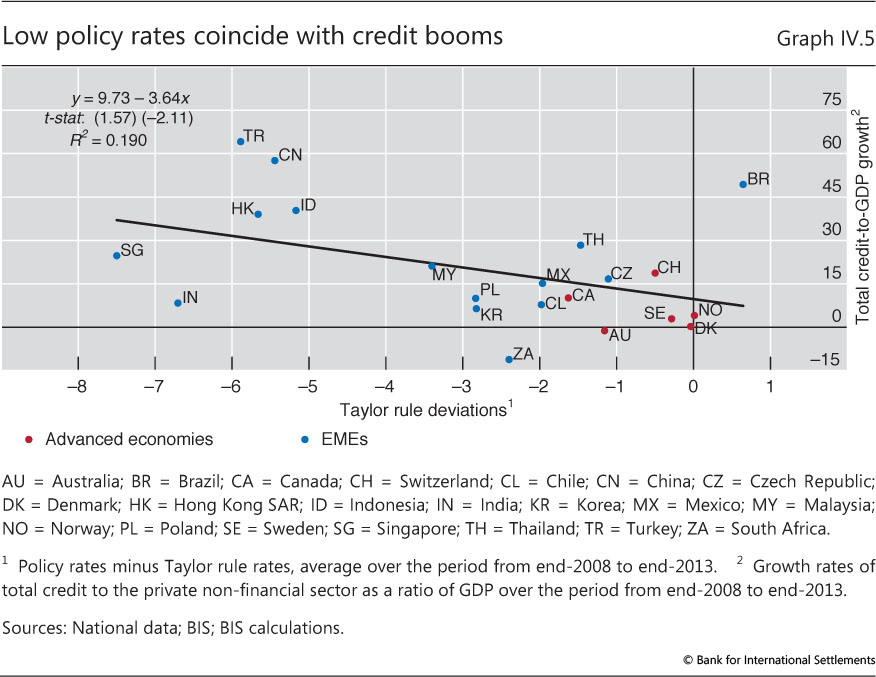
Offsetting the stimulus from abroad through tighter domestic policy is not easy. First, a large share of foreign capital inflows is denominated in foreign currency and thus not directly affected by domestic monetary policy. Second, raising domestic interest rates while rates in the rest of the world remain very low can trigger even more upward pressure on the exchange rate and capital inflows. Low domestic policy rates may limit debt inflows from abroad, but they also stimulate domestic lending. Indeed, countries with a more accommodative monetary policy for a given set of domestic economic conditions tend to experience more rapid credit growth (Graph IV.5).
Risks and adjustment needs
The position in the financial cycle identified above, as well as high levels of private sector debt, pose challenges for the years to come. There is obviously a risk that many of the more recent booms will end in a crisis or at least in severe financial stress, just as many have before. But even some countries that are currently in the down phase of the financial cycle or have just bottomed out are vulnerable. Despite significant deleveraging since the financial crisis, debt relative to income and asset prices often remains high, potentially requiring further adjustments to return to more sustainable levels.
This section first assesses the risk of financial crises using a series of early warning indicators, and then drills down further to better understand the implications of the shift from bank to bond finance in EMEs. Finally, the degree to which households and firms need to reduce their debt levels relative to GDP to return to more sustainable levels is analysed, and a potential debt trap is identified.
Indicators point to the risk of financial distress
Early warning indicators in a number of countries are sending worrying signals. In line with the financial cycle analysis developed in the previous section, several early warning indicators signal that vulnerabilities have been building up in the financial systems of several countries. Many years of strong credit and, often, property price growth have left borrowers exposed to increases in interest rates and/or sharp slowdowns in property prices and economic activity. Early warning indicators cannot predict the exact timing of financial distress, but they have proved fairly reliable in identifying unsustainable credit and property price developments in the past.
Credit-to-GDP gaps in many EMEs and Switzerland are well above the threshold that indicates potential trouble (Table IV.1). The historical record shows that credit-to-GDP gaps (the difference between the credit-to-GDP ratio and its long-term trend) above 10 percentage points have usually been followed by serious banking strains within three years.5 Residential property price gaps (the deviation of real residential property prices from their long-term trend) also point to risks: they tend to build up during a credit boom and fall two to three years before a crisis. Indeed, the Swiss authorities have reacted to the build-up of financial vulnerabilities by increasing countercyclical capital buffer requirements from 1% to 2% of risk-weighted positions secured by domestic residential property.
Debt service ratios send a less worrying signal. These ratios, which measure the share of income used to service debt (Box IV.B), remain low in many economies. Taken at face value, they suggest that borrowers in China are currently especially vulnerable. But rising rates would push debt service ratios in several other economies into critical territory (Table IV.1, last column). To illustrate, assume that money market rates rise by 250 basis points, in line with the 2004 tightening episode.6 At constant credit-to-GDP ratios, this would push debt service ratios in most of the booming economies above critical thresholds. Experience indicates that debt service ratios tend to remain low for long periods, only to shoot up rapidly one or two years before a crisis, typically in response to interest rate increases.7 Low values therefore do not necessarily mean that the financial system is safe.
It would be too easy to dismiss these indicator readings as inappropriate because "this time is different". True, no early warning indicator is fully reliable. The financial system evolves continuously, and the nature of risks shifts over time. But credit gaps and debt service ratios have proved to be relatively robust. They are based on total credit, ie taking account of credit from all sources,8 and are therefore generally not affected by the shift from bank to non-bank finance associated with the second phase of global liquidity. The quality of the indicators should also be robust to changes in the equilibrium levels of debt owing to financial deepening. Credit-to-GDP and debt service ratios tend to rise when households and businesses gain access to financial services, with the corresponding welfare benefits. But banks' ability to screen potential borrowers and manage risks puts a natural limit on how fast this process can take place. Credit extended during a phase of rapid credit growth could conceal problem loans, leading to financial instability when the boom turns to bust.9

Weaker output growth could also trigger financial strains, particularly in countries where debt has increased above trend for a long time. Many countries with large credit gaps have been experiencing a prolonged period of rapid growth, briefly interrupted by the fallout from the financial crisis in the advanced economies. But growth has slowed more recently, and may well remain below the previous trend in the future (Chapter III).
Commodity exporters could be especially sensitive to a sharp deceleration in China. This would further increase vulnerabilities of currently booming economies such as Brazil. But it may also adversely affect some of the advanced economies that were less affected by the financial crisis. As noted above, countries such as Australia, Canada and Norway were in the upswing of a pronounced financial cycle before the crisis erupted. Since then, the cycle has turned in these economies, but the fallout was buffered by high commodity prices. Since outstanding debt remains high, the slowdown of GDP associated with a reduction in commodity exports could cause repayment difficulties.
Looking beyond total credit, the shift from bank lending to market-based debt financing by non-financial corporations in EMEs has changed the nature of risks. On the one hand, borrowers have used the favourable conditions to lock in long-term funding, thus reducing rollover risk. For example, of the roughly $1.1 trillion in international debt securities outstanding of borrowers headquartered in EMEs, around $100 billion - less than one tenth of the total - matures in each of the coming years (Graph IV.6, left-hand panel). In addition, roughly 10% of the debt securities maturing in 2020 or later are callable, and an unknown proportion have covenants that allow investors to demand accelerated repayment if the borrower's conditions deteriorate. Nonetheless, potential annual repayments look relatively modest relative to the amount of foreign reserves of the main borrower countries.
But the benevolent impact of longer maturities could be offset by fickle market liquidity. The availability of market funding is notoriously procyclical. It is available in large quantities and at a cheap price when conditions are good, but this can change at the first hint of problems. Capital flows could reverse quickly when interest rates in the advanced economies eventually go up or when perceived domestic conditions in the host economies deteriorate. In May and June 2013, the mere possibility that the Federal Reserve would begin tapering its asset purchases led to rapid outflows from funds investing in EME securities (Chapter II), although overall portfolio investment was less volatile.
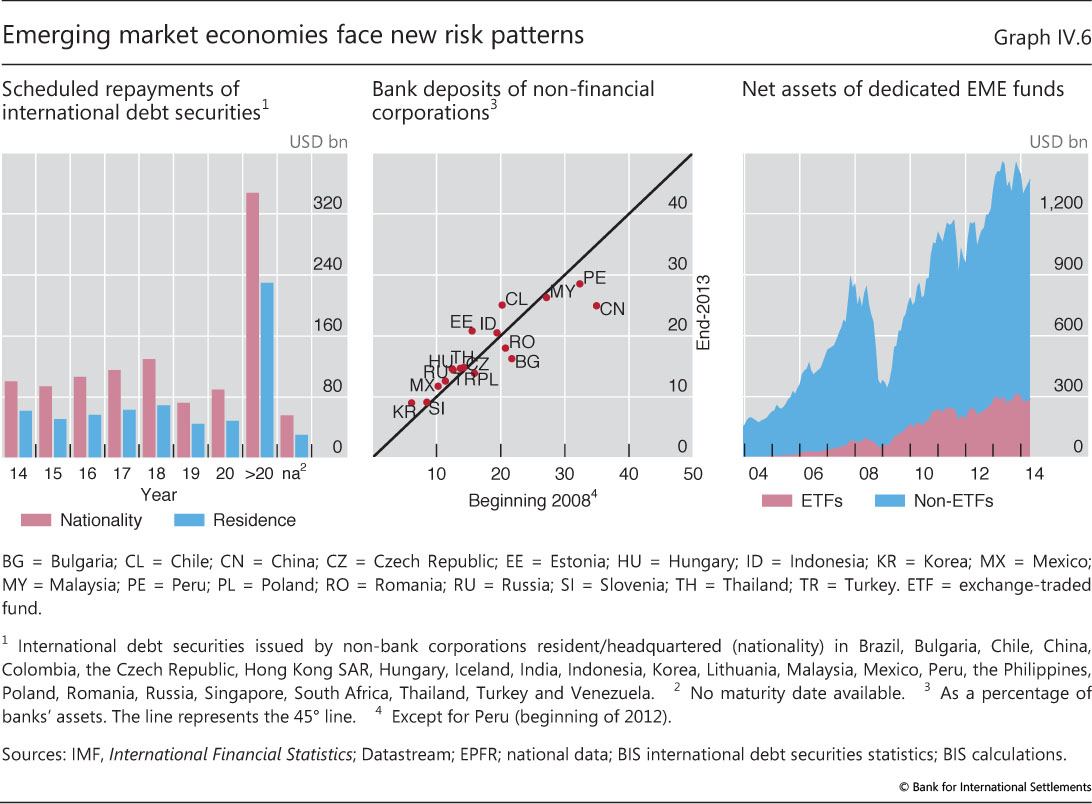
A higher proportion of investors with short- term horizons in EME debt could amplify shocks when global conditions deteriorate. Highly volatile fund flows to EMEs indicate that some investors view their investments in these markets as short-term positions rather than long-term holdings. This is in line with the gradual shift from traditional open- or closed-end funds to exchange-traded funds (ETFs), which now account for around a fifth of all net assets of dedicated EME bond and equity funds, up from around 2% 10 years ago (Graph IV.6, right-hand panel). ETFs can be bought and sold on exchanges at low cost, at least in normal times, and have been used by investors to convert illiquid securities into liquid instruments.
Financing problems of non-financial corporations in EMEs can also feed into the banking system. Corporate deposits in many EMEs stand at well above 20% of the banking system's total assets in countries as diverse as Chile, China, Indonesia, Malaysia and Peru (Graph IV.6, centre panel), and are on an upward trend in others. Firms losing access to external debt markets may be forced to withdraw these deposits, leaving banks with significant funding problems. Firms that have been engaging in a sort of carry trade - borrowing at low interest rates abroad and investing at higher rates at home - could be even more sensitive to market conditions.
Finally, the sheer volume of assets managed by large asset management companies implies that their asset allocation decisions have significant and systemic implications for EME financial markets. For instance, a relatively small (5 percentage point) reallocation of the $70 trillion in assets managed by large asset management companies from advanced economies to EMEs would result in additional portfolio flows of $3.5 trillion. This is equivalent to 13% of the $27 trillion stock of EME bonds and equities. And the ratio could be significantly larger in smaller open economies. Actions taken by asset managers have particularly strong effects if they are correlated across funds. This could be because of top-down management of different portfolios, as is the case for some major bond funds, similar benchmarks or similar risk management systems (Chapter VI).
The shift from bank to securities financing has apparently had little impact on currency risk. Over 90% of international debt securities and well over 80% of cross-border loans by non-bank corporations resident in EMEs are effectively denominated in foreign currency. And some of the heaviest borrowers in the international bond market are property firms and utilities, which are unlikely to have significant foreign currency assets or payment streams that could back up their debt. There are financial instruments that could hedge some of the currency risk. But in practice many hedges are incomplete, because they cover exposures only partly, or are based on shorter-term contracts that are regularly rolled over. Such strategies significantly reduce the value of financial hedges against large fluctuations in exchange rates, which often coincide with illiquid markets.
Returning to sustainable debt levels
Regardless of the risk of serious financial distress, in the years ahead many economies will face headwinds as outstanding debt adjusts to more sustainable long-run levels. Determining the exact level of sustainable debt is difficult, but several indicators suggest that current levels of private sector indebtedness are still too high.
For one, sustainable debt is aligned with wealth. Sharp drops in property and other asset prices in the wake of the financial crisis have pushed down wealth in many of the countries at the heart of the crisis, although it has been recovering in some. Wealth effects can be long-lasting. For example, real property prices in Japan have decreased by more than 3% on average per year since 1991, thus reducing the collateral available for new borrowing.
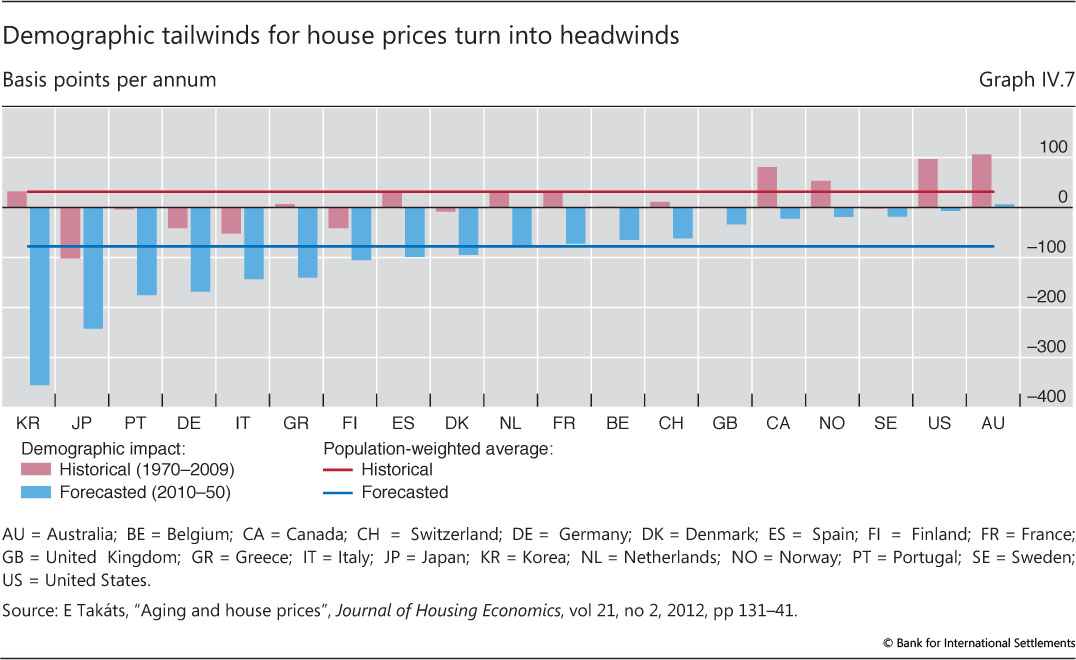
Long-run demographic trends could aggravate this problem by putting further pressure on asset prices (Chapter III). An ageing society implies weaker demand for assets, in particular housing. Research on the relationship between house prices and demographic variables suggests that demographic factors could dampen house prices by reducing property price growth considerably over the coming decades (blue bars in Graph IV.7).10 If so, this would partially reverse the effect of demographic tailwinds that pushed up house prices in previous decades (red bars).
Debt service ratios also point to current debt levels being on the high side. High debt servicing costs (interest payments plus amortisations) compared with income effectively limit the amount of debt that borrowers can carry. This is clearly true for individuals. Lenders, for example, often refuse to provide new loans to households if future interest payments and amortisations exceed a certain threshold, often around 30-40% of their income. But the relationship also holds in the aggregate.
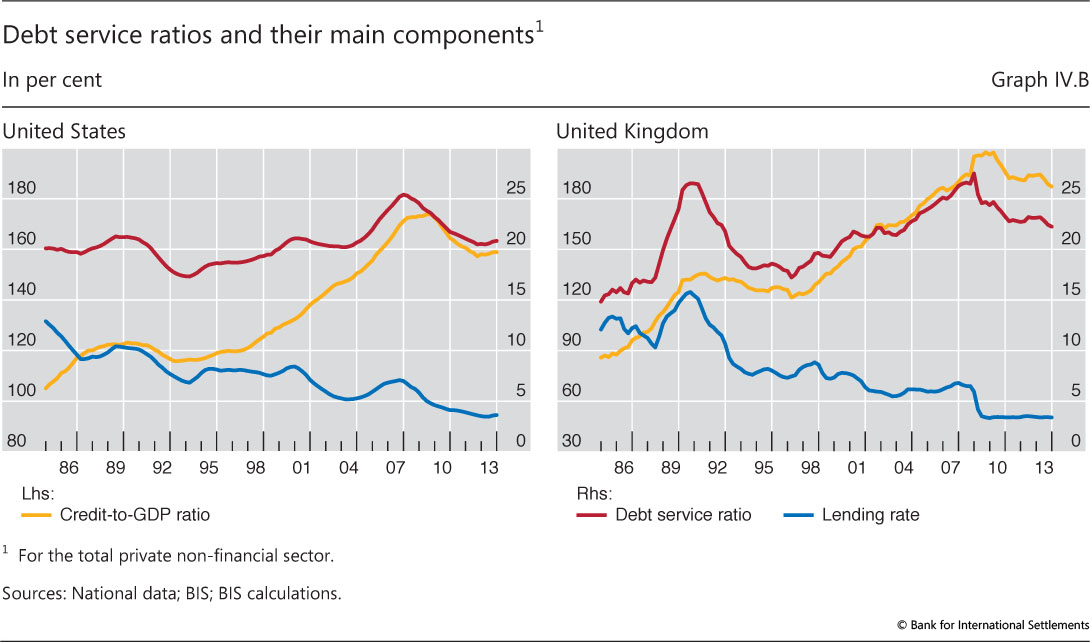
Empirically, aggregate debt service ratios fluctuate around stable historical averages (Graph IV.B), which can be taken as rough approximations for long-term sustainable (steady state) levels. High private sector debt service costs relative to income will result in less credit being extended, eventually translating into falling aggregate debt service costs. Conversely, low debt service ratios give borrowers ample room to take on more debt. Hence, over time economy-wide debt service ratios gravitate back to steady state levels.11
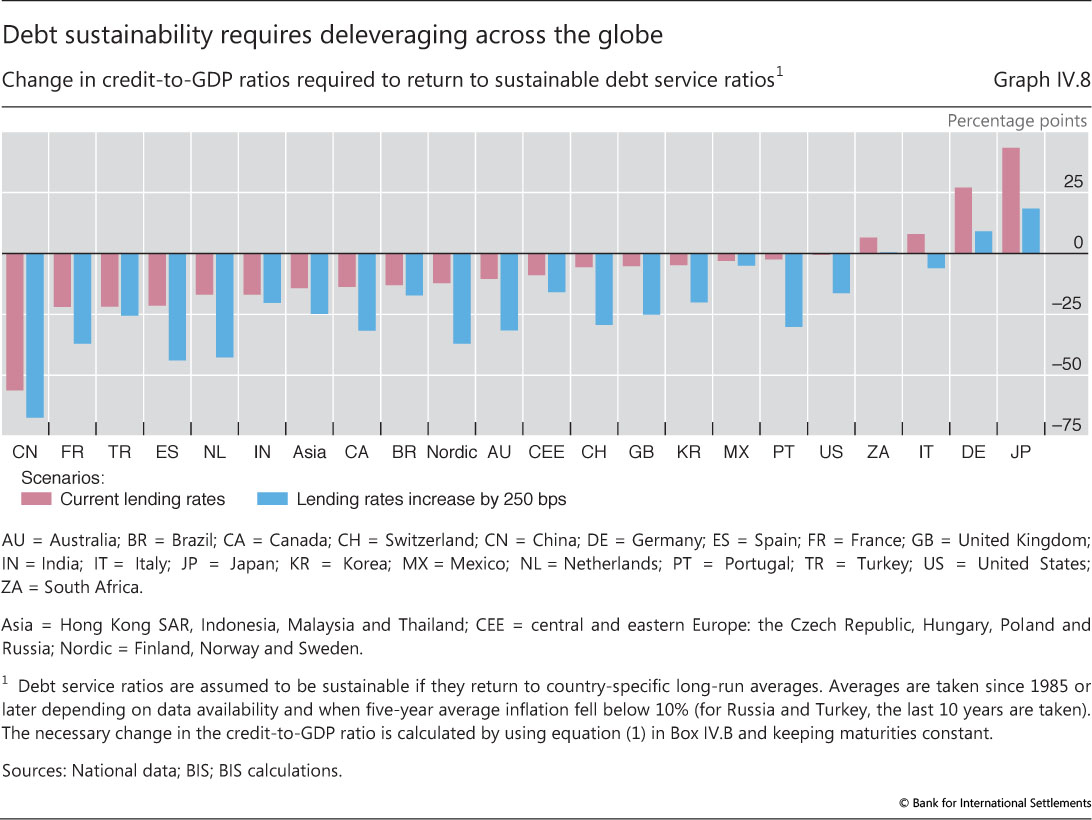
In all but a handful of countries, bringing debt service ratios back to historical norms would require substantial reductions in credit-to-GDP ratios (Graph IV.8). Even at the current unusually low interest rates, credit-to-GDP ratios would have to be roughly 15 percentage points lower on average for debt service ratios to be at their historical norms. And if lending rates were to rise by 250 basis points, in line with the 2004 tightening episode, the necessary reductions in credit-to-GDP ratios would swell to over 25 percentage points on average. In China, credit-to-GDP ratios would have to fall by more than 60 percentage points. Even the United Kingdom and the United States would need to reduce credit-to-GDP ratios by around 20 percentage points, despite having debt service ratios in line with long-term averages at current interest rates.
How can economies bring debt back to sustainable levels?
Downward pressures from lower wealth and high debt service burdens suggest that many economies will have to lower their debt levels in the years to come. This can happen through several channels. The first, and least painful, channel is through output growth, which has the dual effect of reducing credit-to-GDP and debt service ratios and also supports higher asset prices. The muted growth outlook in many economies (Chapter III) is not particularly reassuring from this perspective.
Inflation can also have an effect. But the extent to which it reduces the real debt burden depends on how much interest rates on outstanding and new debt adjust to higher price increases. More importantly, though, even if successful from this narrow perspective, it also has major side effects. Inflation redistributes wealth arbitrarily between borrowers and savers and risks unanchoring inflation expectations, with unwelcome long-run consequences.
The alternative to growing out of debt is to reduce the outstanding stock of debt. This happens when the amortisation rate exceeds the take-up of new loans. This is a natural and important channel of adjustment, but may not be enough. In some cases, unsustainable debt burdens have to be tackled directly, for instance through writedowns. Admittedly, this means that somebody has to bear the ensuing losses, but experience shows that such an approach may be less painful than the alternatives. For example, the Nordic countries addressed their high and unsustainable debt levels after the banking crises of the early 1990s by forcing banks to recognise losses and deal decisively with bad assets, including through disposals. In addition, authorities reduced excess capacity in the financial system and recapitalised banks subject to tough viability tests. This provided a solid basis for recovery, which came relatively quickly.12
Reducing debt levels through writedowns may require important changes in the regulatory framework in a number of countries. As argued in the 82nd Annual Report (in the box in Chapter III), reducing household debt requires two main steps. First, authorities need to induce lenders to recognise losses. Second, they should create incentives for lenders to restructure loans so that borrowers have a realistic chance of repaying their debt.13
The impact of interest rates is ambiguous. In principle, lower interest rates can reduce debt service burdens. Lower rates may also provide support to asset prices. In fact, monetary authorities have typically cut interest rates in the wake of financial crises, thus reducing the debt service burden on households and firms. Unfortunately, however, low interest rates can also have the perverse effect of incentivising borrowers to take on even more debt, making an eventual rise in rates even more costly if debt continues to grow. Depending on initial conditions, low rates could therefore lead countries into a debt trap: debt burdens that already seem unsustainable now may grow even further.
Box IV.B
Estimating debt service ratios
This box details the construction of debt service ratios (DSRs) and some of the technicalities underlying Graphs IV.8 and IV.9.
Calculating economy-wide DSRs involves estimation and calibration, as detailed loan-level data are generally not available. We use the methodology outlined in Drehmann and Juselius (2012), who in turn follow an approach developed by the Federal Reserve Board to construct debt service ratios for the household sector (Dynan et al (2003)). We start with the basic assumption that, for a given lending rate, debt service costs - interest and repayments - on the aggregate debt stock are repaid in equal portions over the maturity of the loan (instalment loans). By using the standard formula for calculating the fixed debt service costs (DSC) of an instalment loan and dividing it by GDP, we can calculate the DSR at time t as

where Dt denotes the aggregate stock of debt to the private non- financial sector as reported by the BIS, Yt quarterly GDP, it the average interest rate per quarter, and st the average remaining maturity in quarters (ie for a five-year average remaining maturity st = 20).
While credit and GDP are readily observable, this is generally not the case for the average interest rate and average remaining maturities. For data availability reasons, we proxy the average interest rates on the entire stock of debt with the average interest rates on loans from monetary and financial institutions to the non-financial private sector. This assumes that the evolution of interest rates from bank and non-bank lenders is similar, which seems reasonable. For a few countries, mainly in central and eastern Europe and emerging Asia, no lending rates are available. We proxy them with the short-term money market rate plus the average markup between lending rates and the money market rates across countries. Drawing on the few available sources, we approximate remaining maturities, but this remains crude. Particularly in the earlier parts of the sample, it may well be the case that maturities were lower, and DSRs thus higher, given higher inflation rates and shorter life expectancy.
The historical averages may be biased downwards and thus the deleveraging needs shown in Graph IV.8 upwards. But the bias is likely to be small, as changes in the maturity parameter have limited effects on the estimated DSR trends. Furthermore, estimates for the US household sector lead to similar DSRs to those published by the Federal Reserve, which are based on much more granular data. Levels are also generally comparable across countries, and the derived DSRs exhibit long-run swings around country-specific historical averages, indicating that these are realistic benchmarks.
Comparing the evolution of DSRs with that of lending rates and credit-to-GDP ratios shows that falling interest rates allowed the private sector to sustain higher debt levels relative to GDP (Graph IV.B). From 1985 onwards, debt-to-GDP ratios in the United Kingdom and the United States increased substantially, even after taking into account the fall in the wake of the financial crisis. At the same time, lending rates decreased from more than 10% to around 3% now. The combined effect implies that DSRs fluctuate around long-run historical averages.
To construct projections of the DSR for different interest rate scenarios (Graph IV.9), we estimate the joint dynamics of lending rates and credit-to-GDP ratios using a standard vector autoregression (VAR) process. In addition to these two variables, we include real residential property prices as an endogenous variable to control for changes in collateral values, which may allow agents to increase their leverage. The short-term money market rate enters exogenously. Using the estimated VAR, credit-to- GDP, average lending rates and real property prices are then projected based on different scenarios for the money market rate. Assuming maturities remain constant, the resulting credit-to-GDP ratios and lending rates are then transformed into the DSRs shown in Graph IV.9.
Four interest rate scenarios are considered, all of which start in the second quarter of 2014 and end in the fourth quarter of 2017. In the first, money market rates evolve in line with market-implied short rates. In the second scenario, absolute changes in money market rates follow those observed in each country during the tightening episode that began in June 2004, and are fixed once the maximum is reached. Third, interest rates are raised to their country-specific long-run averages over eight quarters, and remain constant thereafter. In the fourth scenario, interest rates are kept constant from the second quarter of 2014 onwards.
The results highlight that debt service burdens are likely to increase, or at least not decrease, even taking into account several caveats. For instance, the confidence intervals of the projections increase with the horizon and become fairly large by 2017, but even they do not suggest any substantial decrease. Furthermore, the VAR is estimated using a sample from the first quarter of 1985 to the fourth quarter of 2013. Thus, the projections are based on mostly normal relationships, which may not be accurate during periods of financial stress or balance sheet recessions, when excessive leverage may imply that credit-to-GDP ratios become unresponsive to interest rates. The VAR framework also assumes that increases or decreases in money market rates are passed on symmetrically to lending rates. If borrowers have locked in current low rates and rates rise, the increase in the DSRs may be less pronounced than shown but still more than in the constant rate scenario, as new borrowers have to pay higher rates.
M Drehmann and M Juselius, "Do debt service costs affect macroeconomic and financial stability?", BIS Quarterly Review, September 2012, pp 21-35; and K Dynan, K Johnson and K Pence, "Recent changes to a measure of US household debt service", Federal Reserve Bulletin, vol 89, no 10, October 2003, pp 417-26. The justification is that the differences between the repayment structures of individual loans will tend to cancel out in the aggregate. For example, consider 10 loans of equal size for which the entire principal is due at maturity (bullet loans), each with 10 repayment periods and taken out in successive years over a decade. After 10 periods, when the first loan falls due, the flow of repayments on these 10 loans jointly will be indistinguishable from the repayment of a single instalment loan of the same size. Typically, a large share of private sector loans in most countries will in any case be instalment loans, eg household sector mortgage credit. See the BIS database on total credit to the private non-financial sector (www.bis.org/statistics/credtopriv.htm). These series are typically only recorded for the past decade or so, but can be extended further back using a weighted average of various household and business lending interest rates, including the rates on mortgage, consumption and investment loans. We take only long-run averages as proxies for long-run sustainable levels of DSRs for Graph IV.8, after inflation has fallen persistently below 10%. Projected increases in DSRs are somewhat larger if inflation is included in the VAR as an endogenous variable. Inflation was not included for the results shown in Graph IV.9, to base the projections on the most parsimonious system.
Scenario analysis suggests that a debt trap is not just a remote possibility for some countries. The analysis is based on a model capturing the joint dynamics of credit-to-GDP ratios, interest rates and property prices (Box IV.B). Graph IV.9 shows the estimated future trajectories for debt ratios and property prices for four interest rate scenarios for the United Kingdom and the United States. The estimated trajectories look similar for other economies, such as Korea or Brazil.
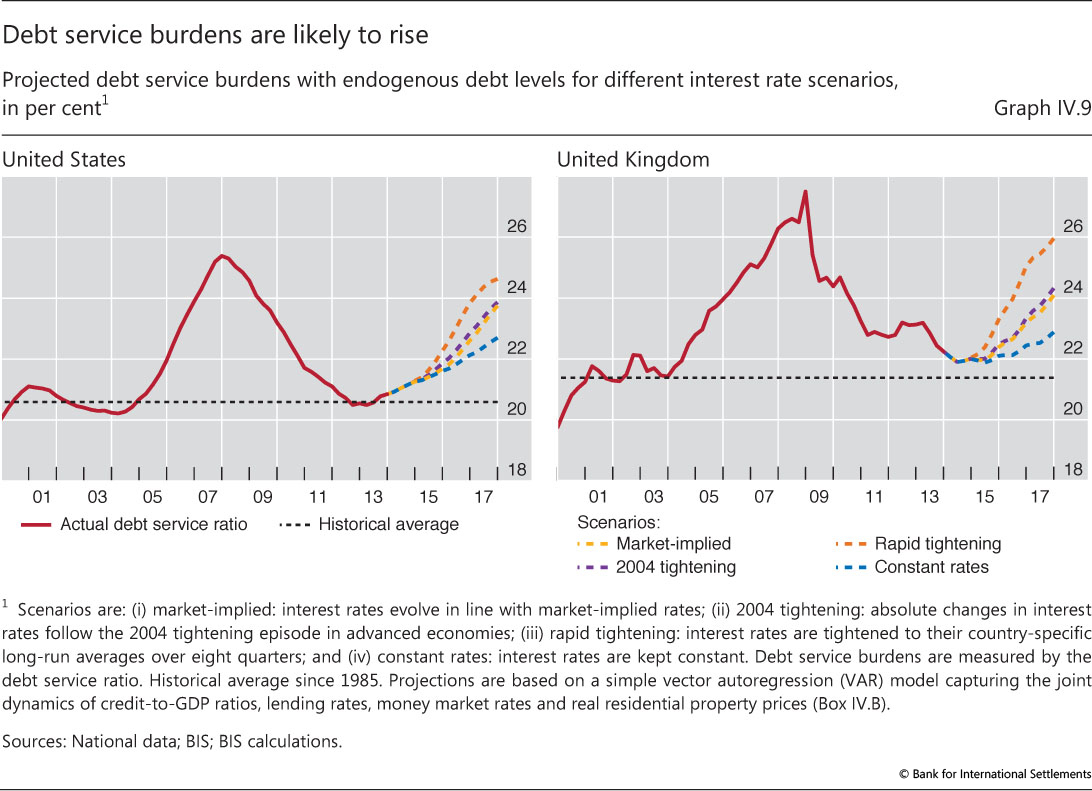
The scenarios highlight that debt service burdens would increase in some countries irrespective of whether policy rates rose or remained low. At one extreme, a reversion of money market rates to historical averages would push debt service burdens to levels close to the historical maxima seen on the eve of the crisis. But debt service burdens would also grow at the other extreme, if interest rates remained at the current low levels. Whereas costs on the current stock of debt would remain constant, further borrowing by households and firms would push up aggregate debt service costs in this scenario.
To be sure, this scenario analysis is only illustrative. Moreover, it is based on the assumption that interest rates rise independently of macroeconomic conditions: presumably, central banks would not raise them unless the outlook for output was favourable. However, the scenarios examined do point to the tensions embedded in the current situation.
The conclusion is simple: low interest rates do not solve the problem of high debt. They may keep service costs low for some time, but by encouraging rather than discouraging the accumulation of debt they amplify the effect of the eventual normalisation. Avoiding the debt trap requires policies that encourage the orderly running-down of debt through balance sheet repair and, above all, raise the long-run growth prospects of the economy (Chapters I and III).
1 G Tang and C Upper, "Debt reduction after crises", BIS Quarterly Review, September 2010, pp 25-38, show that the ratio of credit to GDP fell after 17 out of a sample of 20 such crises. On average, it dropped by 38 percentage points, almost the same magnitude as the increase during the preceding boom (44 percentage points).
2 In order to avoid double-counting of flows routed through offshore centres, flows to Hong Kong SAR and Singapore are dropped, but flows from these financial centres to other EMEs are included.
3 See H S Shin, "The second phase of global liquidity and its impact on emerging economies", keynote address at the Federal Reserve Bank of San Francisco Asia Economic Policy Conference, November 2013.
4 See P Turner, "The global long-term interest rate, financial risks and policy choices in EMEs", BIS Working Papers, no 441, February 2014.
5 The Basel Committee on Banking Supervision chose the credit-to-GDP gap as a starting point for discussions about countercyclical capital buffer levels because of its reliability as an early warning indicator. A credit-to-GDP gap above 2 (beige cells in Table IV.1) indicates that authorities should consider putting in place buffers, which would reach their maximum at readings above 10 (red cells).
6 In the 2004 tightening episode, money market rates in advanced economies increased by around 250 basis points over three years. The thought experiment here assumes that there is a one-to-one pass-through from money market rates to average lending rates for loans to the private non-financial sector, which, together with current credit-to-GDP ratios and average remaining maturities, determine the debt service burden (Box IV.B).
7 See M Drehmann and M Juselius, "Evaluating early warning indicators of banking crises: satisfying policy requirements", International Journal of Forecasting, 2014.
8 For a discussion of the coverage of total credit series, see C Dembiermont, M Drehmann and S Muksakunratana, "How much does the private sector really borrow - a new database for total credit to the private non-financial sector", BIS Quarterly Review, March 2013, pp 65-81.
9 BIS research has shown that the credit-to-GDP gap is a useful indicator for EMEs, where the scope for further financial deepening tends to be larger than in most advanced economies. See M Drehmann and K Tsatsaronis, "The credit-to-GDP gap and countercyclical capital buffers: questions and answers", BIS Quarterly Review, March 2014, pp 55- 73.
10 See E Takáts, "Aging and house prices", Journal of Housing Economics, vol 21, no 2, 2012, pp 131-41.
11 Box IV.B discusses caveats associated with the choice of long-run averages as benchmarks.
12 See C Borio, B Vale and G von Peter, "Resolving the financial crisis: are we heeding the lessons from the Nordics?", BIS Working Papers, no 311, June 2010.
13 For recent work on this issue, see Y Liu and C Rosenberg, "Dealing with private debt distress in the wake of the European financial crisis", IMF Working Papers, no WP/13/44, 2013; and J Garrido, Out-of-court debt restructuring, World Bank, 2012.