Highlights of the BIS international statistics
The BIS, in cooperation with central banks and monetary authorities worldwide, compiles and disseminates several data sets on activity in international financial markets. This chapter summarises the latest data for the international banking market, available up to end-March 2014, and analyses those for the international debt securities market, available up to end-June 2014.1
Between end-December 2013 and end-March 2014, the cross-border claims of BIS reporting banks rose by $580 billion, the first substantial quarterly increase since late 2011. The expansion was broadly spread across countries and sectors. Claims on both advanced and emerging market economies grew considerably. At individual country level, claims vis-à-vis borrowers in China increased the most, taking the outstanding stock of cross-border claims on the country above $1 trillion at end-March 2014 (including inter-office transactions by Chinese and other banks). Claims on the rest of Asia, Latin America and Africa and the Middle East also increased, albeit at a more modest pace. By contrast, claims on emerging Europe fell for a fourth consecutive quarter.
The box on securities statistics highlights the recent change in the pattern of global credit intermediation from bank credit to bond finance and outlines potential risks. It focuses on emerging market corporate borrowers, whose issuance of international debt securities has surged in recent years, especially on a nationality basis that includes issuance by offshore subsidiaries. The box considers the likely implications of the lengthening of bond maturities for rollover risk. The need to roll over these debts in any future capital market disruptions has the potential to impose significant costs on the economy through slower growth and tighter financial conditions.
Recent developments in the international banking market
The first quarter of 2014 saw the first substantial expansion in international banking activity since late 2011. The cross-border claims of BIS reporting banks rose by $580 billion between end-December 2013 and end-March 2014. While not enough to offset the preceding quarterly declines, the rise caused the annual rate of contraction in cross-border claims to slow from 4.0% as of end-2013 to 2.0% as of end-March 2014.2
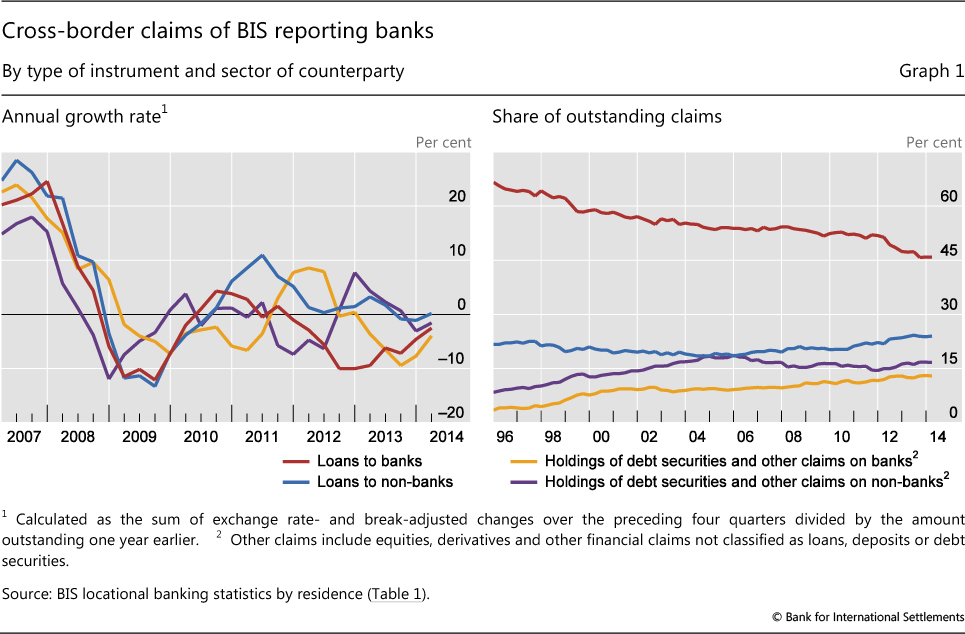
The upturn in overall activity in the first quarter of 2014 was boosted by the first quarterly increase in cross-border interbank claims since late 2011. Interbank claims, which in the locational banking statistics3 capture positions with related offices as well as unrelated banks, rose by $298 billion. As a result, the annual rate of contraction of cross-border interbank activity slowed from 5.3% at end-December 2013 to 2.9% at end-March 2014. As usual, the expansion in interbank claims consisted almost entirely of loans (Graph 1, left-hand panel). Cross-border claims on other banks and related offices in the euro area, including intra-euro area activity, increased by $104 billion in the first quarter of 2014, ending a run of seven consecutive declines.
Matching the rise in cross-border interbank lending to the euro area, euro-denominated cross-border claims also grew during the first quarter of 2014. The $163 billion quarterly increase was the first since early 2012. It reduced the annual rate of contraction from 10% at end-2013 to 7.7% at end-March 2014.
Overall cross-border claims on non-banks - mainly non-bank financial institutions, governments and non-financial corporations - also grew between end-December 2013 and end-March 2014. The $282 billion rise was the largest since late 2010. While loans accounted for the bulk of the increase in the first quarter of 2014 ($196 billion), BIS reporting banks continued to increase their holdings of non-banks' securities as well ($86 billion). However, the annual growth rate of their securities purchases remained lower than the growth rates seen in 2012 and 2013 (Graph 1, left-hand panel, purple line).
Cross-border lending to non-banks in the United States was especially strong, expanding by $73 billion in the first quarter of 2014. The BIS consolidated banking statistics4 on an immediate borrower basis suggest that the majority of this rise reflected increased lending to the US non-bank private sector, whose share of all international claims on the United States rose by a full percentage point (from 52.0% to 53.0%) between end-December 2013 and end-March 2014. By contrast, the share of claims on the US public sector declined by 0.7 percentage points (from 23.5% to 22.8%) during the same period.
Notwithstanding the latest quarterly upturn in cross-border interbank loans, their share of overall cross-border claims has gradually declined, from roughly two thirds at end-1995 to 46% at end-March 2014 (Graph 1, right-hand panel, red line). By contrast, the share of cross-border loans to non-banks, which remained stable at around 20% between end-1995 and end-2005, has grown over the past few years, reaching 24% at the end of March 2014 (blue line). In the meantime, the share of banks' cross-border holdings of securities issued by non-banks more than doubled between end-1995 and end-2005 (from 8% to 19%) before retreating to 17% as of end-March 2014 (purple line). Finally, the share of banks' cross-border holdings of securities issued by other banks increased from 3% at the end of 1995 to 13% at the end of March 2014 (yellow line).
Credit to emerging market economies
Cross-border lending to emerging market economies continued to grow in the first quarter of 2014. The $166 billion increase for the period brought the annual growth of claims on emerging markets to 10% at end-March 2014.5
Just as in the preceding several quarters, the main driver of the expansion during the first quarter of 2014 was lending to China, which rose by $133 billion. This took the annual growth rate of claims on China to 49%. At end-March 2014, the outstanding stock of cross-border claims on China stood at just over $1 trillion, with interbank claims accounting for almost three quarters ($726 billion) of that amount. The consolidated banking statistics indicate that a significant share of the reported cross-border claims on China - over $400 billion - is booked by banks headquartered outside the BIS reporting area through their offices in BIS reporting countries: for example, through Chinese banks located in Hong Kong SAR.6, 7 By comparison, the consolidated foreign claims of banks headquartered inside the BIS reporting area on Chinese residents totalled $796 billion on an ultimate risk basis at end-March 2014.8
Claims on the rest of emerging Asia also grew (by $21 billion) during the first quarter of 2014, but at a much more moderate pace than those vis-à-vis China (7.8% on an annual basis).
Just as in the preceding quarter, claims on Latin America and the Caribbean grew at a very modest pace during the quarter. Claims on the region rose, but only by $8.9 billion. Internationally active banks increased their claims on Brazil by $7.6 billion. By contrast, cross-border lending to residents of Mexico contracted by $3.7 billion.
Cross-border lending to emerging Europe fell for the fourth consecutive quarter. The $15 billion contraction, which was larger than any of the three that preceded it, caused claims on the region to fall by 1.9% on an annual basis. At individual country level, claims on Turkey and Poland shrank the most (by $5.3 billion and $4.8 billion, respectively). By contrast, claims on Hungary rose by $1.3 billion in the first quarter of 2014.
As the geopolitical uncertainty surrounding Russia and Ukraine increased in the first quarter of 2014, internationally active banks reported declines in (the US dollar value of) their consolidated foreign claims on both countries. The consolidated banking statistics on an ultimate risk basis reveal that the outstanding stock of foreign claims on Russia declined from $225 billion at end-December 2013 to $209 billion at end-March 2014, while those on Ukraine dropped from $25 billion to $22 billion.9 However, these reported reductions in foreign claims were amplified by the sharp depreciation in the value of these countries' currencies against the US dollar during the first quarter of 2014, which reduced the US dollar value of claims booked in local currencies through local affiliates.10 The locational banking statistics indicate that, on an exchange rate-adjusted basis, cross-border claims on residents of Russia remained virtually unchanged in the first quarter of 2014 (-$0.3 billion), while those on Ukraine declined by $1.5 billion (-15% on an annual basis).
Recent changes in global credit intermediation and potential risks
Branimir Gruić, Masazumi Hattori and Hyun Song Shin
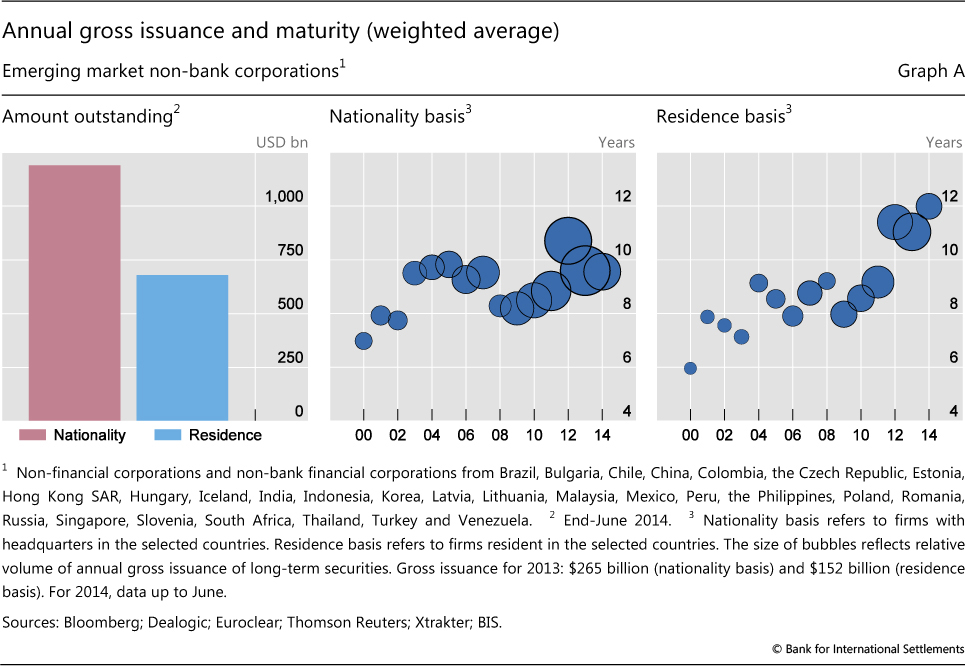
Global credit intermediation has seen a marked shift from the banking sector to the debt securities market, reflecting the combination of subdued cross-border banking activity in 2009-12 and portfolio investors' search for yield in a low-yield environment. The shift is particularly notable for emerging market corporate borrowers, where the amounts outstanding by nationality (based on location of headquarters) exceed the traditional residence-based amounts (Graph A, left-hand panel), indicating substantial offshore issuance not captured in conventional external debt statistics. See Chui et al (2014) for a more detailed description of borrower characteristics and exposures.
The average maturity of international debt securities newly issued by EME corporate borrowers has been increasing. The centre and right-hand panels of Graph A depict the amount and average maturity of gross issuance of international debt securities by EME non-bank corporates. The size of the bubble represents the dollar amount while the height of the bubble represents average maturity weighted by issuance amount. Graph A shows increased issuance amounts in recent years (larger bubbles) as well as longer maturities, especially for the residence-based series. In terms of the stock of outstanding debt securities by residence, the average remaining maturity excluding money market instruments now exceeds eight years.
Longer maturities mitigate rollover risk for borrowers, but this is achieved at the expense of greater sensitivity of bond prices to yield changes - greater duration risk for the lender. Although many bond investors such as institutional investors do not operate with much leverage, if any, they may be susceptible to leverage-like behaviour if they are subject to risk limits, are sensitive to relative performance metrics, or engage in dynamic hedging to offset losses from option selling and other return-enhancing practices. To the extent that investor reactions amplify market disruptions, longer maturities may introduce new vulnerabilities with the potential to affect the availability and cost of finance. These issues are examined in more detail in Miyajima and Shim (2014).
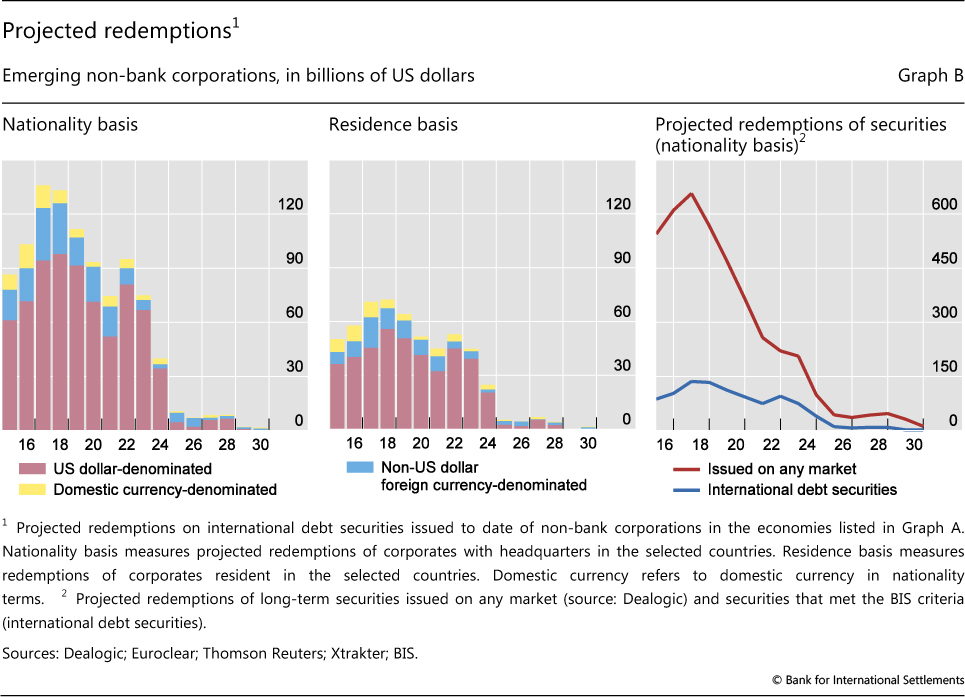
The projected redemption schedules for EME non-bank corporates based on international debt securities issued to date indicate that redemptions will peak in 2017-18. For international debt securities, redemptions in US dollars take the lion's share (Graph B, left-hand and centre panels).
This represents a potential vulnerability. Many emerging market borrowers, such as commodity exporters, will have US dollar cash flow to offset coupon payments, as detailed in Chui et al (2014). Nevertheless, currency hedging of principal redemptions may be incomplete even for such borrowers. To the extent that market disruptions are made worse by duration risk, lengthening maturities may have the perverse effect of exacerbating rollover problems if the US dollar debt securities market shuts down in a distress episode. It should be remembered that the dollar market for emerging market issuers all but closed between September and October in 2008 and in January 2009, and again for several weeks in mid-2013.
International debt securities constitute around 20% of total debt securities in terms of amounts outstanding. ,
,  Graph B (right-hand panel) shows the projected redemptions of international debt securities relative to redemptions of all debt securities, including domestic issuance. Domestic debt securities are denominated mainly in the domestic currency, eliminating the immediate risk from currency mismatch. However, as international investors have ventured further into the market for domestic debt securities, even this market may not be immune to disruptions arising from exits by global investors.
While solvency is less of a problem with non-leveraged investors, the broader macroeconomic impact of capital market disruptions may impose significant costs on the economy through slower growth and tighter financial conditions. For these reasons, recent trends in the debt securities market and the changing pattern of credit intermediation merit attention from policymakers.
M Chui, I Fender and V Sushko, "Risks related to EME corporate balance sheets: the role of leverage and currency mismatch", BIS Quarterly Review, September 2014, pp 35-47. The BIS classifies a debt security as international (IDS) if any one of the following characteristics is different from the country of residence of the issuer: country where the security is registered, law governing the issue, or market where the issue is listed. All other securities are classified as domestic (DDS). See B Gruić and P Wooldridge, "Enhancements to the BIS debt securities statistics", BIS Quarterly Review, December 2012, pp 63-76. K Miyajima and I Shim, "Asset managers in emerging market economies", BIS Quarterly Review, September 2014, pp 19-33. Investments in debt securities by non-residents account for roughly one quarter of the stock of global debt securities, with domestic investors accounting for the remaining 75%. See B Gruić and A Schrimpf, "Cross-border investments in global debt markets since the crisis", BIS Quarterly Review, March 2014, pp 18-19. For the economies listed, share of outstanding IDS by residence at end-2013 was around 1% in long-term series on credit to the private non-financial sector. See C Dembiermont, M Drehmann and S Muksakunratana, "How much does the private sector really borrow - a new database for total credit to the private non-financial sector", BIS Quarterly Review, March 2013, pp 65-81. It is reasonable to assume that large non-financial corporates in the economies tap international debt securities market.
1 This article was prepared by Stefan Avdjiev (stefan.avdjiev@bis.org). Statistical support was provided by Sebastian Goerlich.
2 Annual percentage changes are calculated as the sum of exchange rate- and break-adjusted changes over the preceding four quarters divided by the amount outstanding one year earlier.
3 The locational banking statistics are structured according to the location of banking offices and capture the activity of all internationally active banking offices in the reporting country regardless of the nationality of the parent bank. Banks record their positions on an unconsolidated basis, including those vis-à-vis their own offices in other countries.
4 The consolidated banking statistics are structured according to the nationality of reporting banks and are reported on a worldwide consolidated basis, ie excluding positions between affiliates of the same banking group. Banks consolidate their inter-office positions and report only their claims on unrelated borrowers.
5 For an analysis of the main drivers in the deceleration in cross-border bank lending to emerging market economies (EMEs) during the 2013 taper tantrum using data from the Stage 1 enhanced BIS international banking statistics, see S Avdjiev and E Takáts, "Cross-border bank lending during the taper tantrum: the role of emerging market fundamentals", BIS Quarterly Review, September 2014, pp 49-60.
6 A list of countries in the BIS reporting area is available on the BIS website: www.bis.org/statistics/rep_countries.htm. China does not report international banking statistics to the BIS. However, the locational statistics and consolidated statistics on an immediate borrower basis capture the positions of Chinese and other banks headquartered outside the BIS reporting area to the extent that these positions are booked through offices in a BIS reporting country.
7 See P McGuire and A Van Rixtel, "Shifting credit patterns in emerging Asia", BIS Quarterly Review, December 2012, pp 17-18.
8 Foreign claims comprise cross-border claims and local claims, where local claims refer to credit extended by foreign banks' affiliates located in the same country as the borrower. BIS reporting banks' local claims on China denominated in renminbi totalled $235 billion at end-March 2014.
9 For the outstanding stocks of foreign claims on Russia and Ukraine at end-2013, broken down by the nationality of the lending bank, see Graph 2 in Bank for International Settlements, "Highlights of the BIS international statistics", BIS Quarterly Review, June 2014, pp 1-11.
10 The depreciation of a currency against the US dollar results in a decline in the reported US dollar value of the outstanding stock of claims denominated in that currency.