Highlights of the BIS international statistics
The BIS, in cooperation with central banks and monetary authorities worldwide, compiles and disseminates several data sets on activity in international banking and financial markets. This chapter summarises the latest data for the international banking and OTC derivatives markets, available up to the end of 2013.1
The cross-border claims of BIS reporting banks contracted for a seventh consecutive quarter between end-September and end-December 2013. Nevertheless, the pace of decline was slower than in the preceding two quarters. Claims on banking offices as well as non-bank entities fell. Euro-denominated claims contracted substantially. By contrast, cross-border lending in US dollars and in Japanese yen expanded. Boosted by strong growth in lending to China, cross-border claims on emerging Asia continued their steady expansion.
OTC derivatives markets continued to expand in the second half of 2013. Increases in notional amounts were driven by interest rate derivatives, especially contracts with a medium- to long-term maturity. In credit default swap (CDS) markets, central clearing and netting made further inroads.
The international banking market in the fourth quarter of 20132
Between end-September and end-December 2013, cross- border bank lending shrank for a seventh consecutive quarter. The $122 billion (0.4%) drop brought the size of the aggregate decline since end-March 2012 to $2.4 trillion, or 7.8%. Nevertheless, the latest contraction was considerably smaller than those in the preceding two quarters, which averaged $520 billion (1.7%).
Cross-border credit to banking offices as well as non-bank borrowers fell. Interbank claims, which in the locational banking statistics3 capture positions with related offices as well as unrelated banks, declined by $38 billion (0.2%). Cross-border lending to non-banks, which mainly include non-bank financial institutions, governments and corporations, also contracted (by $85 billion or 0.7%) during the last three months of 2013.
Euro-denominated cross-border claims
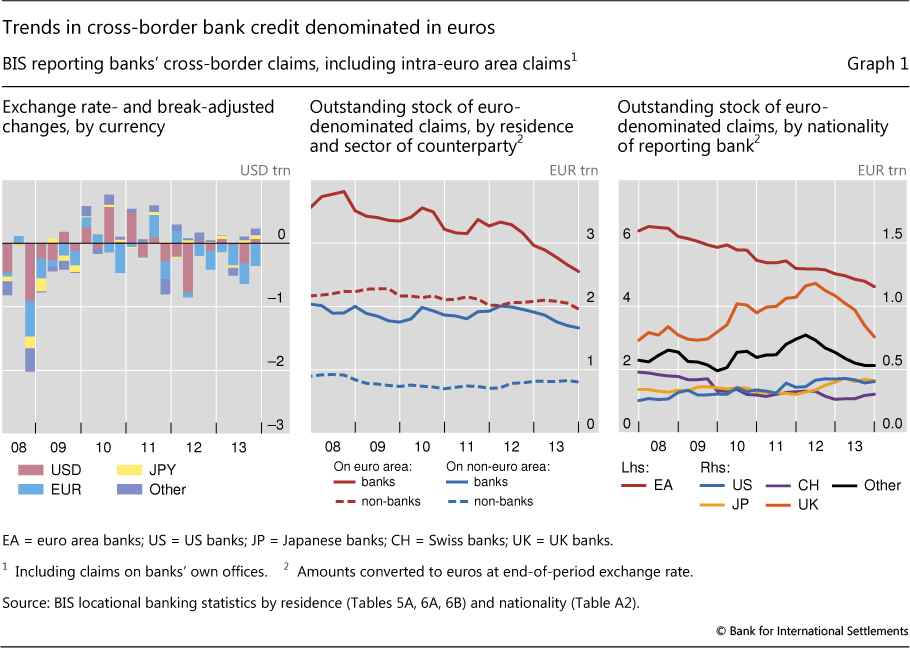
The aggregate fall in cross-border claims in the fourth quarter of 2013 was more than accounted for by a $355 billion (3.6%) contraction in euro-denominated claims (Graph 1, left-hand panel). By contrast, claims in US dollars and in Japanese yen grew by $64 billion (0.5%) and by $61 billion (5.2%), respectively.
The sharp fall in euro-denominated cross-border claims during the fourth quarter of 2013 is part of a broader trend observed over the past several years. The outstanding stock of euro cross-border bank lending - including intra-euro area lending - has shrunk by €1.9 trillion (21%) since end-March 2008. The contraction in euro-denominated cross-border lending accounted for nearly two thirds of the overall reduction in the stock of cross-border claims (measured in US dollars) during the same period.4
The decline in euro-denominated cross-border claims between end-March 2008 and end-December 2013 was distributed widely across borrowing countries and sectors (Graph 1, centre panel). Claims on banking offices located inside the euro area contracted by €1.2 trillion (32%) over the 2008-13 period, and those on non-bank borrowers in the euro area declined by €220 billion (10%).5 Cross-border lending in euros to borrowers located outside the euro area shrank noticeably as well: by €352 billion (17%) vis-à-vis banking offices and €111 billion (12%) vis-à-vis non- banks. In 2013, euro lending to euro area banks continued to decline, whereas that to non-banks outside the euro area remained more or less stable.
The locational banking statistics by nationality can be used to investigate which banking systems were responsible for the contraction in euro-denominated cross-border claims. The €1.9 trillion (29%) fall reported by the offices of euro area banks accounted for the overwhelming majority of the overall decline that took place between end-March 2008 and end-December 2013 (Graph 1, right-hand panel). Euro-denominated cross-border lending by the offices of Swiss banks also shrank significantly (by €169 billion or 36%). By contrast, US and Japanese banks reported increases in the same category, of €134 billion (50%) and €71 billion (21%), respectively. The euro- denominated cross-border claims of UK banks, which had grown rapidly between end-March 2008 and end-June 2012 (by €389 billion or 49%), fell sharply between mid-2012 and end-2013 (by €423 billion or 36%).
Credit to emerging market economies
Cross-border lending to emerging market economies grew by $91 billion (2.5%) between end-September and end- December 2013. The aggregate number masks a substantial divergence between emerging market regions. Boosted by strong growth in lending to China, cross-border claims on emerging Asia continued their steady expansion in the fourth quarter of 2013 ($115 billion or 6.4%). Cross-border credit to Latin America also expanded, but at a much slower pace ($6.4 billion or 1.0%). By contrast, claims on emerging Europe and on Africa and the Middle East declined (by $9.7 billion, or 1.3%, and by $20 billion, or 4.2%, respectively).
As in previous quarters, the latest quarterly increase in cross-border bank lending to emerging Asia was driven mainly by strong growth in claims on China ($81 billion or 9.0%). The consolidated banking statistics6 indicate that the recent robust growth in international bank lending to China was fuelled primarily by short-term lending. The share of international claims on China with a remaining maturity of less than one year rose from 56% at end-2007 to 76% at end-2010, and 79% at end-2013.
Cross-border claims on the rest of emerging Asia increased by $34 billion (3.9%) between end-September and end-December 2013. Claims on Indonesia rose by $4.1 billion (5.2%). By contrast, cross-border lending to Korea contracted by $3.0 billion (1.6%). In the meantime, cross-border claims on India remained virtually unchanged in the fourth quarter of 2013, in contrast to the two previous quarters of declines.
Cross-border lending to Latin America and the Caribbean also expanded. However, the increase represents only a partial reversal of the sizeable reductions observed in the second and third quarters of 2013.7 Cross-border lending to Mexico grew by $8.9 billion (7.8%) in the fourth quarter. By contrast, cross-border claims on Brazil fell by $4.0 billion (1.3%). The consolidated banking statistics reveal that the overall expansion in cross-border credit to Latin America and the Caribbean occurred despite a fall in foreign lending to the region by US banks, whose share of foreign claims on the region declined from 21% at end-September 2013 to 20% at end- December 2013. By contrast, the share of Spanish banks' foreign claims, which are predominantly booked by their affiliates in the respective borrowing countries and thus tend to be financed locally, rose from 39% to 41% during the same period.
Cross-border claims on emerging Europe continued to fall in the fourth quarter of 2013. Developments in the region were dominated by a sizeable contraction in lending to Russia ($11 billion or 6.0%). In the rest of the region, the picture was mixed. Claims on Turkey and Poland increased by $3.0 billion (1.6%) and $0.9 billion (0.7%), respectively. By contrast, lending to Hungary dropped by $2.4 billion (5.4%).
The consolidated banking statistics indicate that, at end-December 2013, on the eve of the recent tensions in Ukraine, BIS reporting banks' foreign claims (which comprise cross-border claims and claims booked by local affiliates) on Russia stood at $241 billion on an immediate borrower basis and $218 billion on an ultimate risk basis.8 French ($49 billion on an ultimate risk basis), US ($32 billion) and Italian ($29 billion) banks reported the largest outstanding stocks of foreign claims on Russia (Graph 2, left-hand panel). Cross-border claims accounted for the majority of US banks' foreign claims on the country. By contrast, most of the foreign claims of French and Italian banks on Russian residents consisted of local claims booked by these banks' Russian affiliates. Such claims are to a large extent funded locally.
In addition to the foreign claims discussed above, BIS reporting banks had other potential exposures - comprising derivatives contracts, guarantees extended and credit commitments - to residents of Russia totalling $151 billion. The majority ($125 billion) of these exposures were in the form of guarantees extended, which primarily cover the contingent liabilities of CDS protection sellers (at notional values).9 Importantly, such CDS-related contingent liabilities are usually reported on a gross basis, without taking account of netting agreements or collateral. They thus represent a ceiling on banks' CDS-related exposures to a given country.
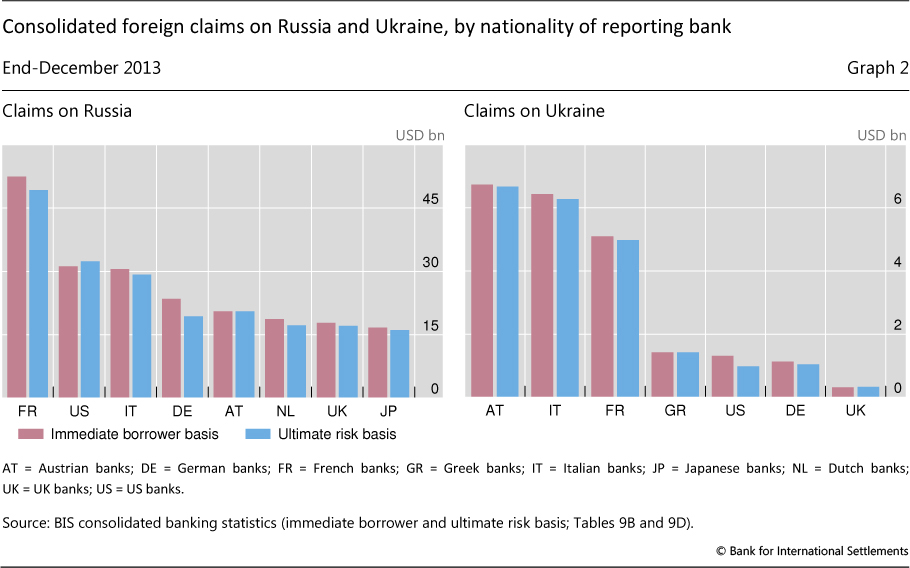
In US dollar terms, the foreign exposures of internationally active banks to Ukraine were much smaller than those to Russia. At end-December 2013, foreign claims equalled $27 billion on an immediate borrower basis and $24 billion on an ultimate risk basis. European banks accounted for more than 90% of all foreign claims on the country (Graph 2, right-hand panel). The majority ($15 billion) of the foreign claims (on an ultimate risk basis) on Ukraine comprised the local claims of foreign banks' Ukrainian affiliates. BIS reporting banks' other potential exposures to Ukraine totalled a further $19 billion.
The OTC derivatives market in the second half of 2013
The over-the- counter derivatives market continued to expand in the second half of 2013. The notional amount of outstanding OTC derivatives contracts, which determines contractual payments and is an indicator of activity in OTC derivatives markets, totalled $710 trillion at end-December 2013. This compares with $693 trillion at end-June 2013 and $633 trillion at end-2012 (Graph 3, left-hand panel). Adjusted for exchange rate movements, notional amounts at end-2013 were about 1% higher than at end-June 2013 and 13% higher than at end-2012.10
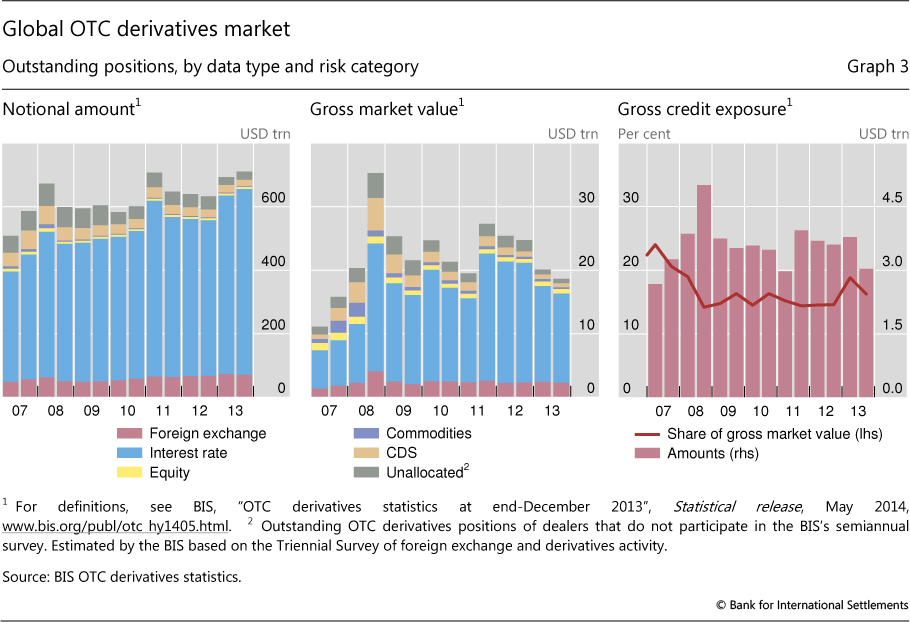
Notwithstanding the increase in notional amounts, the market value of outstanding derivatives contracts declined, based on market prices at end-December 2013. The gross market value of all contracts - that is, the cost of replacing all outstanding contracts at market prices prevailing on the reporting date - stood at $19 trillion at end-December 2013. This is down from $20 trillion at end-June 2013 and $25 trillion at end-2012 (Graph 3, centre panel).
The gross market value represents the maximum loss that market participants would incur if all counterparties failed to meet their contractual payments and the contracts could be replaced at current market prices.11 Market participants can reduce their exposure to counterparty credit risk through netting agreements and collateral. Gross credit exposures adjust gross market values for legally enforceable bilateral netting agreements but do not take account of collateral. Gross credit exposures equalled $3.0 trillion at end-December 2013, down from $3.8 trillion at end-June 2013 (Graph 3, right-hand panel). This represented 16.3% of gross market values at end-December 2013, slightly higher than the 2009-12 average of 15.1%.
Interest rate derivatives
The interest rate segment accounts for the majority of OTC derivatives activity. For single currency interest rate derivatives at end-December 2013, the notional amount of outstanding contracts totalled $584 trillion, which represented 82% of the global OTC derivatives market. At $461 trillion, swaps account for by far the largest share of outstanding interest rate derivatives.
The recent trend in the global market of increasing notional amounts but declining market values was driven by developments in the interest rate segment. Even as notional amounts rose, the gross market value of interest rate derivatives declined to $14 trillion at end-2013, from $15 trillion at end-June 2013 and its most recent peak of $20 trillion at end-2011. Such declines were reported for interest rate derivatives denominated in most of the major currencies (Graph 4, left-hand panel). Long-term bond yields and swap rates in these currencies rose in mid-2013 after announcements in May that the US Federal Reserve envisaged phasing out quantitative easing.12 The decline in the gross market value of interest rate derivatives over this period appears consistent with the bond market sell-off narrowing the gap between market interest rates on the reporting date and the rates prevailing at contract inception.13
Increases in the notional amount of interest rate derivatives were concentrated in the medium- and long-term segments. The notional amount of contracts with a remaining maturity of one to five years rose to $234 trillion at end-2013 from $180 trillion one year earlier, or to 40% of all maturities outstanding from 37% (Graph 4, centre panel). The notional amount of contracts with a remaining maturity greater than five years rose to $152 trillion from $119 trillion over the same period, or to 26% of all maturities from 24%. The increased activity in the medium- and long-term segments may have reflected investors' changing expectations about the persistence of low policy rates and large-scale asset purchases by central banks over the medium term.14
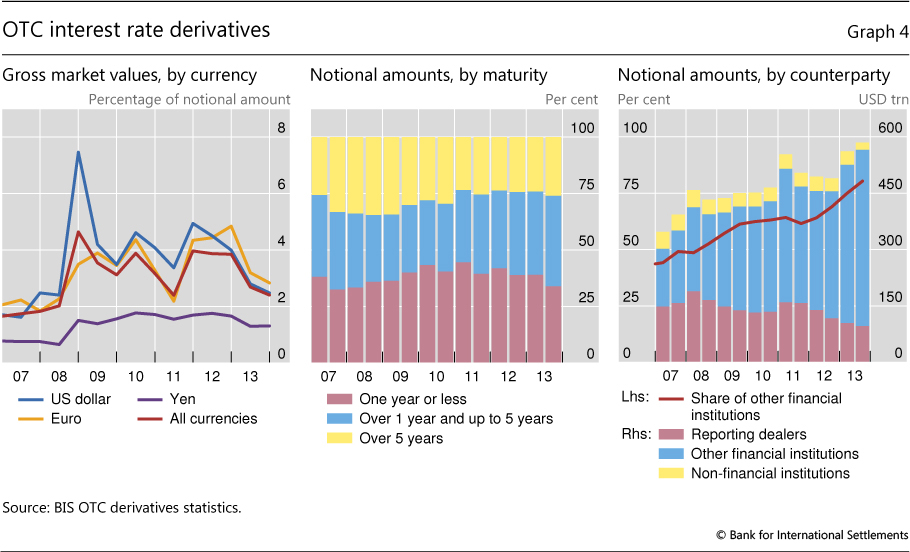
The distribution of interest rate derivatives by counterparty points to a continued shift in activity towards financial institutions other than dealers, including central counterparties (CCPs).15 The notional amount of interest rate contracts between derivatives dealers has been falling steadily since 2011, to $96 trillion at end-2013 compared with the (post-2008) peak of $159 trillion at end-June 2011 (Graph 4, right-hand panel). Contracts between dealers and other financial institutions stood at $470 trillion at end-2013, or 80% of all contracts, up from $355 trillion, or 64%, at end-June 2011. The shift towards central clearing exaggerates the growth in notional amounts for other financial institutions because, when contracts are cleared through CCPs, one trade becomes two outstanding contracts.16
Foreign exchange derivatives
Foreign exchange derivatives make up the second largest segment of the global OTC derivatives market. At end-December 2013, the notional amount of outstanding foreign exchange contracts totalled $71 trillion, which represented 10% of OTC derivatives activity.
The latest data show little change in the instrument composition of foreign exchange derivatives. Forwards and foreign exchange swaps accounted for close to half of the notional amount outstanding. However, currency swaps - which typically have a longer maturity than other foreign exchange derivatives and thus are more sensitive to changes in market prices - accounted for the largest proportion of the gross market value.
In contrast to the interest rate derivatives market, in the foreign exchange derivatives market inter-dealer contracts continued to account for nearly as much activity as contracts with other financial institutions. The notional amount of outstanding foreign exchange contracts between reporting dealers totalled $31 trillion at end-December 2013, and contracts with financial counterparties other than dealers about the same amount. The inter-dealer share has averaged around 43% since 2011, up from less than 40% prior to 2011. Inter-dealer activity is especially significant in the yen and US dollar markets, where it accounted for 52% and 47%, respectively, of notional amounts at end-December 2013. Among instruments, inter-dealer activity accounts for a greater share of more complex contracts, such as currency swaps (54% of notional amounts) and options (49%).
While the importance of inter-dealer activity differs in the BIS's two surveys of derivatives activity - the semiannual survey of outstanding positions, on which the information in this section is based, and the Triennial Survey of turnover - this mainly reflects differences in the structure of the surveys. The 2013 Triennial Survey pointed to other financial institutions, including smaller banks, institutional investors and hedge funds, as the main drivers of rising trading volumes in foreign exchange markets.17 This development appears to reflect trading in simpler instruments with shorter maturities, such as spot and forward transactions. The OTC derivatives statistics on outstanding contracts suggest that the major dealers continue to dominate activity in more complex, longer-term instruments, such as currency swaps. Indeed, in the foreign exchange derivatives market, inter-dealer activity accounted for 58% of notional amounts for contracts with a remaining maturity of more than five years, compared with only 40% of contracts with a maturity of one year or less. In addition, whereas outstanding positions (in the OTC derivatives statistics) are reported by dealers on a globally consolidated basis, turnover data (in the Triennial Survey) are reported by sales desks and include transactions between affiliates of the same reporting institution.
Credit default swaps
In 2007, credit derivatives came close to surpassing foreign exchange derivatives as the second largest segment in the global OTC derivatives market, but notional amounts have since declined steadily. Notional amounts of CDS fell to $21 trillion at end-2013 from $29 trillion at end-2011 and a peak of $58 trillion at end-2007 (Graph 5, left-hand panel). The gross market value of CDS fell to $0.7 trillion at end-2013, from $1.6 trillion at end-2011 (Graph 5, centre panel). The net market value fell to $139 billion from $417 billion over the same period. This net measure takes account of bilateral netting agreements covering CDS contracts but, unlike gross credit exposures, is not adjusted for cross-product netting.
The decline in overall CDS activity was driven mainly by a contraction in inter-dealer activity. The notional amount for contracts between reporting dealers fell to $11 trillion at end-December 2013 from $14 trillion at end-2012. Notional amounts with banks and securities firms also fell, to less than $2 trillion from $3 trillion over the same period. Trade compression continued to eliminate redundant contracts, although the volume of compressions has slowed from the peaks of 2008-09.18
Central clearing made further inroads in the CDS market in 2013. Central clearing is a key element in global regulators' agenda for reforming OTC derivatives markets to reduce systemic risks. The shift towards central clearing made significant progress in 2010-11, when the share of outstanding contracts cleared through CCPs rose from less than 10% to 19% (Graph 5, right-hand panel). However, in 2012 progress stalled, with the share stagnating at 19%. Then, in 2013, contracts with CCPs resumed their rise, to account for 26% of all CDS contracts at year-end. The share of CCPs is highest for multi-name products, at 37%, and much lower for single-name products, at 17%. Contracts on CDS indices in the multi-name segment tend to be more standardised than those in the single-name segment, which thus makes the former more amenable to central clearing.
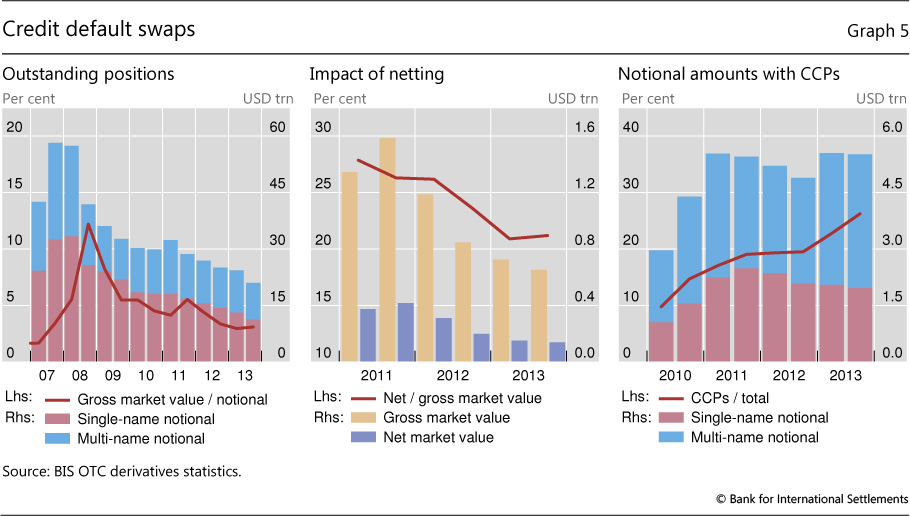
Owing in part to the shift towards central clearing, the CDS market has seen an increase in netting. Netting enables market participants to reduce their counterparty exposure by offsetting contracts with negative market value against contracts with positive market value. A comparison of net market value with gross market value indicates the prevalence of legally enforceable bilateral netting agreements. Owing to the increased use of such agreements, net market value as a percentage of gross market value fell to 21% at end-2013 from 24% at end-2012 and 26% at end-2011 (Graph 5, centre panel). The prevalence of netting is greatest for CDS contracts with CCPs and other dealers, where it reduced the ratio of net to gross market value to 9% and 15%, respectively, at end-2013. It is lowest for those with insurance companies (83%) and special purpose vehicles (57%).
The distribution of underlying reference entities indicates that contracts referencing non-financial firms have declined at a somewhat more rapid pace than those referencing other sectors. Outstanding CDS contracts referencing non- financial firms stood at $7 trillion at end-December 2013, representing 34% of all CDS. This is down from 37% at end-2012 and 40% at end-2011 (when this breakdown was first reported). Contracts referencing financial firms stood at $6 trillion at end- 2013, followed by securitised products and multiple sectors at $5 trillion, and sovereigns at less than $3 trillion. By rating, contracts referencing investment grade entities equalled $13 trillion and those referencing lower-rated or unrated entities $8 trillion.
Equity-linked and commodity derivatives
The notional amount of OTC derivatives linked to equities or commodities totalled $9 trillion at end-December 2013, and the gross market value $1 trillion. Activity in equity-linked contracts declined precipitously in 2008-09 but has since fluctuated around levels similar to the notional amount reported at end-December 2013, $6.6 trillion.
By contrast, activity in commodity contracts continues to decline. While dealers expanded their commodity derivatives business rapidly between 2004 and 2008, they have since scaled back their outstanding positions. The notional amount of outstanding OTC commodity derivatives contracts declined to $2.2 trillion at end-2013 from $2.9 trillion at end-2009 and a peak of $8.5 trillion at end-2007.
1 This article was prepared by Stefan Avdjiev (stefan.avdjiev@bis.org) for the banking section and Philip Wooldridge (philip.wooldridge@bis.org) for the derivatives section. Statistical support was provided by Pablo García-Luna, Sebastian Goerlich and Jeff Slee (banking) and Denis Pêtre (derivatives).
2 The international banking statistics at end-December 2013, especially the consolidated banking statistics on an ultimate risk basis, are affected by methodological changes related to the implementation of enhancements recommended by the Committee on the Global Financial System. Significant breaks in the latest data are explained in BIS, "BIS international banking statistics at end-December 2013", Statistical release, April 2014, www.bis.org/statistics/rppb1404.htm.
3 The locational banking statistics are structured by the location of banking offices and capture the activity of all internationally active banking offices in the reporting country regardless of the nationality of the parent bank. Banks record their positions on an unconsolidated basis, including those vis-à-vis their own offices in other countries.
4 Owing to exchange rate movements, a simple comparison of changes in amounts outstanding over this period exaggerates the contribution of the euro to the overall reduction in cross- border claims. The 13% depreciation of the euro against the US dollar between end-March 2008 and end-December 2013 resulted in a decline in the reported US dollar value of outstanding euro-denominated claims. That said, even adjusted for exchange rate movements, the euro accounted for the majority of the overall contraction in lending.
5 For an analysis of the recent decline in international interbank activity in the euro area, see P García-Luna and A van Rixtel, "International interbank activity in retreat", BIS Quarterly Review, March 2014, pp 14-15, www.bis.org/publ/qtrpdf/r_qt1403b.htm.
6 The consolidated banking statistics are structured by the nationality of reporting banks and are reported on a worldwide consolidated basis, ie excluding positions between affiliates of the same banking group. Banks consolidate their inter-office positions and report only their claims on unrelated borrowers.
7 For an analysis of the effect of Fed tapering on cross-border bank flows to Latin America and the Caribbean, see P García-Luna and A van Rixtel, "Emerging markets and talk of tapering", BIS Quarterly Review, December 2013, pp 16-17, www.bis.org/publ/qtrpdf/r_qt1312b.htm.
8 The consolidated banking statistics are reported on both an ultimate risk and an immediate borrower basis. The ultimate risk statistics are adjusted for credit risk mitigants, such as guarantees and collateral, which transfer risk between countries and sectors, while the immediate borrower statistics are not. For an explanation of the differences between the statistics, see S Avdjiev, "What the BIS banking statistics say (and what they do not) about banking systems' exposures to particular countries and sectors", BIS Quarterly Review, March 2011, pp 16-17, www.bis.org/publ/qtrpdf/r_qt1103w.htm.
9 For further explanation, see S Avdjiev, "Exploring the relationship between 'guarantees extended' and CDS sold", BIS Quarterly Review, September 2011, p 22, www.bis.org/publ/qtrpdf/r_qt1109v.htm.
10 The appreciation of the euro and pound sterling against the US dollar between end-June 2013 and end-December 2013 resulted in an increase in the US dollar value of outstanding contracts denominated in euros and sterling. Conversely, the depreciation of the Japanese yen against the US dollar resulted in a decline in the US dollar value of yen-denominated contracts.
11 The gross market value is calculated as the sum of the absolute value of gross positive market values and gross negative market values. The gross positive market value is the gain to derivatives dealers - and the gross negative market value the loss - if the dealers were to sell their outstanding contracts at market prices prevailing on the reporting date.
12 See BIS, "Markets precipitate tightening", BIS Quarterly Review, September 2013, pp 1-11, www.bis.org/publ/qtrpdf/r_qt1309a.htm.
13 At the inception of an interest rate swap contract, the market value is zero, ie the expected value of fixed interest rate cash flows over the life of the swap is equal to the expected value of floating interest rate cash flows.
14 See BIS, "Low rates spur credit markets as banks lose ground", BIS Quarterly Review, December 2013, pp 1-12, www.bis.org/publ/qtrpdf/r_qt1312a.htm.
15 The latest data show a sharp drop in the notional amount reported for interest rate contracts with non-financial customers. This drop is explained by one dealer's reclassification of contracts with central counterparties, which it had previously incorrectly reported against non-financial customers but, starting in December 2013, reported against other financial institutions.
16 See N Vause, "Central clearing and OTC derivatives statistics", BIS Quarterly Review, June 2011, p 26, www.bis.org/publ/qtrpdf/r_qt1106x.htm.
17 See D Rime and A Schrimpf, "The anatomy of the global FX market through the lens of the 2013 Triennial Survey", BIS Quarterly Review, December 2013, pp 27-43, www.bis.org/publ/qtrpdf/r_qt1312e.htm.
18 Compression is a process for tearing up trades, which enables economically redundant derivative trades to be terminated early without changing the net position of each participant. For statistics on multilateral compressions of CDS contracts, see TriOptima, www.trioptima.com/resource- center/statistics/triReduce.html.