Highlights of the BIS international statistics
BIS reporting banks reduced their cross-border claims in the second quarter of 2013, in particular claims on non-bank borrowers, which registered the largest decline since end-2011. Gross credit exposures in the OTC derivatives market increased despite a sizeable fall in market values. This chapter contains three boxes. The first analyses the impact on cross-border credit to emerging market economies of announcements in May that the Federal Reserve envisaged phasing out large-scale asset purchases. The second analyses the issuance of international bonds denominated in emerging market currencies. The third updates previous estimates of the relationship between FX turnover and countries' current account transactions and income levels using data from the most recent BIS Triennial Survey.1
During the second quarter of 2013, the cross-border claims of BIS reporting banks declined, after remaining stable in the previous quarter. A sizeable reduction in cross-border claims on borrowers in advanced economies and, to a lesser extent, offshore centres was only partly offset by a slight increase in cross-border credit to emerging market borrowers. That said, the small overall increase in lending to emerging markets hides significant variations across countries. Announcements by the Federal Reserve on the prospective "tapering" of large-scale asset purchases coincided with sharp drops in cross-border credit to some of the largest emerging market economies, such as Brazil, India, Russia and South-Africa. In contrast to developments in previous quarters, BIS reporters cut their cross-border lending to all sectors. Previously, lower claims on banks had gone hand in hand with higher lending to non-banks.
The international banking market in the second quarter of 2013
The cross-border claims of BIS reporting banks fell by $515 billion (1.8%) between end-March and end-June 2013 (Graph 1, top left-hand panel).2 As a result, total outstanding cross-border credit stood at $28.3 trillion at end-June 2013, 1.2% lower than in the same quarter one year earlier. Cross-border claims fell in all major currency denominations, with large declines in claims in euros ($315 billion or 3.2%), Swiss francs ($48 billion or 11%) and Japanese yen ($43 billion or 3.5%) (Graph 1, top right-hand panel).
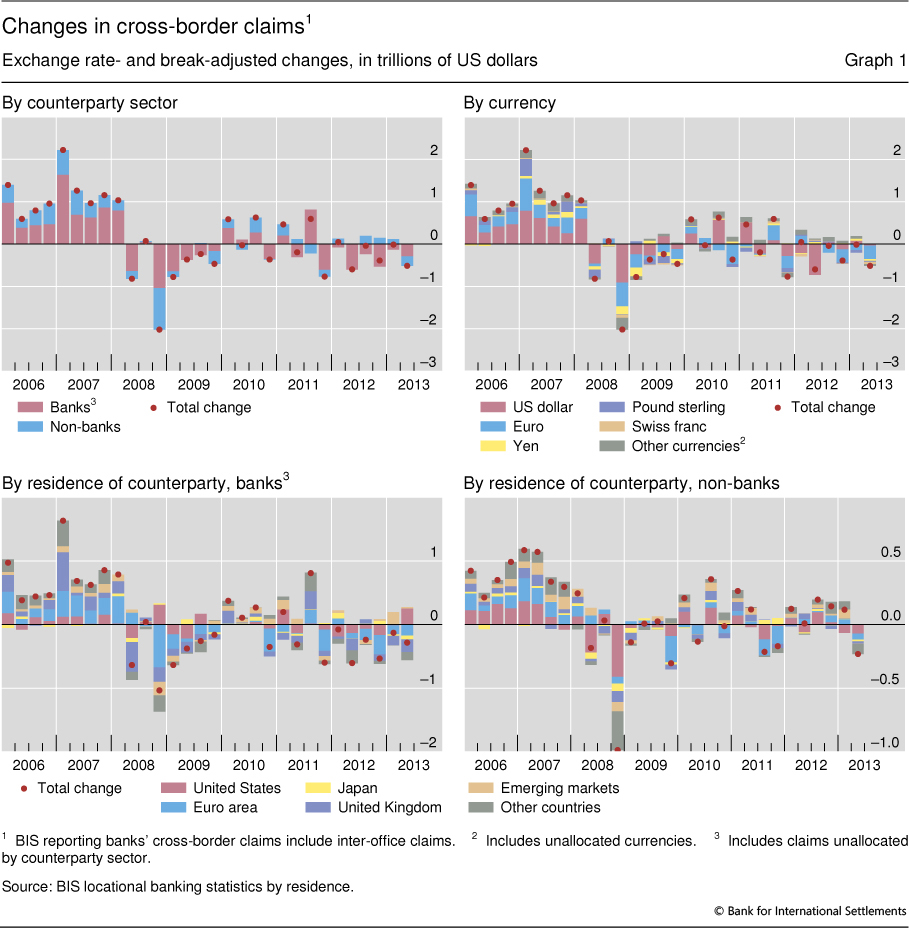
The second quarter of 2013 saw the first substantial decline in banks' cross-border claims on non-bank borrowers since end-2011. Claims on these borrowers - comprising non-bank financial institutions, governments and corporations - fell by $231 billion or 2.0% (Graph 1, top left-hand panel), to $11.4 trillion. The reduction mostly affected non-banks resident in advanced economies, although claims on non-banks in other countries (primarily offshore centres) declined as well (Graph 1, bottom right-hand panel).
Cross-border interbank claims, including claims on related offices, also contracted during the quarter, falling by $285 billion (1.7%), to $16.8 trillion (Graph 1, bottom left-hand panel). This extended a trend evident since the fourth quarter of 2011.
Cross-border credit developments differed across regions. Claims on advanced economies fell by $470 billion (2.2%), accounting for 91% of the total global decline in cross-border lending. Claims on offshore centres declined by $70 billion (1.9%). In contrast, cross-border claims on emerging market economies increased modestly by $23 billion (0.7%).
Credit to advanced economies
Claims on non-bank borrowers in advanced economies decreased by $181 billion (2.2%) in the second quarter of 2013. This was the first major reduction in positions on non-banks since end-2011, and it almost reversed the cumulative increase in 2012. The decline was widespread, affecting especially non-bank borrowers in the United States, the euro area, the United Kingdom, Japan and Switzerland.
The consolidated banking statistics3 provide more detail on the types of non-bank borrowers affected. A drop in claims on the public sector, especially those of the United States and Japan, was a key driver of this contraction. The share of public sector claims in total consolidated international claims4 on US borrowers fell to 22% at end-June 2013, from a high of 25% at end-2012. The corresponding share for Japan declined to 6.7% at end-June 2013, from 9.3% at end-2012. By contrast, the share of the public sector in claims on the euro area was stable at around 19%.
Claims on banks in advanced economies continued to fall, albeit at a somewhat slower pace, declining by $289 billion (2.2%) in the second quarter of 2013. The continued retreat in international interbank activity was concentrated on banks in the United Kingdom (-$198 billion or 5.9%) and the euro area (-$170 billion or 3.4%) (Graph 1, bottom left-hand panel). Claims on banks in Japan and Switzerland declined as well. Banks in the United States proved an exception to the generalised contraction, with new claims on the sector amounting to $250 billion (+11%). About half of the reduction in interbank positions of banks headquartered in advanced economies was due to a drop in claims on related offices.5
Box 1
Emerging markets and talk of tapering
Pablo García Luna and Adrian van Rixtel
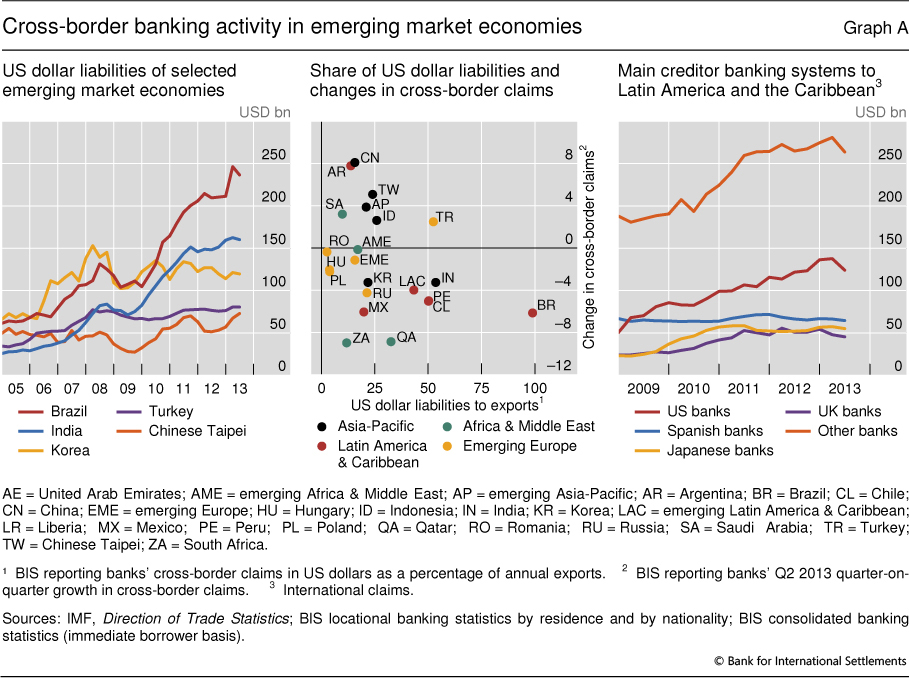
The accommodative monetary policy stance in advanced economies in the wake of the global financial crisis boosted capital flows to fast-growing emerging market economies and put upward pressure on their currencies. This contributed to a build-up of financial imbalances, reflected in surging credit and asset prices. International bank lending to these economies picked up markedly. The volume of foreign banks' US dollar-denominated credit to emerging market economies grew rapidly, especially during 2010-11. But this masked considerable variation across countries (Graph A, left-hand panel). US dollar-denominated liabilities of Brazil and India more than doubled from early 2009 to end-June 2013, to $237 billion and $160 billion, respectively. For Turkey and South-Korea, the growth of US dollar-denominated borrowing during the same period was more moderate.
A tightening of US monetary policy and higher US interest rates will raise the refinancing costs of US dollar-denominated debt. Moreover, possible related upward pressures on the US dollar will increase the value of this debt in local currencies. Emerging market economies with relatively low US dollar liabilities in terms of their exports, which generate foreign currency, may be affected less. These effects may also be relevant for liabilities denominated in other foreign currencies, as increases in US interest rates may be associated with higher rates in other advanced economies. At the same time, the channels are the most direct for liabilities denominated in US dollars. This box considers how cross-border credit to economies with relatively large US dollar liability exposures was affected by announcements of a "tapering" of large-scale asset purchases in May 2013.
The BIS locational banking statistics, which include inter-office activity, show that cross-border credit to a large number of emerging market economies with sizeable US dollar-denominated liabilities fell in the second quarter of 2013 (Graph A, centre panel). Those most affected were located predominantly in Latin America. The drop was largest for Brazil (with a ratio of US dollar liabilities to exports of 99%), but was also quite sharp for Chile (50%), Mexico (20%) and Peru (50%). In other regions, claims on India and Russia contracted as well. In contrast, cross-border credit to Turkey (52%) and several emerging Asian countries increased, most notably to Chinese Taipei and Indonesia.
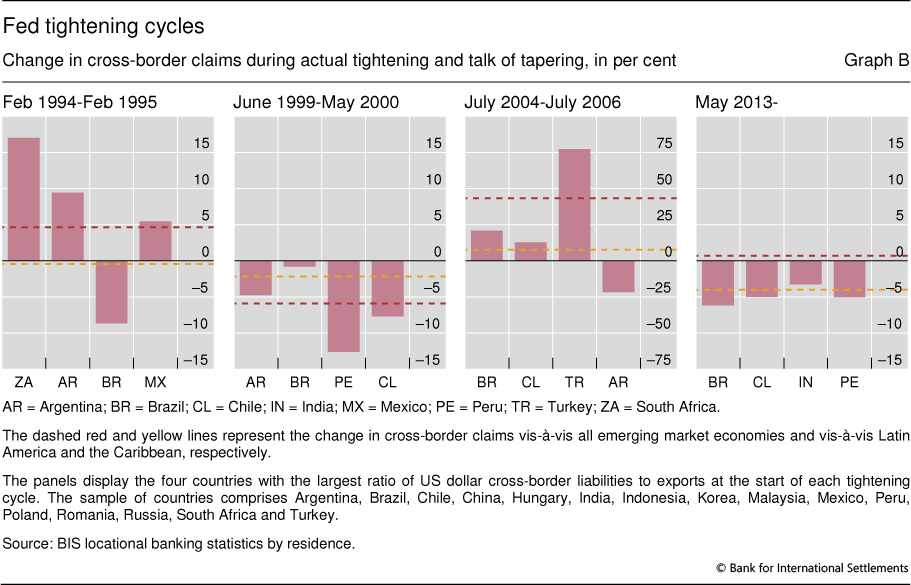
But the observation that countries with relatively large US dollar-denominated liabilities, especially those in Latin America, were strongly affected by talk about tapering is not new: something similar happened during previous Fed tightening cycles. Graph B shows the change in cross-border credit to the four emerging market economies with the largest ratio of US dollar-denominated liabilities to exports at the start of the four most recent cycles of US monetary policy tightening. These countries, which are drawn from a group of 16 main emerging market economies, are chiefly from Latin America. The growth of cross-border credit to the selected Latin American countries was considerably lower than that of claims on all emerging market economies during the 2004-06 cycle. In the second quarter of 2013 the difference was even more pronounced. Furthermore, during three of the four episodes, cross-border claims on Latin America and the Caribbean (Graph B, dashed yellow line) displayed a considerably lower growth than those on all emerging market economies (Graph B, dashed red line). The only exception was 1999-2000, when cross-border credit to emerging Asia continued to be severely affected by the Asian crisis.
The fact that sharp falls in credit to Latin American countries with relatively large US dollar exposures coincided with the talk of tapering may be related to the growing regional importance of US banks (Graph A, right-hand panel). These banks doubled their international claims on Latin America and the Caribbean from early 2009 to almost $140 billion in early 2013. The share of US banks in total international credit to Latin America is much higher than their share in claims on other emerging market regions. International claims of US banks on Latin America and the Caribbean fell by 10% in the second quarter of 2013, much more than those reported by other main creditor banking systems.
With interbank funding declining, banks increasingly relied on funding from non-bank entities. Cross-border funding obtained by reporting banks from non-banks in advanced economies increased by $224 billion (4.3%) in the second quarter of 2013, to almost one third of banks' cross-border liabilities. Non-banks in the United States and the United Kingdom contributed $107 billion (+6.1%) and $71 billion (+6.5%) to reporting banks' cross-border funding, respectively.
Credit to emerging market economies
Reporting banks' cross-border claims on borrowers in emerging market economies inched up by $23 billion (0.7%) in the second quarter of 2013.6 This followed the record growth of $266 billion in the previous quarter. Claims on banks increased by $25 billion (1.4%); those on non-banks fell by $1.8 billion (0.1%).
The significant slowdown in cross-border credit to emerging market economies in the second quarter of 2013 went hand in hand with heightened financial market volatility. This followed announcements in May that the Federal Reserve envisaged phasing out large-scale asset purchases. The prospect of this so-called "tapering" affected asset prices in some of the largest emerging market economies, such as Brazil, India, Russia and South-Africa. International banking activity largely followed the same pattern. A further analysis is presented in Box 1.
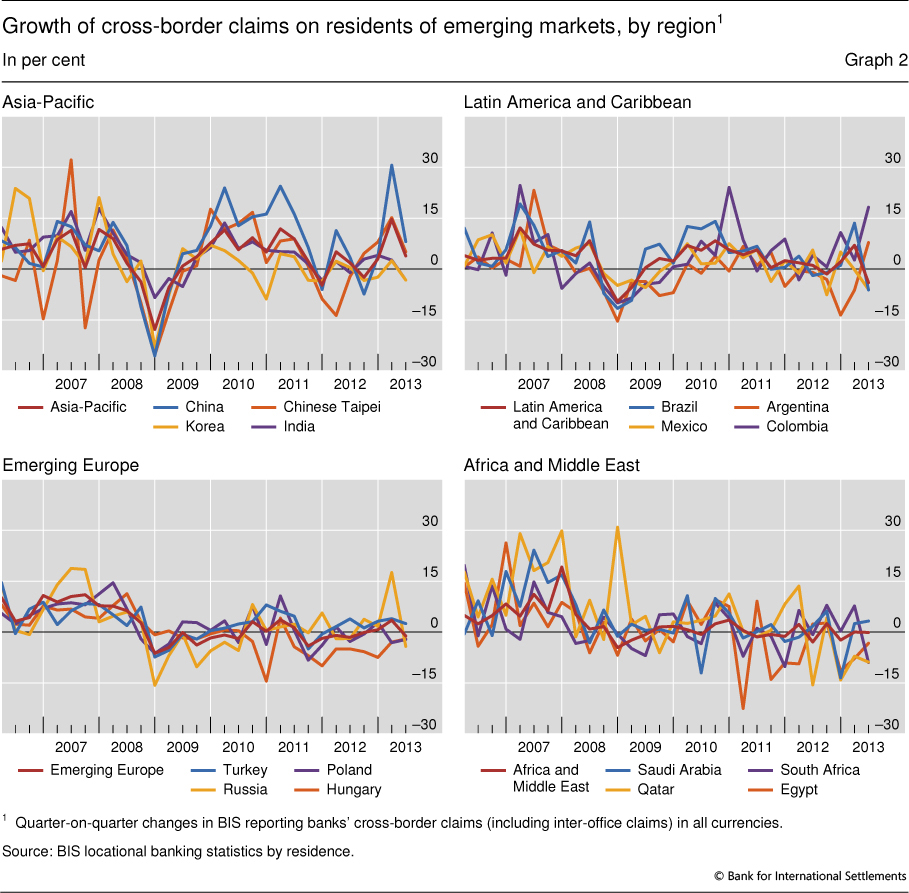
Cross-border credit to borrowers in Latin America and the Caribbean contracted the most. It fell by $27 billion or 4.0% (Graph 2, top right-hand panel), the largest quarterly decline on record. This decline was heavily concentrated on Brazil ($20 billion or 6.2%), although credit to several other Latin American countries contracted significantly (Mexico: $7.5 billion or 6.0%, Chile: $2.8 billion or 5.0%).
In contrast, claims on emerging economies in Asia, Europe, and Africa and the Middle East were relatively stable (Graph 2, top left-hand and bottom panels), but this hides significant variation across countries.
In emerging Asia, claims on India and Korea dropped by $7.2 billion (3.3%) and $6.3 billion (3.3%), respectively. In emerging Europe, cross-border claims on Russia fell by $8.0 billion (4.2%). Those on Poland and the Ukraine contracted by $2.6 billion (2.2%) and $1.8 billion (11%), respectively. In Africa and the Middle East, claims on Qatar and South-Africa fell by significant amounts ($4.6 billion (8.9%) and $3.5 billion (9.0%), respectively).
On the other hand, cross-border bank credit to China, the largest among the emerging markets, continued to grow, albeit at a slower pace than in the first quarter. In the second, banks lent an additional $54 billion (8.1%), mainly to banks and related offices (up $35 billion or 7.8%). China alone now accounts for 21% of the stock of cross-border claims on emerging market borrowers, up from 8% at end-2007. Indeed, BIS reporting banks' cross-border claims on China are larger than those on all but eight countries worldwide.7
Another country that recorded inflows in the second quarter was Turkey, where an increase in claims on banks and related offices more than offset a decline in claims on non-bank borrowers, resulting in a $4.6 billion (2.5%) overall rise. Cross-border claims on Saudi Arabia, Gabon, Morocco, Kuwait and Angola also increased, by a combined $8.4 billion.
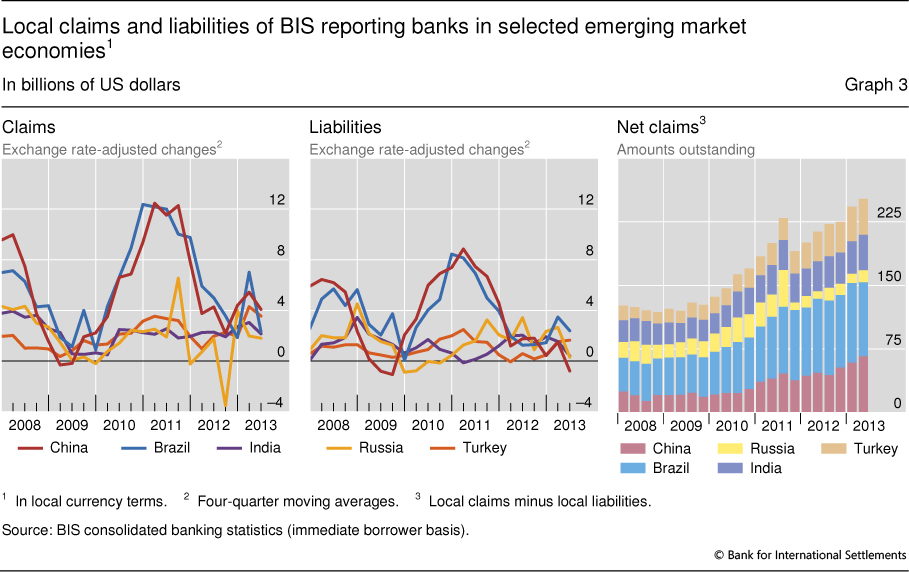
In many economies, the decline in cross-border credit was offset by high claims of foreign banks' local offices. Although the dollar value of locally booked claims in many economies fell in the second quarter, they actually increased in local currency terms as the local currency depreciated against the US dollar. Overall, when corrected for these exchange rate effects, the four-quarter moving average of credit provided by BIS reporting banks' local offices continued to expand for major emerging market economies (Graph 3, left-hand panel). This expansion largely surpassed that of the local liabilities reported by these banks (Graph 3, centre panel).
The OTC derivatives market in the first half of 2013
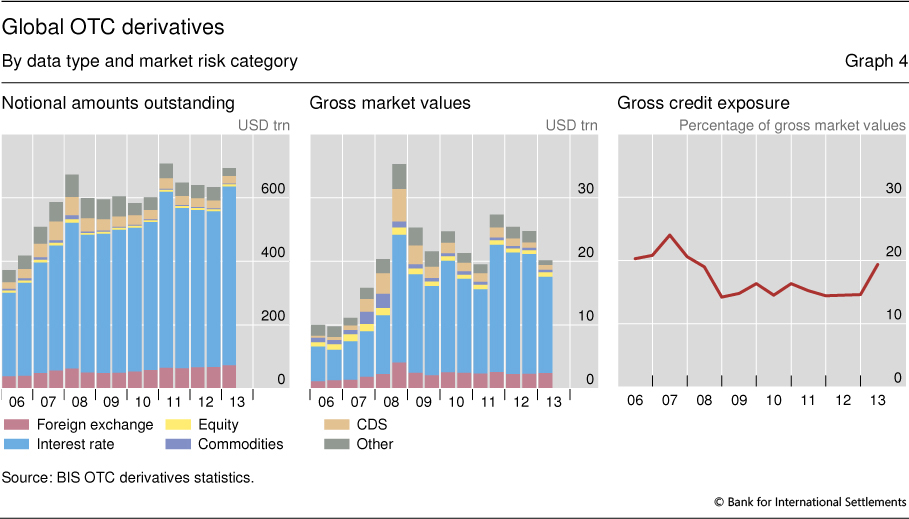
The latest BIS statistics on global OTC derivatives markets show that notional amounts outstanding totalled $693 trillion at end-June 2013, 10% more than at end-December 2012 (Graph 4, left-hand panel). Of this total, $668 trillion was reported by dealers in the 13 countries that participate in the BIS's semiannual survey, and $25 trillion by dealers in the 34 countries that participate only in the Triennial Survey.8
Despite the increase in outstanding amounts, the gross market value of all contracts, which measures the cost of replacing existing contracts at end-June market prices, dropped by 19% to $20 trillion (Graph 4, centre panel). Gross credit exposures, which capture reporting dealers' exposure after taking account of legally enforceable netting agreements and thus provide a measure of counterparty risk in the OTC derivatives market, jumped 8% to $3.9 trillion, or 20% of gross market values. This is almost on a par with the end-2007 level (Graph 4, right-hand panel).
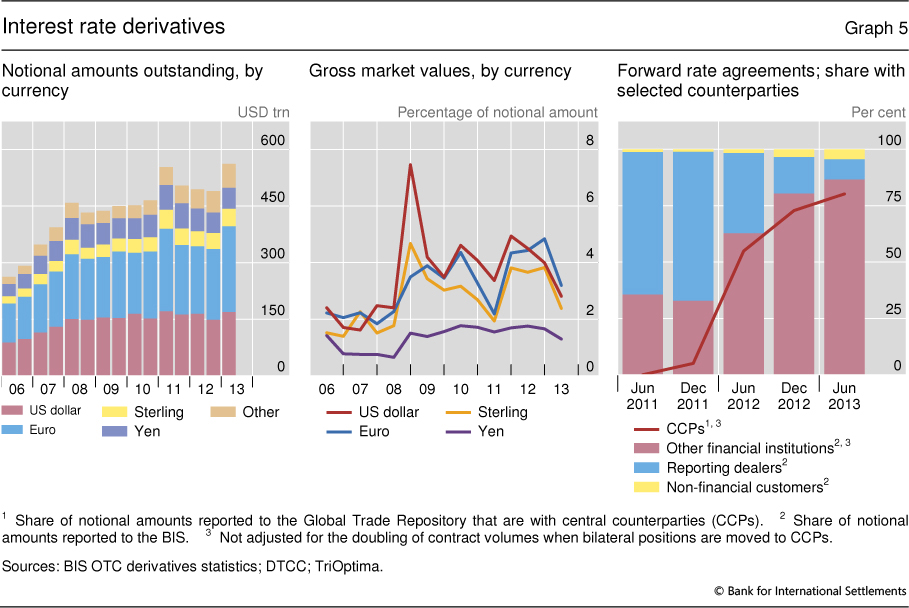
Growth in notional amounts outstanding was dominated by developments in interest rate and FX derivatives. The amounts outstanding of interest rate derivatives grew 15% to a new high of $561 trillion at mid-2013 (Graph 5, left-hand panel). Notional amounts outstanding of FX derivatives rose by almost 9% in the first half of 2013 to $73 trillion at end-June 2013. The increase in outstanding interest rate derivatives was driven by swaps (15%) and forward rate agreements (FRAs) (21%). The growth in FX derivatives was due mainly to a notable increase in options.
Despite the growth in notional amounts, the market value of interest rate derivatives dropped by almost 20%, driven by notable declines in the replacement values of swaps denominated in US dollars, euros and sterling (Graph 5, centre panel). Swap rates in these currencies increased sharply during the first half of 2013, bringing them closer to the level that prevailed at the inception of many longer-dated swaps.
Box 2
Who is issuing international bonds denominated in emerging market currencies?
Branimir Gruić and Philip Wooldridge
In recent quarters investor demand for higher-yielding assets has supported robust issuance of international debt securities denominated in emerging market (EM) currencies. In January-September 2013, gross issuance of such securities totalled $107 billion, down slightly from $115 billion during the same period in 2012. On a net basis, ie after adjusting for repayments, issuance in January-September 2013 was concentrated in the Brazilian real, Chinese renminbi and Mexican peso. While increased volatility in global financial markets in mid-2013 contributed to a slowdown in the issuance of EM currency-denominated international debt securities in the third quarter, new placements remained well above the lows seen in 2008-10 (Graph C, left-hand panel).
Recent international issuance in EM currencies was boosted by EM companies, especially their affiliates based abroad. The BIS international debt securities statistics capture issuance outside the market where the borrower resides - offshore issuance - regardless of the currency. Borrowers resident in an emerging market who issue offshore in their domestic currency have accounted for only a small share of EM currency-denominated issuance in international markets: 18% in 2013, equal to the average for the 2003-12 period (Graph C, left-hand panel). But if the nationality of issuers is considered, then there has been a marked change in the importance of EM borrowers. Companies headquartered in an emerging market but residing outside that market - shown in the left-hand panel of Graph C as EM nationals issuing in an EM currency as a foreign currency - accounted for 35% of gross international issuance of EM currencies in 2013. This compares to 25% in 2011-12 and only 11% prior to 2011.
In recent years, Asian firms were the most active EM issuers of international debt securities denominated in EM currencies, followed by Latin American firms. Whereas Brazilian and Mexican firms issuing real- or peso-denominated bonds internationally tend to issue through their head offices, Chinese, Korean and Russian firms often issue through affiliates abroad, including ones based in offshore financial centres. To the extent that the parent company stands ready to offer financial support to its affiliates abroad, analysing borrowing through the lens of nationality rather than residence can provide additional insights about a country's vulnerability to volatility in global financial markets.
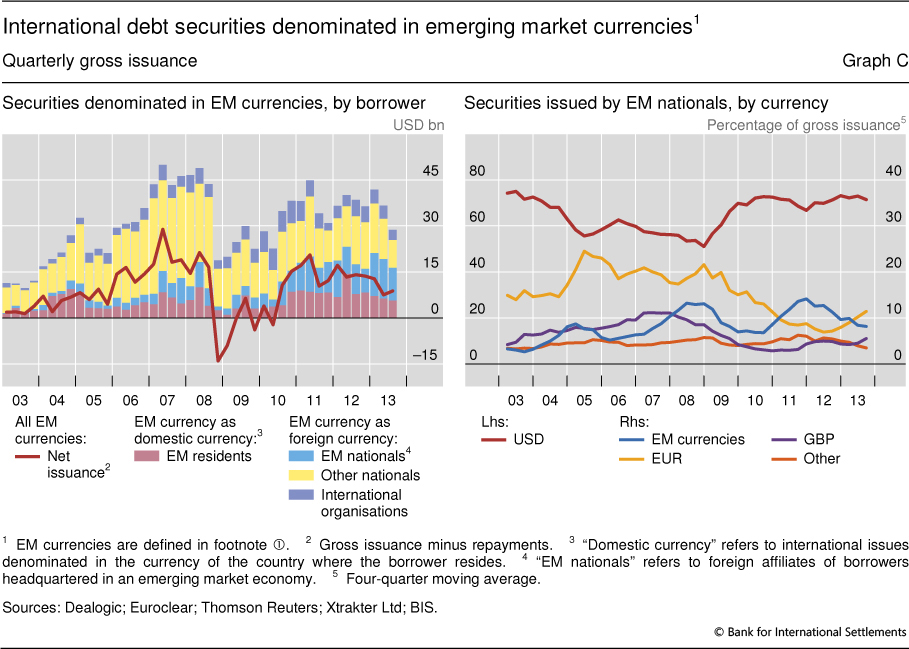
The increased presence of EM borrowers suggests that the international market for emerging market debt is opening to a wider diversity of borrowers. Historically, international issuance of bonds denominated in EM currencies was dominated by borrowers of high credit quality; international investors tended to prefer to separate the currency risk associated with EM-denominated issues from the credit risk associated with EM borrowers. While borrowers headquartered in advanced economies - "Other nationals" in the left-hand panel of Graph C - remain the most active issuers of international securities denominated in EM currencies, in recent years their share has fallen well below the 55% level of the 2000s, to 38% in 2012 and 36% in 2013. International organisations typically accounted for a further 12%.
The perceived improvement in the credit standing of many EM economies in recent years helps to support investor demand for EM currency-denominated bonds issued by EM companies. Such issuance in turn helps EM companies to reduce currency mismatches in their assets and liabilities.
That said, the US dollar continues to account for the bulk of their international issuance by a large margin. The US dollar's share of new placements by EM nationals has averaged 71% since 2010, well above the 61% share seen in 2003-09 (Graph C, right-hand panel). By comparison, EM currencies have accounted for between 6% and 17% of international issuance by EM-headquartered borrowers since 2010. The euro accounted for about 19% of gross issuance by EM nationals prior to 2009, but its share has since fallen to less than 10%. The euro's share of issuance by borrowers headquartered in central and eastern Europe is higher than that of issuance by borrowers from other regions. Yet even in Europe the US dollar is the currency of choice; since 2009 the US dollar's share of their international issuance has averaged 65%.
For the purpose of this box, EM currencies are defined as any currency other than the following 11: Australian dollar, Canadian dollar, Danish krone, euro (including legacy currencies), Japanese yen, Norwegian krone, New Zealand dollar, Swedish krona, Swiss franc, pound sterling and US dollar. As of end-September 2013, this definition produced a total of 76 currencies denominating one or more issues in the BIS international debt securities statistics. The BIS classifies a debt security as international if any one of the following characteristics is different from the country of residence of the issuer: country where the security is registered, law governing the issue, or market where the issue is listed. See "Enhancements to the BIS debt securities statistics", BIS Quarterly Review, December 2012, pp 63-76. For an explanation of why some borrowers issue through offshore affiliates, see "Emerging market debt securities issuance in offshore centres", BIS Quarterly Review, September 2013, pp 22-3.
A decline in the volume of inter-dealer positions was more than offset by larger positions with other financial counterparties. This was especially the case in the FRA market, where only 10% of all outstanding trades are between reporting dealers (Graph 5, right-hand panel). In part, this reflects the increasing share of contracts that are cleared centrally. When contracts are cleared through central counterparties (CCPs), contract volumes reported to the BIS increase because one contract becomes two (Graph 5, right-hand panel).9 Due to the impact of central clearing, as well as a substantial expansion of the reporting coverage in one country, FRA market values outstanding jumped from $47 billion at end-2012 to $168 billion at mid-2013.
Credit default swaps (CDS)
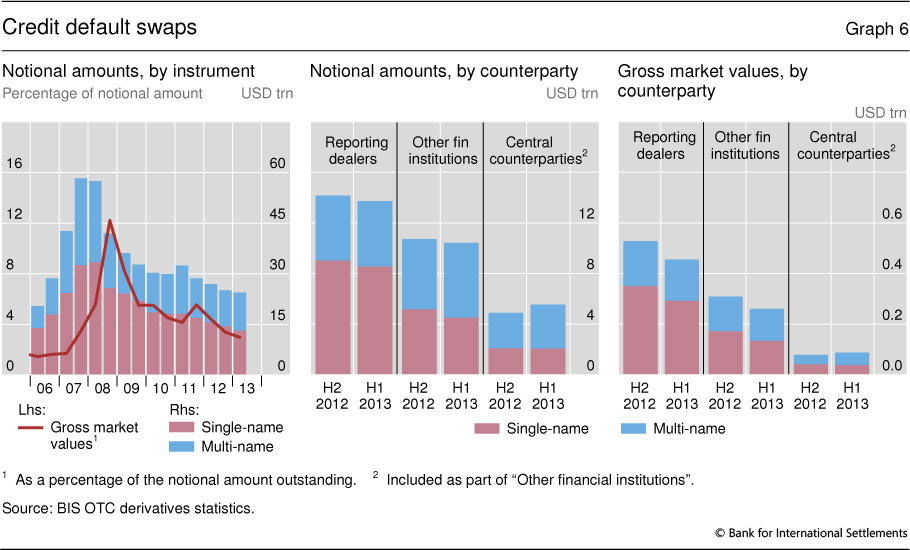
Outstanding contract volumes in the CDS market continued their gradual decline, contracting to $24 trillion at the end of June 2013 (Graph 6, left-hand panel). The fall in volumes in the first half of the year reflected a combination of compression of outstanding contracts and fewer new ones.
The drop in notional amounts outstanding was driven by lower positions in single-name contracts (-8%). In contrast, contracts referencing multiple names picked up for the first time since end-June 2011, increasing by 4% to $11 billion. Of these, index products grew slightly faster, at 5%. Outstanding credit protection on sovereigns grew by 10% compared to end-2012. In contrast, protection outstanding on securitised products relating to mortgage- and other asset-backed securities fell by 21%.
Gross market values for CDS continued to fall, by 14%, to $725 billion, the lowest since June 2007 (Graph 6, left-hand panel). This development was led by single-name contracts (-18%). Market values of multi-name contracts also declined, but by only 8%. Trades between reporting dealers continued to account for slightly more than half of outstanding contracts and other financial institutions for most of the rest with 43% (Graph 6, centre panel). The share of CDS cleared centrally with CCPs remained low at only 8% for single-name contracts and 18% for multi-name contracts.10
Box 3
Currency trading gets more financial
Robert N McCauley and Michela Scatigna
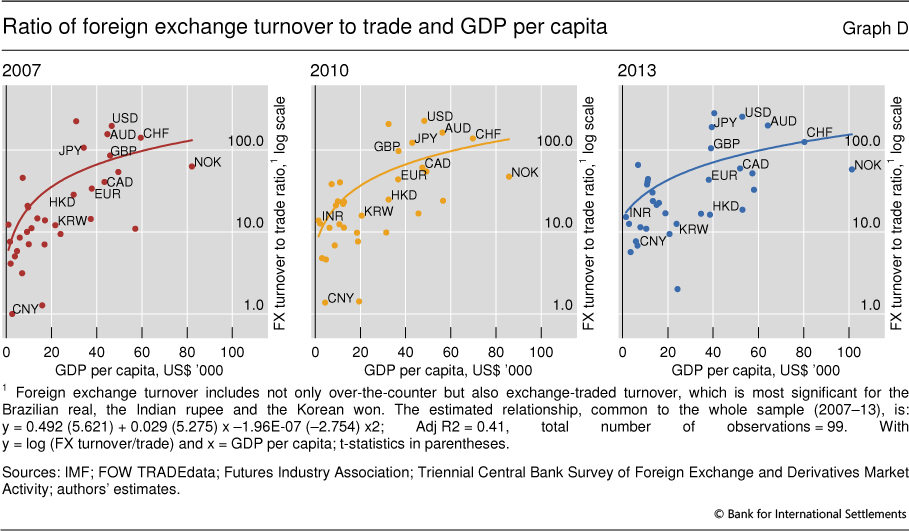
The Triennial Central Bank Survey in both 2007 and 2010 suggested that foreign exchange turnover in relation to a country's underlying trade grows with national income. In particular, as income per capita rises, currency turnover as a ratio of current account transactions of the home country rises from one to 10 times to a hundred or more (Graph D, left-hand and centre panels). In effect, with higher income, currencies become less connected to the real economy and more related to the financial economy. Estimated separately on the 2007 and 2010 data, the curvilinear regression lines ("Kuznets curves") were remarkably similar. As economies develop and GDP per capita rises, this ratio rises and the balance shifts from trade-related to financial transactions in a very predictable fashion.
The 2013 data again show the same relationship between national income and the balance between trade-related and financial transactions (Graph D, right-hand panel). Statistical tests do not support the hypothesis that the relationship has changed over time.
In terms of goodness of fit, the relationship is quite tight. In 2013, burgeoning renminbi trading strengthened an already strong relationship, while the blip in yen turnover temporarily weakened it (see "The anatomy of the global FX market through the lens of the 2013 Triennial Survey" in this issue). Taking the three years' observations together, the simple curvilinear model accounts for two fifths of the variance.
Robert N McCauley and Michela Scatigna, "Foreign exchange trading in emerging currencies: more financial, more offshore", BIS Quarterly Review, March 2011, pp 67-75.
1 This article was prepared by Adrian van Rixtel (adrian.vanrixtel@bis.org) for the banking section and Jacob Gyntelberg (jacob.gyntelberg@bis.org) for the derivatives section. Statistical support was provided by Pablo García (banking) and Denis Pêtre (derivatives).
2 The analysis in this section is based on the BIS locational banking statistics by residence, unless stated otherwise. In these statistics, creditors and debtors are classified according to their residence (as in the balance of payments statistics), not according to their nationality. All reported flows in cross-border claims have been adjusted for exchange rate fluctuations and breaks in series.
3 The consolidated banking statistics are structured by the nationality of reporting banks and are reported on a worldwide consolidated basis, ie excluding positions between affiliates of the same banking group. Banks consolidate their inter-office positions and report only their claims on unrelated borrowers.
4 International claims comprise cross-border claims in all currencies and local claims in foreign currencies, where local claims refer to credit extended by banks' affiliates located in the same country as the borrower.
5 This is derived from the BIS locational banking statistics by nationality. These provide information on the banking activity of all internationally active banks residing in the reporting country grouped by the nationality of the controlling parent institution. These statistics break down positions versus banks into positions versus related foreign offices (inter-office positions), other (or unrelated) banks and official monetary institutions. For more details, see Guidelines to the international banking statistics.
6 The BIS locational banking statistics by residence are described in footnote 2.
7 Based on the locational banking statistics by residence, the eight largest borrowing countries are: the United States, the United Kingdom, France, Germany, the Cayman Islands, the Netherlands, Luxembourg and Japan.
8 In the semiannual survey the latter is shown as the unallocated part of the total outstanding. The unallocated portion dropped from 7% in December 2012, where it was based on the 2010 Triennial Survey, to 4% in June 2013, where it was updated to reflect the 2013 Triennial Survey. See www.bis.org/publ/otc_hy1311.htm.
9 A central counterparty is an entity that interposes itself between counterparties to contracts traded in one or more financial markets, becoming the buyer to every seller and the seller to every buyer. When a derivatives contract between two reporting dealers is cleared by a CCP, this contract is replaced, in an operation called novation, by two new contracts: one between counterparty A and the CCP, and a second between the CCP and counterparty B. As the BIS data record all outstanding positions, they would capture both the contracts in this example. This measure of the market size, ie a measure that captures all outstanding contracts, may be appropriate for gauging counterparty risk, given that any outstanding contract could potentially be defaulted on. However, this approach overstates the size of the derivatives market if used to proxy other aspects, such as the transfer of underlying risks, for which a single counting of the centrally cleared contracts would be more appropriate.
10 Original trades adjusted for double counting, since a single contract initially agreed between two CCP members is replaced by two separate contracts, between the CCP and each of the counterparties.