Highlights of the BIS international statistics
BIS reporting banks reduced their cross-border claims in the third quarter of 2013, especially claims on banks, which contracted the most since the second quarter of 2012. Adjustments of inter-office positions accounted for most of the retreat in interbank lending. Cross-border credit to non-banks declined as well, especially to borrowers in the United States and the euro area. Among the main reporting regions, only emerging market economies and Japan saw an increase in cross-border credit to their residents. Claims on offshore centres remained virtually unchanged. This article contains two boxes. The first analyses recent changes in international interbank activity. The second discusses the role of cross-border investment in the global securities market.1
The international banking market in the third quarter of 2013
The cross-border claims of BIS reporting banks fell by $500 billion (1.8%) between end-June and end-September 2013 (Graph 1, top left-hand panel).2 As a result, total outstanding cross-border credit stood at $28.5 trillion at end-September 2013, compared with $29.5 trillion one year earlier. Cross-border claims denominated in euros fell by $308 billion or 3.2%, and those in US dollars by $295 billion or 2.5%, while claims in Japanese yen and Swiss francs increased by $43 billion (3.3%) and $18 billion (4.5%), respectively (Graph 1, top right-hand panel).
Cross-border credit developments differed across regions. Claims on advanced economies fell by $554 billion (2.6%), the largest decline in almost two years. The main exception was claims on Japan, which increased by $90 billion (10%). Claims on offshore centres remained virtually unchanged, registering a decline of just $4.4 billion (0.1%). In contrast, cross-border claims on emerging market economies increased by $60 billion (1.7%). Nevertheless, excluding China these claims actually fell.

International banking activity was characterised by lower credit to both banks and non-banks in the third quarter of 2013, mirroring developments in the previous quarter. Cross-border claims on banks fell by $466 billion (2.7%) (Graph 1, bottom left-hand panel). Inter-office positions accounted for most of this contraction, continuing the steady decline that began in late 2011. The retreat in cross-border interbank activity was most pronounced for claims on banks in the euro area ($205 billion or 4.2%), United Kingdom ($250 billion or 7.8%) and offshore centres ($35 billion or 1.7%).
Cross-border claims on non-bank borrowers - mainly non-bank financial institutions, governments and corporations - fell by $34 billion (0.3%) (Graph 1, bottom right-hand panel). While the fall was small, it was the second consecutive quarterly decline and partially reversed the modest increase seen in 2012.
Credit to non-bank entities
The decrease in cross-border claims on non-bank borrowers in the third quarter of 2013 was concentrated on the United States ($80 billion or 3.2%) and the euro area ($58 billion or 1.6%). Notwithstanding this decline, the consolidated banking statistics, which have a finer sectoral breakdown than the locational banking statistics, indicate that the sharp fall in claims on the US public sector recorded in the first half of 2013 was partially reversed in the third quarter. Consolidated international claims3 on the US public sector rose from $534 billion at end-June to $580 billion at end-September 2013. At the same time, the decline in international claims on the US non-bank private sector - mainly non-bank financial institutions and non-financial firms - continued in the third quarter of 2013, when they fell to $1.3 trillion.
In the euro area, France (-$24 billion or -4.5%) and Germany (-$22 billion or -3.7%) led the decline in credit to non-bank borrowers in the third quarter. At the same time, some euro area economies that had experienced sharp reductions in cross-border credit in recent years saw lending stabilise in 2013. Consolidated claims on the non-bank sectors of southern European countries and Ireland, both the public and non-bank private sectors, were more or less unchanged between end-June and end-September 2013, although at a fraction of their amount outstanding in 2009.
Box 1
International interbank activity in retreat
Pablo García-Luna and Adrian van Rixtel
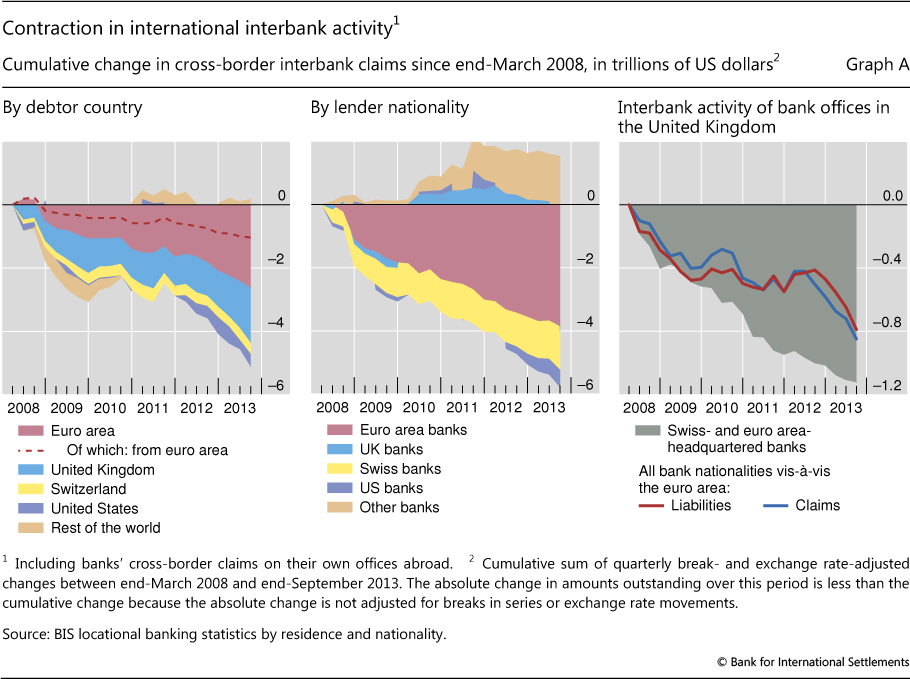
The 2007-09 global financial crisis and the subsequent euro area financial strains have left a profound imprint on international interbank funding. According to the BIS locational banking statistics by residence, cross-border interbank lending (including inter-office positions) fell from $22.7 trillion at end-March 2008 to $17.0 trillion at end-September 2013. While this contraction affected most countries worldwide, it was largest for borrowers in Europe, especially the euro area. Claims of BIS reporting banks on banking offices in the euro area fell by a cumulative $2.6 trillion (Graph A, left-hand panel), a reduction of 31%. Lending to banks in the United Kingdom dropped by $1.7 trillion, or 35%. Claims on banks in the United States and Switzerland fell sharply as well, by $415 billion (16%) and $346 billion (42%), respectively. This box considers which factors were at work, with an emphasis on developments in the euro area.
The BIS locational banking statistics by nationality show that banks headquartered in the euro area played a central role in the reduction in cross-border interbank lending, accounting for over two thirds of the total contraction (Graph A, centre panel). Swiss banks were responsible for most of the remainder. The large share of euro area and Swiss banks is partly related to the specific operation of their international interbank activities. These banks had traditionally routed a major part of their international operations through London. This practice was scaled down substantially during 2008-13. In fact, euro area and Swiss banks accounted almost entirely for the contraction in cross-border interbank activity registered by banks in the United Kingdom, reducing such activity by a cumulative $1.1 trillion since end-March 2008 (Graph A, right-hand panel, shaded area). The decline in cross-border interbank operations from the United Kingdom was concentrated on the euro area, in terms of both lending and borrowing (Graph A, right-hand panel, blue and red lines).
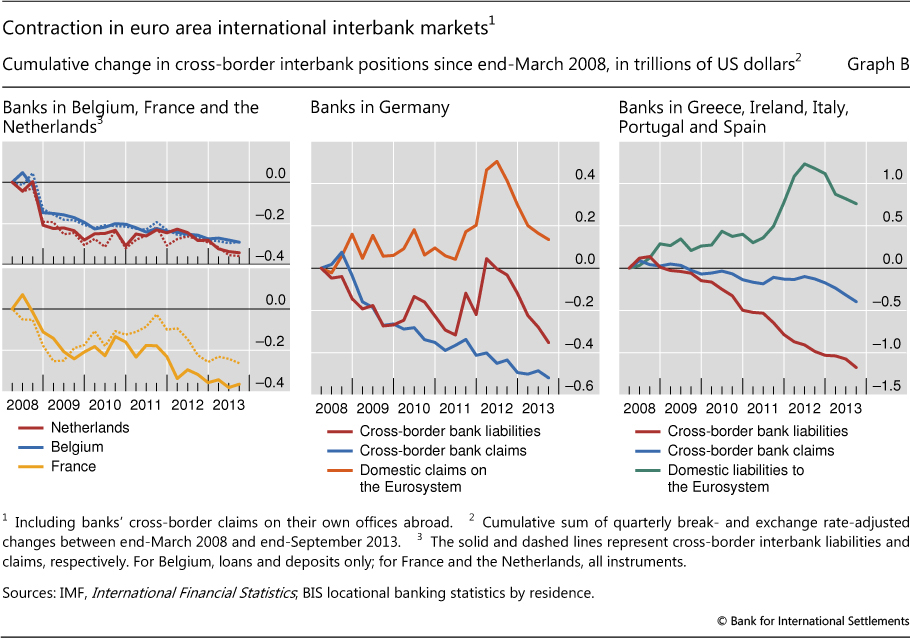
The sharp decline in international interbank activity on the euro area showed different patterns across countries, which can be categorised in three groups according to the differences in the evolution of banks' cross-border lending and borrowing. A first group, comprising Belgium, France and the Netherlands, experienced a significant reduction in cross-border funding during 2008-13 that was mirrored by a similar contraction in their cross-border interbank lending, resulting in largely unchanged net funding positions (Graph B, left-hand panel). Cross-border interbank borrowing and lending by banks in France initially fell rapidly during the global financial crisis, but recovered from mid-2009 to mid-2011. The intensification of the euro area financial crisis from the summer of 2011 triggered another sharp retreat in these banks' international interbank activity.
The second group comprises banks in Germany, which were large net recipients of international interbank funding, especially during 2010-13. These banks saw both cross-border interbank lending and borrowing decline for most of 2008-09 (Graph B, centre panel), but not subsequently. With the first tremors of the euro area financial crisis hitting financial markets in the first half of 2010, cross-border interbank liabilities of banks in Germany increased, offsetting part of the cumulative decline of the previous two years (red line). At the same time, these banks continued to reduce their cross-border interbank lending (blue line). The worsening of the euro area financial crisis from June 2011 to June 2012 led to a further sharp increase in the interbank liabilities of banks in Germany. This expansion was mirrored in an increase of the deposits maintained by banks in Germany with the Eurosystem (orange line).
In contrast, banks in the euro area periphery (the third group) experienced a large fall in their cross-border interbank funding, while their interbank lending declined more modestly (Graph B, right-hand panel). Cross-border interbank borrowing by banks in Greece, Ireland, Italy, Portugal and Spain fell by a cumulative $1.2 trillion during 2008-13 (red line). The resulting large international funding gap was covered by increased borrowing from the Eurosystem (green line). Hence, the Eurosystem replaced the international interbank market as a funding mechanism for these countries.
See J Caruana and A van Rixtel, "International financial markets and bank funding in the euro area: dynamics and participants", originally published in Economistas, December 2012. See G von Peter, "International banking centres: a network perspective", BIS Quarterly Review, December 2007. See A van Rixtel and G Gasperini, "Financial crises and bank funding: recent experience in the euro area", BIS Working Papers, no 406, March 2013.
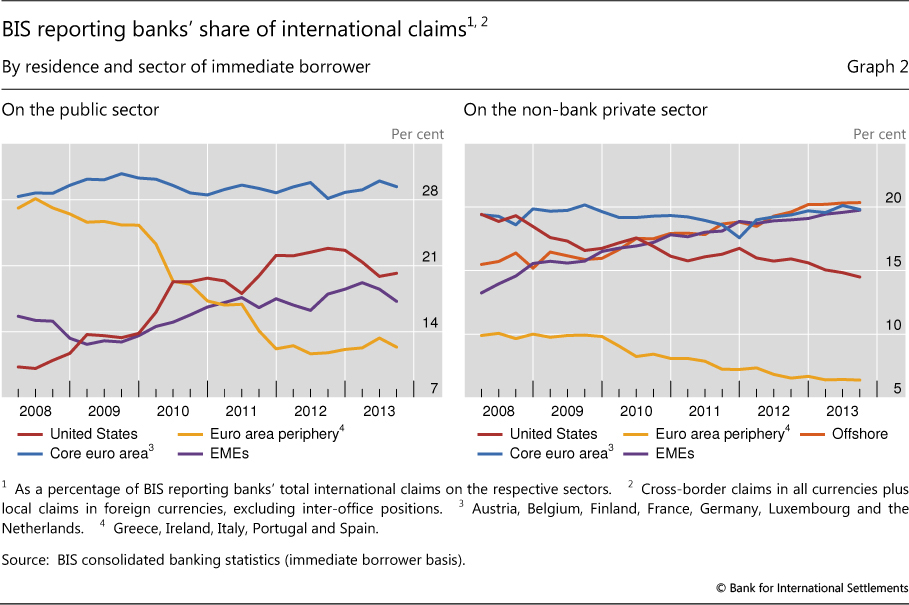
The consolidated sectoral exposures of BIS reporting banks vis-à-vis specific countries have undergone sizeable changes in recent years, as regards both the public and non-bank private sectors. Between the first quarter of 2008 and the third quarter of 2013, the share of international claims on the public sector accounted for by entities in the euro area periphery more than halved, from 27% to 12% (Graph 2, left-hand panel). This was mirrored by strong increases in the relative weight of exposures to the US public sector4 and that of emerging market economies, to 20% and 17%, respectively. Relative exposures to the non-bank private sector shifted from the United States and the euro area periphery to offshore centres and emerging market economies (Graph 2, right-hand panel). On a consolidated basis, in the third quarter of 2013 the amount of international financing provided to non-bank private borrowers from the latter two regions was roughly equal to that granted to the euro area and United States combined.
Credit to emerging market economies
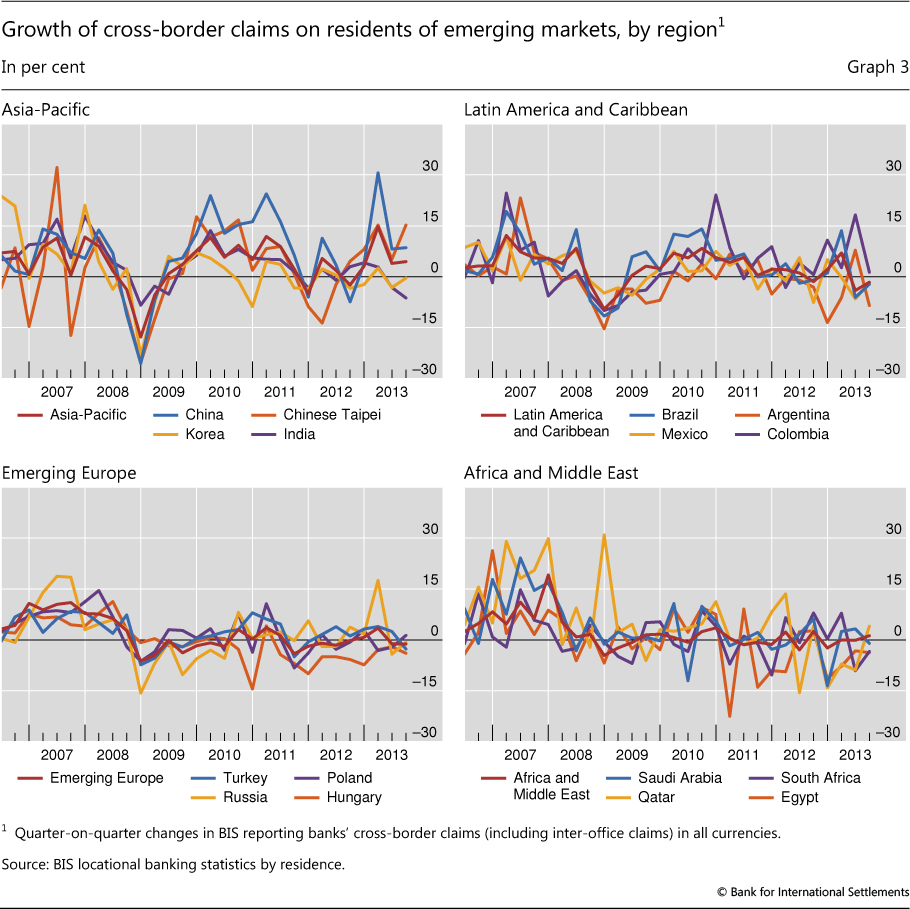
The BIS locational banking statistics show that reporting banks' cross-border claims on borrowers in emerging market economies expanded by $60 billion (1.7%) in the third quarter of 2013. Cross-border credit to banks increased by $33 billion (1.8%), while claims on non-banks rose by $27 billion (1.7%). Increases were concentrated in a few, predominantly Asian, countries whereas declines were widespread (Graph 3). These developments coincided with a period of volatility in global financial markets, after announcements in May that the Federal Reserve envisaged phasing out large-scale asset purchases led to capital outflows from several emerging market economies.
Among those countries where cross-border claims expanded in the third quarter of 2013, the largest absolute increases were seen by China ($62 billion or 8.5%), Chinese Taipei ($15 billion or 15%), Malaysia ($6 billion or 9.3%), and the United Arab Emirates ($6 billion or 6.3%). The increase vis-à-vis Malaysia was the largest in two and a half years and was driven by lending to banks ($5 billion or 11%).
The largest absolute declines in the third quarter were experienced by India ($13 billion or 6.3%), Turkey ($5 billion or 2.8%) and Brazil ($3.4 billion or 1.1%). For Turkey, this was the first substantial drop in cross-border claims in about two years. Claims on Thailand fell by $2 billion (2.8%), which marked a turnaround in the previous upward trend. Nevertheless, the decline was small compared with the $13 billion cumulative increase in cross-border bank financing to the country in the first half of 2013.
In central and eastern Europe, cross-border claims again contracted (Graph 3, bottom left-hand panel). Increases in claims on Poland and the Czech Republic were more than offset by large declines vis-à-vis Hungary, Romania, Croatia and Latvia.
Turning to the nationality of creditor banks, US banks recorded the largest reductions in claims on emerging markets in the third quarter of 2013. European banks collectively maintained their lending to these countries. Smaller banking systems that have historically had a limited international presence continued to grant more credit. The share of foreign claims on emerging market borrowers accounted for by these smaller banking systems - specifically, all other BIS reporting banks except US, European and Japanese banks - rose from 12% at end-2012 to 13% at end-September 2013. Asian banks in particular continued to expand their international presence in the emerging Asia region.5
Box 2
Cross-border investments in global debt markets since the crisis
Branimir Gruić and Andreas Schrimpf
Global debt markets have grown to an estimated $100 trillion (in amounts outstanding) in mid-2013 (Graph C, left-hand panel), up from $70 trillion in mid-2007. Growth has been uneven across the main market segments. Active issuance by governments and non-financial corporations has lifted the share of domestically issued bonds, whereas more restrained activity by financial institutions has held back international issuance (Graph C, left-hand panel).
Not surprisingly, given the significant expansion in government spending in recent years, governments (including central, state and local governments) have been the largest debt issuers (Graph C, left-hand panel). They mostly issue debt in domestic markets, where amounts outstanding reached $43 trillion in June 2013, about 80% higher than in mid-2007 (as indicated by the yellow area in Graph C, left-hand panel). Debt issuance by non-financial corporates has grown at a similar rate (albeit from a lower base). As with governments, non-financial corporations primarily issue domestically. As a result, amounts outstanding of non-financial corporate debt in domestic markets surpassed $10 trillion in mid-2013 (blue area in Graph C, left-hand panel). The substitution of traditional bank loans with bond financing may have played a role, as did investors' appetite for assets offering a pickup to the ultra-low yields in major sovereign bond markets.
Financial sector deleveraging in the aftermath of the financial crisis has been a primary reason for the sluggish growth of international compared to domestic debt markets. Financials (mostly banks and non-bank financial corporations) have traditionally been the most significant issuers in international debt markets (grey area in Graph C, left-hand panel). That said, the amount of debt placed by financials in the international market has grown by merely 19% since mid-2007, and the outstanding amounts in domestic markets have even edged down by 5% since end-2007.
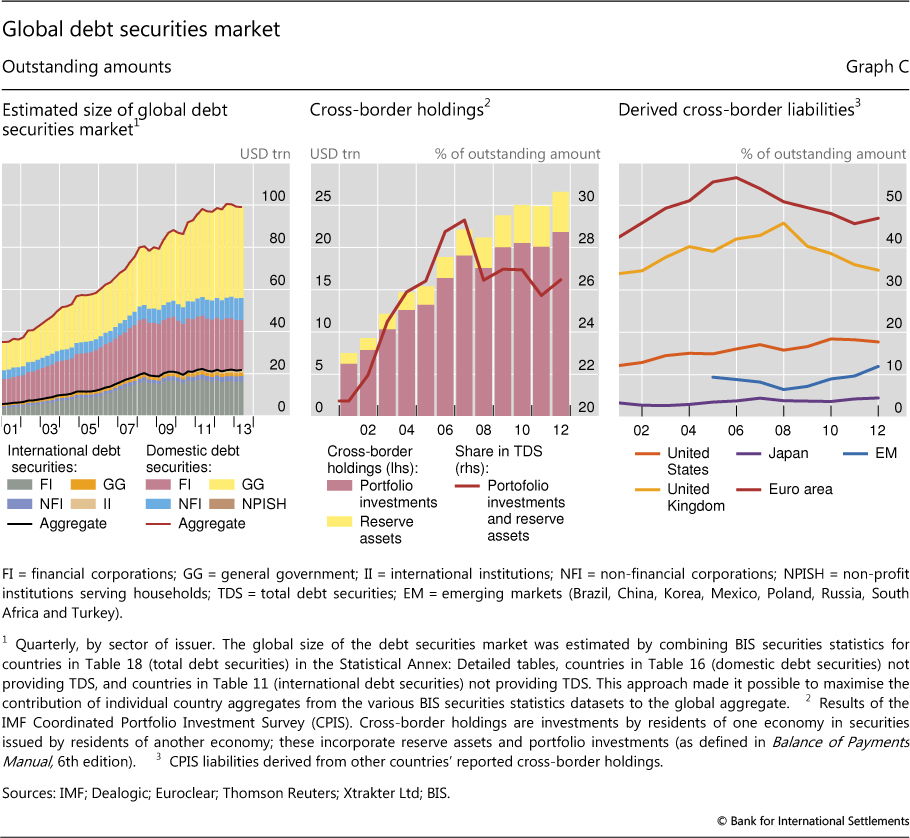
Who are the investors that have absorbed the vast amount of newly issued debt? Has the investor base been mostly domestic or have cross-border investments grown at a similar pace to global debt markets? To provide a perspective, we combine data from the BIS securities statistics with those of the IMF Coordinated Portfolio Investment Survey (CPIS). The results of the CPIS suggest that non-resident investors held around $27 trillion of global debt securities, either as reserve assets or in the form of portfolio investments (Graph C, centre panel). Investments in debt securities by non-residents thus accounted for roughly one quarter of the stock of global debt securities, with domestic investors accounting for the remaining 75%.
The global financial crisis has left a dent in cross-border portfolio investments in global debt securities. The share of debt securities held by cross-border investors either as reserve assets or via portfolio investments (as a percentage of total global debt securities markets) fell from around 29% in early 2007 to 26% in late 2012. This reversed the trend in the pre-crisis period, when it had risen by 8 percentage points from 2001 to a peak in 2007. It suggests that the process of international financial integration may have gone partly into reverse since the onset of the crisis, which is consistent with other recent findings in the literature. This could be temporary, though. The latest IMF-CPIS data indicate that cross-border investments in debt securities recovered slightly in the second half of 2012, the most recent period for which data are available.
The contraction in the share of cross-border holdings differed across countries and regions (Graph C, right-hand panel). Cross-border holdings of debt issued by euro area residents stood at 47% of total outstanding amounts in late 2012, 10 percentage points lower than at the peak in 2006. A similar trend can be observed for the United Kingdom. This suggests that the majority of new debt issued by euro area and UK residents has been absorbed by domestic investors. Newly issued US debt securities, by contrast, were increasingly held by cross-border investors (Graph C, right-hand panel). The same is true for debt securities issued by borrowers from emerging market economies. The share of emerging market debt securities held by cross-border investors picked up to 12% in 2012, roughly twice as high as in 2008.
The global size of debt securities market is estimated based on three sets of BIS securities statistics: TDS (total debt securities), DDS (domestic debt securities) and IDS (international debt securities). The BIS classifies a debt security as international (IDS) if any one of the following characteristics is different from the country of residence of the issuer: country where the security is registered, law governing the issue, or market where the issue is listed. All other securities are classified as domestic (DDS). From a methodological point of view, the union of the two (IDS and DDS) makes up total debt securities (TDS). See B Gruić and P Wooldridge, "Enhancements to the BIS debt securities statistics", BIS Quarterly Review, December 2012, pp 63-76. Data on cross-border investments in debt securities are sourced from the CPIS, which is conducted by the IMF as an annual voluntary portfolio investment data collection. The IMF data also incorporate information from the Securities Held as Foreign Exchange Reserves and Securities Held by International Organizations surveys (total $4.8 trillion at end-2012.) For additional information about the CPIS, see http://cpis.imf.org. See eg P Lane and G M Milesi-Ferretti, "International financial integration", IMF Staff Papers, vol 50, for measures of international financial integration via international balance sheets (not just focusing on global debt securities as in this box). Recent evidence on the contraction of international balance sheets since the crisis is provided eg by G Ma and R N McCauley, "Global and euro imbalances: China and Germany", BIS Working Papers, no 424.
1 This article was prepared by Adrian van Rixtel (adrian.vanrixtel@bis.org). Statistical support was provided by Jeff Slee (jeff.slee@bis.org).
2 The analysis in this section is based on the BIS locational banking statistics by residence, unless stated otherwise. In these statistics, creditors and debtors are classified according to their residence (as in the balance of payments statistics), not according to their nationality. All reported flows in cross-border claims have been adjusted for exchange rate fluctuations and breaks in series.
3 International claims comprise cross-border claims in all currencies and local claims in foreign currencies, where local claims refer to credit extended by banks' affiliates located in the same country as the borrower.
4 See R McCauley and P McGuire, "Non-US banks' claims on the Federal Reserve", this issue.
5 See also P McGuire and A van Rixtel, "Shifting credit patterns in emerging Asia", BIS Quarterly Review, December 2012.