The financial system at a crossroads
Abstract
The financial sector has gained some strength since the crisis. Banks have rebuilt capital (mainly through retained earnings) and many have shifted their business models towards traditional banking. However, despite an improvement in aggregate profitability, many banks face lingering balance sheet weaknesses from direct exposure to overindebted borrowers, the drag of debt overhang on economic recovery and the risk of a slowdown in those countries that are at late stages of financial booms. In the current financial landscape, market-based financial intermediation has expanded, notably because banks face a higher cost of funding than some of their corporate clients. In particular, asset management companies have grown rapidly over the past few years and are now a major source of credit. Their larger role, together with high size concentration in the sector, may influence market dynamics and hence the cost and availability of funding for firms and households.
Full text
Nearly six years after the apex of the financial crisis, the financial sector is still coping with its aftermath. Financial firms find themselves at a crossroads. Shifting attitudes towards risk in the choice of business models will influence the sector's future profile. The speed of adjustment will be key to the financial sector again becoming a facilitator of economic growth.
The banking sector has made progress in healing its wounds, but balance sheet repair is incomplete. Even though the sector has strengthened its aggregate capital position with retained earnings, progress has not been uniform. Sustainable profitability will thus be critical to completing the job. Accordingly, many banks have adopted more conservative business models promising greater earnings stability and have partly withdrawn from capital market activities.
Looking forward, high indebtedness is the main source of banks' vulnerability. Banks that have failed to adjust post-crisis face lingering balance sheet weaknesses from direct exposure to overindebted borrowers and the drag of debt overhang on economic recovery (Chapters III and IV). The situation is most acute in Europe, but banks there have stepped up efforts in the past year. Banks in economies less affected by the crisis but at a late financial boom phase must prepare for a slowdown and for dealing with higher non-performing assets.
The role of non-bank financial firms has grown as market-based intermediation has gained in importance following banks' retrenchment. Low policy rates and a continuing search for yield have encouraged private bond issuance, while banks have faced a persistent cost disadvantage relative to their corporate clients. The portfolios of asset management companies (AMCs) have soared over the past few years, and AMCs are now a major source of credit. This, together with high size concentration in the sector, may influence bond market dynamics, with implications for the cost and availability of funding for businesses and households.
The chapter is organised in three sections. The first section discusses financial sector performance over the past year. The second focuses on structural changes that have been shaping business models. The third explores the near-term challenges institutions face, some in dealing with legacy losses, others in strengthening their defences in view of a possible turn in the financial cycle.
Overview of trends
On aggregate, the financial sector has made progress in overcoming the crisis and adjusting to the new economic and regulatory environment. Banks are building capital faster than planned, and their profitability is improving. In some countries, however, problems with asset quality and earnings persist. The picture in the insurance sector is similar, with generally robust premium growth but an uneven return on equity across jurisdictions.
Banks
Key trends for banks include stronger capital positions and a reduction in risk-weighted assets (RWA). The sector has made progress in rebuilding its capital base primarily through retained earnings, supported by a recovery in profitability. This progress has not been uniform, however, as some banks (especially in Europe) remain under strain. The reduction in RWA reflected in some cases outright balance sheet shrinkage but in many others a decline in the average risk weight of assets. Given banks' track record of overly optimistic risk reporting, the latter driver raises concerns about hidden vulnerabilities.
Capital ratios
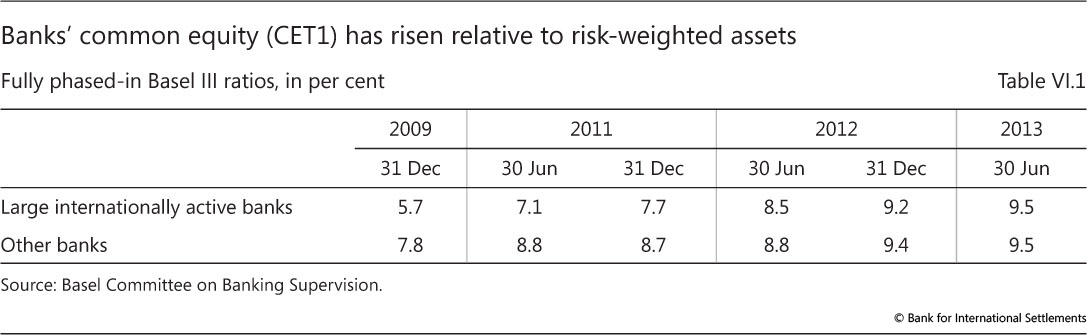
Banks worldwide have continued to boost their capital ratios. Thus far, progress for the sector as a whole has exceeded the minimum pace implied in the Basel III phase-in arrangements (Box VI.A). In the year to mid-2013, large internationally active banks, as a group, increased their average Common Equity Tier 1 (CET1) capital from 8.5% of risk-weighted assets to 9.5% (Table VI.1). This average ratio comfortably exceeded the 2019 benchmark of 7% (CET1 plus conservation buffer) six years ahead of schedule. Smaller, more regionally oriented banks reached the same average capital ratio, albeit starting from a higher base of 8.8%. Importantly, these ratios reflect the more stringent new definitions of eligible capital that are being phased in and will come fully into force only in 2022.
Progress is also evident in the shrinking capital shortfall of those banks that are lagging. At mid-2013, this shortfall was €85.2 billion, or €59.6 billion lower than at the beginning of that year. This reduction was primarily due to gains made by large internationally active banks, which almost halved their shortfall. By contrast, the shortfall of smaller banks edged slightly higher, but was still less than half the amount for their larger peers. For comparison, in 2013, the two groups of banks recorded combined annual profits (after tax and before distributions) of €482 billion, more than four times the capital shortfall.
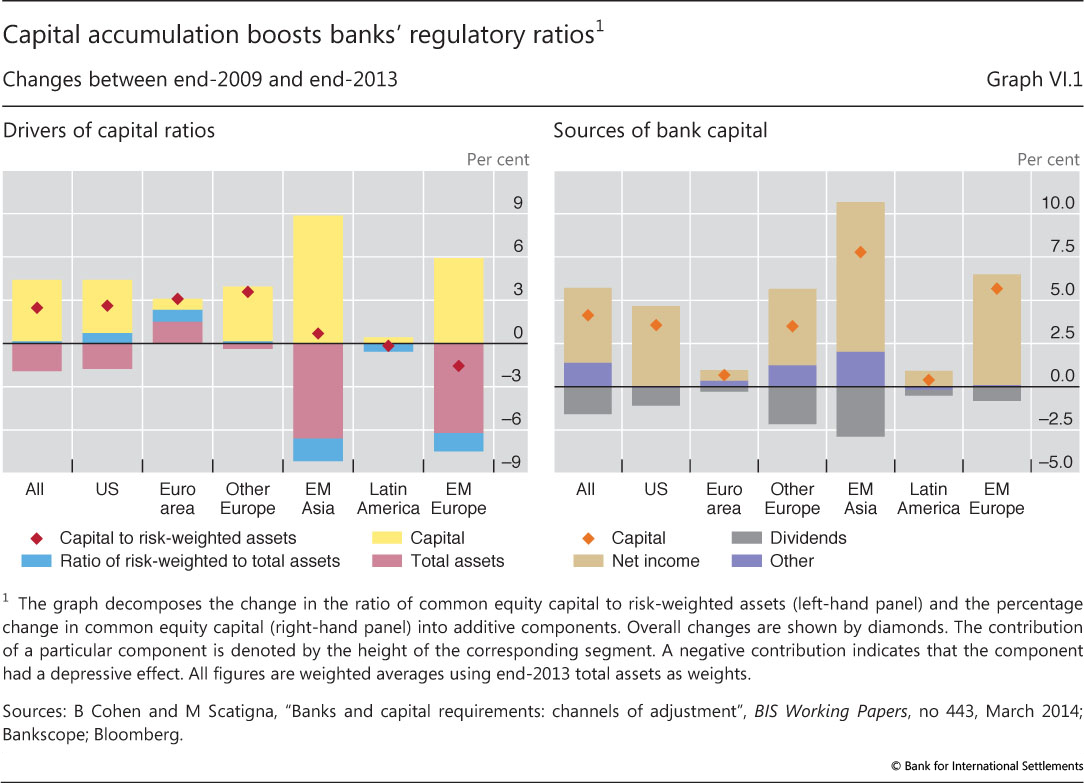
Increases in bank capital have provided the main boost to regulatory ratios. Graph VI.1 (left-hand panel), using data from public financial statements, decomposes changes in the ratios of common equity to risk-weighted assets. Increases in eligible capital (left-hand panel, yellow bar segments) made the largest contribution overall, and especially for banks in emerging market economies (EMEs) and for systemically important institutions (not shown).
Retained earnings played a key role in supplying fresh capital (Graph VI.1, right-hand panel). In aggregate, they account for 2.8 points out of the 4.1 percentage point increase in banks' capital-to-RWA ratio between 2009 and 2013. Correspondingly, the ratio of earnings paid out as dividends declined by almost 13 percentage points to 33%. Banks from advanced economies reduced this ratio by more than 12 percentage points. In the United States, the decline in banks' dividend payout ratio contrasted with the behaviour of government-sponsored enterprises, the main underwriters of mortgage loans. Under government control, these institutions disbursed their profits to the US Treasury, keeping their equity cushions slim.
Box VI.A
Regulatory reform - new elements and implementation
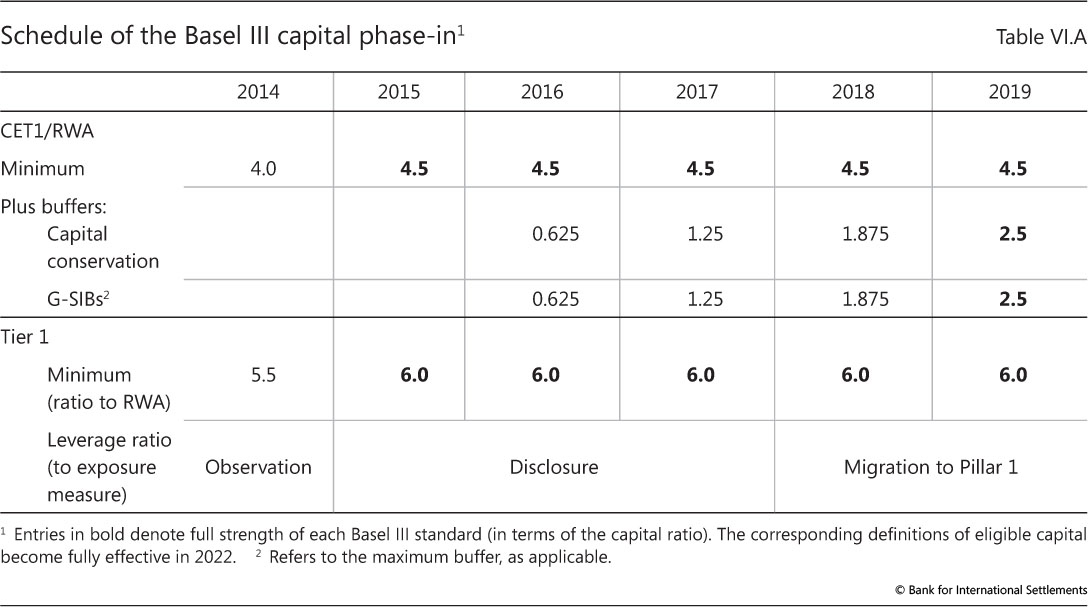
To minimise transition costs, implementation of the new capital standards is phased over several years (Table VI.A). The 8% minimum ratio of total capital to risk-weighted assets (RWA) is already in full effect, but the ratios that involve higher-quality capital - Common Equity Tier 1 (CET1) and overall Tier 1 - will reach their new, higher levels in 2015. The new capital conservation buffer and the surcharge for global systemically important banks (G-SIBs), both defined in terms of CET1/RWA, will be fully binding in 2019.
In the past year, the Basel Committee on Banking Supervision (BCBS) made progress on two key elements of the post-crisis regulatory reform agenda. The first comprises the minimum liquidity standards. The liquidity coverage ratio (LCR) was published in January 2013, and the definition of high-quality liquid assets (HQLA) was finalised one year later. The new definition makes greater room for central bank committed liquidity facilities (CLFs). Their use has been allowed for all jurisdictions, subject to a range of conditions and limitations. The restrictions are intended to limit the use of CLFs in normal times and to encourage banks to self-insure against liquidity shocks, but they may be relaxed during times of stress, when HQLA might otherwise be in short supply. The Committee also sought comments on the net stable funding ratio (NSFR), the second liquidity standard.
Another important element finalised in January 2014 was the definition of the denominator of the Basel III leverage ratio, a simple ratio of capital to total bank exposure that complements the risk-based capital requirements. The exposure measure represents progress in two respects. First, it is universal, as it overcomes discrepancies in the way different accounting standards capture off-balance sheet exposures, including derivatives. Its definition adopts an established regulatory practice that is highly comparable across jurisdictions. Second, the measure is comprehensive, as it ensures adequate capture of both on- and off-balance sheet sources of leverage. The result is stricter capital requirements per unit of exposure than those implied by leverage ratios that had already been in place in some jurisdictions. Early observations suggest that, on average, the exposure measure is about 15-20% higher than the corresponding total assets metric. Starting in 2015, banks are required to disclose the ratio, with a view to migrating it to a Pillar 1 requirement by 2018 after a final calibration.
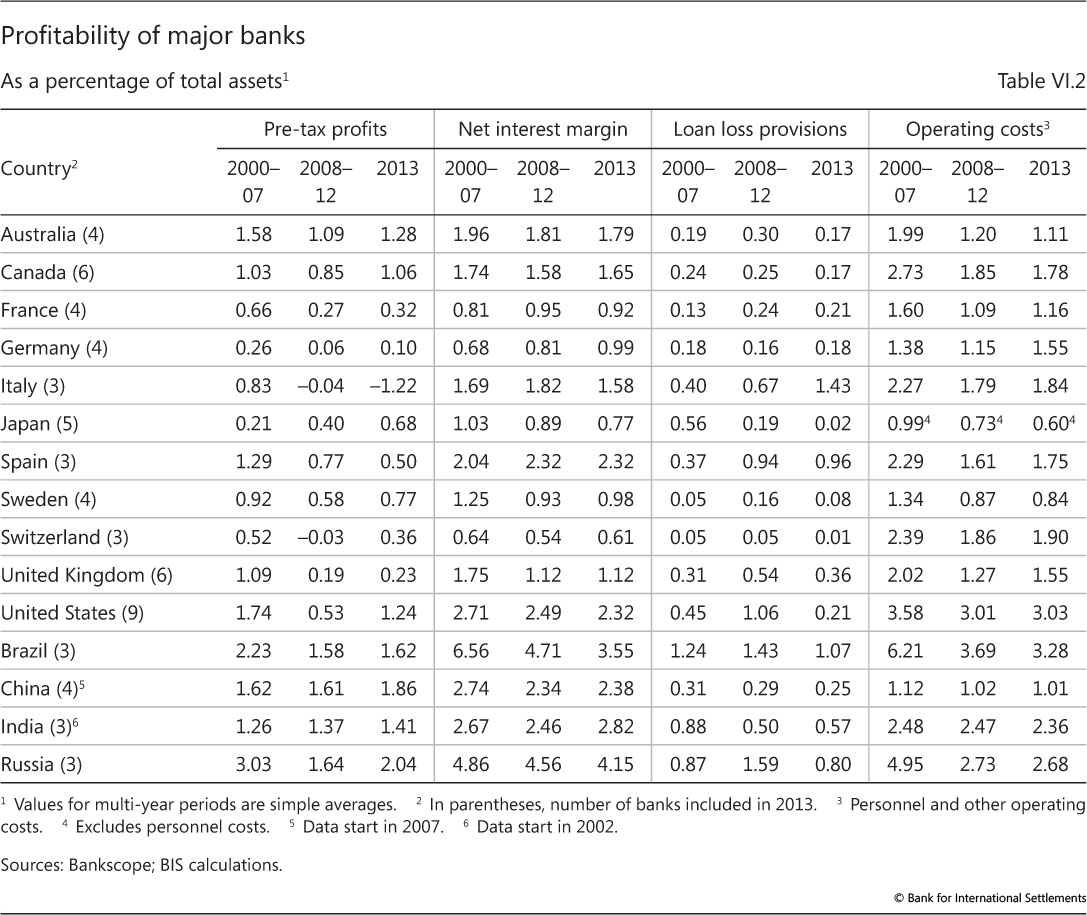
Given their contribution to higher bank capital so far, stable profits will be key to the sector's resilience in the near future. On average, profits rebounded further from the crisis lows, but recovery remained uneven across countries (Table VI.2).
Outside the euro area, banks' pre-tax profits improved last year but remained generally below pre-crisis averages. Interest rate margins did not contribute as much as in previous years. They remained mostly flat globally, and in some cases even declined (eg in the United States). Instead, lower credit-related costs were the main factor at work. Loan loss provisions have been declining in most countries, reflecting the economic recovery and progress in loss recognition.
In the euro area, the picture was quite different. Profits remained lacklustre. Sovereign debt strains continued to affect asset quality, and a stagnating economy compressed revenues. Banks are stepping up their effort to deal with impaired balance sheets ahead of the ECB's asset quality review later this year, as witnessed by the recent spike in the write-off rate.
Recent developments in the Chinese banking sector illustrate the benefits of retaining earnings as a buffer against losses. As economic growth in China weakened, borrowers in the country came under financial strain and the volume of impaired loans ballooned. By drawing on their reserves, however, the five largest Chinese banks were able in 2013 to absorb credit losses twice as large as a year earlier, post strong profits and maintain high capital ratios.
Investment banking activity produced mixed results. Revenues from merger and acquisition advisory business and securities underwriting strengthened, aided by very robust corporate debt issuance. By contrast, secondary market trading of fixed income products and commodities weakened, dragging down related revenues and, alongside a tougher supervisory stance, leading several large capital market players to trim their trading activity. Legal risk also played a role. Intensifying official probes into market benchmark manipulation have resulted in very large fines in recent years.
Risk-weighted assets
The second driver of the improvement in banks' capital ratios was the reduction in the denominator: risk-weighted assets (Graph VI.1, left-hand panel). This may reflect shrinkage in total assets (magenta segments) or a decline in RWA relative to total assets (blue segments). Most banks grew in size but lowered the average risk weight of their asset portfolio. In advanced economies, the decline in RWA relative to total assets contributed 0.7 points to the 3 percentage point average increase in banks' capital ratios. Euro area banks are an exception to this pattern, as shrinking balance sheets also contributed to the increase in their capital ratios.
In fact, the average risk weight in bank portfolios has been falling since 2007. Despite the Great Recession and the sluggish recovery, ratios of RWA to total assets were about 20% lower in 2013 than six years earlier. Market commentary indicates that more than a genuine reduction in assets' riskiness has been at play and suggests that banks redesigned risk models in order to lower capital requirements by underestimating risk and providing optimistic asset valuations. This may explain in part the persistent discount at which bank shares trade on the book value of equity (Graph VI.8, left-hand panel). This concern has been intensified by the observation that risk weights for similar assets vary substantially across banks.
Market observers and supervisory studies point to a dispersion of reported RWA that is hard to justify given the underlying risk exposures. The dispersion is generally higher for more complex positions. Focused analysis of banks' loan and trading portfolios finds that both supervisory practices and individual bank choices are at work.1 These practices reflect a combination of discretion permitted under the Basel framework and, occasionally, deviations from the framework. Examples include the implementation of capital floors and the partial use of the standardised (non-model-based) approach - for instance, for credit exposures to sovereigns (Box VI.B). Internal model risk estimates based on short data samples, and wide variation in the valuation of trading positions, contribute to the dispersion of RWA. The combined effect of these varying practices suggests that there is scope for inconsistency in risk assessments and hence in regulatory ratios.
Box VI.B
Regulatory treatment of banks' sovereign exposures
Risk sensitivity is at the core of the capital framework. Basel II and III prescribe minimum capital requirements commensurate with the credit risk of all exposures. This risk sensitivity also applies to sovereign exposures.
The most relevant standard for internationally active banks is the internal ratings-based (IRB) approach. It requires a meaningful differentiation of risk and asks banks to assess the credit risk of individual sovereigns using a granular rating scale. The Basel framework is based on the premise that banks use the IRB approach across the entire banking group and across all asset classes. But it allows national supervisors to permit banks to gradually phase in the approach across the banking group and, only if the exposures are non-material in terms of both size and risk, to keep certain exposures in the external ratings-based, standardised approach (SA) indefinitely.
The SA, as a rule, prescribes positive risk weights to all but the highest-quality credits (AAA to AA). For instance, it assigns a 20% weight to A-rated borrowers and a 100% weight to B-rated ones. National supervisors, however, are allowed to exercise discretion and set lower risk weights to sovereign exposures that are denominated and funded in the corresponding national currency. As a result, the risk weights on such exposures have varied considerably across large international banks, including global systemically important ones. In fact, the variability in sovereign risk weights across banks is an important driver of the variability of overall risk-weighted assets.
Data on individual bank risk assessments are generally not available outside the supervisory community. A notable exception is the European Banking Authority's welcome initiative to disclose the risk weights and total exposures of large European banks for different asset classes. The information reveals a wide range of practices and a general tendency to assign a lower weight to exposures to the home sovereign.
In aggregate, banks assign a zero risk weight to more than half of their sovereign debt holdings. This is particularly true for portfolios under the SA, which cover the majority of banks' sovereign exposures, but also for some IRB portfolios. Interestingly, the tendency to use the potentially more permissive SA is not related to the capitalisation of the bank but increases with the perceived riskiness of the borrower. In particular, exposures to sovereigns in the euro area periphery tend to be overwhelmingly under the SA, thus obtaining zero risk weights. This applies especially to banks with sovereign exposures exceeding 10% of their capital.
Banks assign to their own sovereign a considerably lower risk weight than do banks from other countries. The "home bias" is particularly pronounced for Portuguese, Spanish and Irish banks and somewhat less so for French, UK and Austrian banks.
For further discussion, see "Treatment of sovereign risk in the Basel capital framework", BIS Quarterly Review, December 2013, pp 10-11.
What is the appropriate policy response to the need to improve the reliability and comparability of RWA (Chapter V of last year's Annual Report)? The internal ratings-based (IRB) approach should remain a pillar of the regulatory framework. It provides an essential link to banks' own decision-making and it permits a natural and welcome diversity of risk assessments among banks. What is needed is to tighten the link to an objective measurement of the underlying risks and to improve supervisory safeguards. On the one hand, the introduction of the leverage ratio provides both a backstop to overly optimistic risk assessments and a useful alternative perspective on a bank's solvency. On the other hand, work under way to understand the drivers of unwanted variation in RWA points to the need to ensure rigorous supervisory validation of banks' models and to improve its cross-jurisdictional consistency. In addition, other policies, such as imposing tighter constraints on modelling assumptions and introducing greater disclosure about these assumptions, can also improve the comparability of RWA. These options would be superior to requiring a single regulatory model, such as a unique set of risk weights, which might encourage herding and risk concentration.
Insurance sector
Insurance companies, like banks, are recovering post-crisis. The crisis hit the core parts of the insurance companies, causing a sharp fall in the value of their investments and a slowdown in premium growth. Underwriters of credit derivatives also suffered losses. The recovery in premium growth and capital differs somewhat in the life and non-life segments and reflects firms' original asset composition.
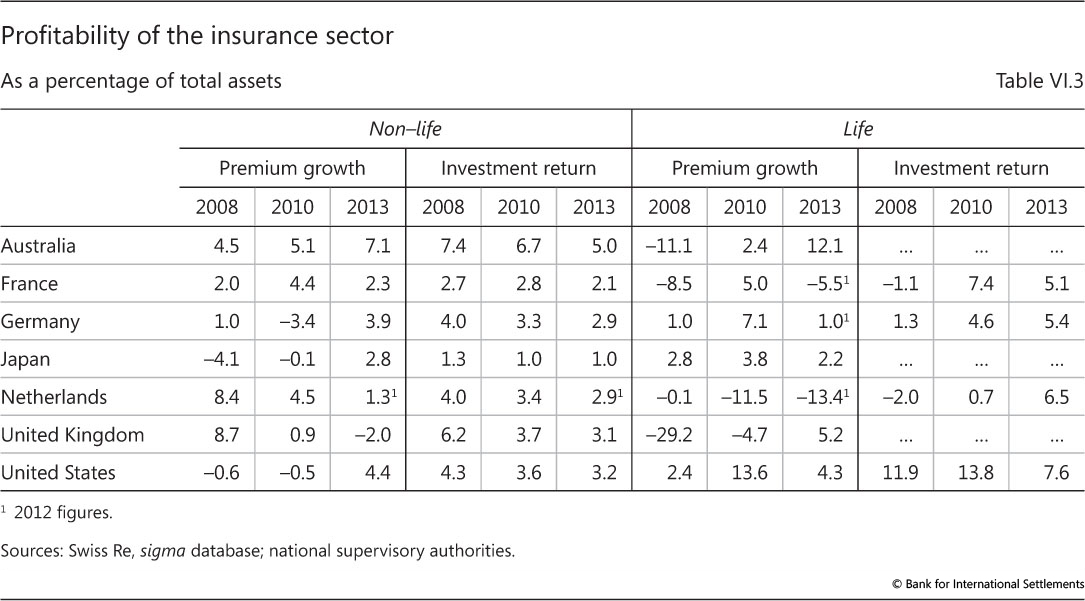
Property and casualty insurance firms absorbed the crisis-driven drop in asset values thanks to their ample capital buffers. At present, these buffers are being replenished via growing insurance premiums, which rebounded in most markets during the past couple of years (Table VI.3). Underwriting profitability, as measured by the combined ratio - the sum of underwriting losses, expenses and policyholders' dividends divided by premium income - is also improving, despite spikes in policy payouts due to natural disasters. The reinsurance sector has also strengthened its capitalisation and tapped alternative sources of capital. The market for catastrophe bonds, hard hit in the immediate crisis aftermath, recovered after 2010 and issuance is on the rise. Insurance premiums in EMEs continued to grow strongly, supported in many countries by an expanding economy, and are narrowing the sizeable gap in insurance product penetration with mature markets.
The recovery in the life insurance segment has been less strong than in the property and casualty segment. Life insurers suffered an additional blow during the crisis because of the combination of losses from embedded product guarantees and an increase in the valuation of liabilities driven by a decline in interest rates. While premium income is recovering from its sharp drop during the crisis, it is still growing less than benefit payments and surrenders.
Premium growth counteracted weak returns on investment portfolios. The low yields of high-quality bonds, a key asset class for insurers, remain a drag on investment revenue. Return on equity has recovered from its crisis trough, but remains below its historical average. A subdued growth outlook and low returns on other asset classes have triggered a search for yield by insurance companies, fuelling demand for riskier securities (Chapter II).
Changes in the regulatory framework tighten insurers' capital requirements and impose stricter constraints on the valuation of long-term assets and liabilities. This should increase the resilience of the sector. It might also whet insurers' appetite for fixed income securities with regular cash flow streams, including corporate debt.
Looking forward, insurers, and life insurers in particular, are exposed to interest rate risk. The limited supply of long-term investable assets amplifies this risk by exacerbating the duration mismatch of assets and liabilities. In this case, derivatives can provide a good hedge and insurers will benefit from reforms in over-the-counter market infrastructure that should reduce counterparty risk. But interest rate risk arises also from guarantees and other option-like elements of life insurance products with investment features. This risk is complex, more difficult to predict and harder to hedge. In this case, capital buffers are a better line of defence.
Bank versus market-based credit
The crisis and its aftermath halted the trend growth in bank-intermediated finance. In the advanced economies most affected by the crisis, bank credit to corporates has ceded ground to market-based financing. In EMEs, both sources have grown, with market-based financing registering the faster pace.
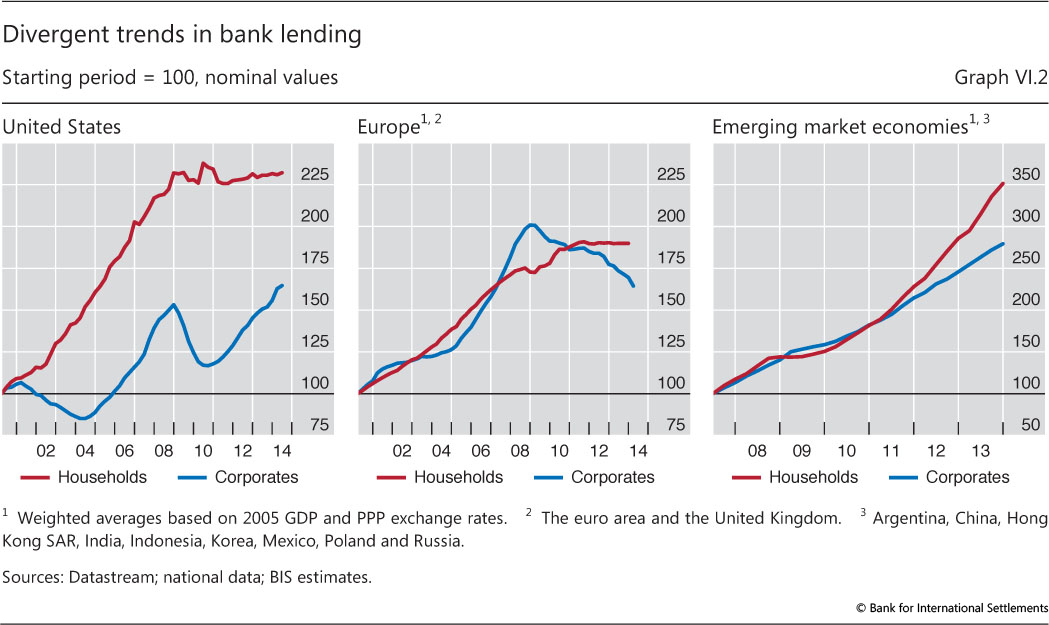
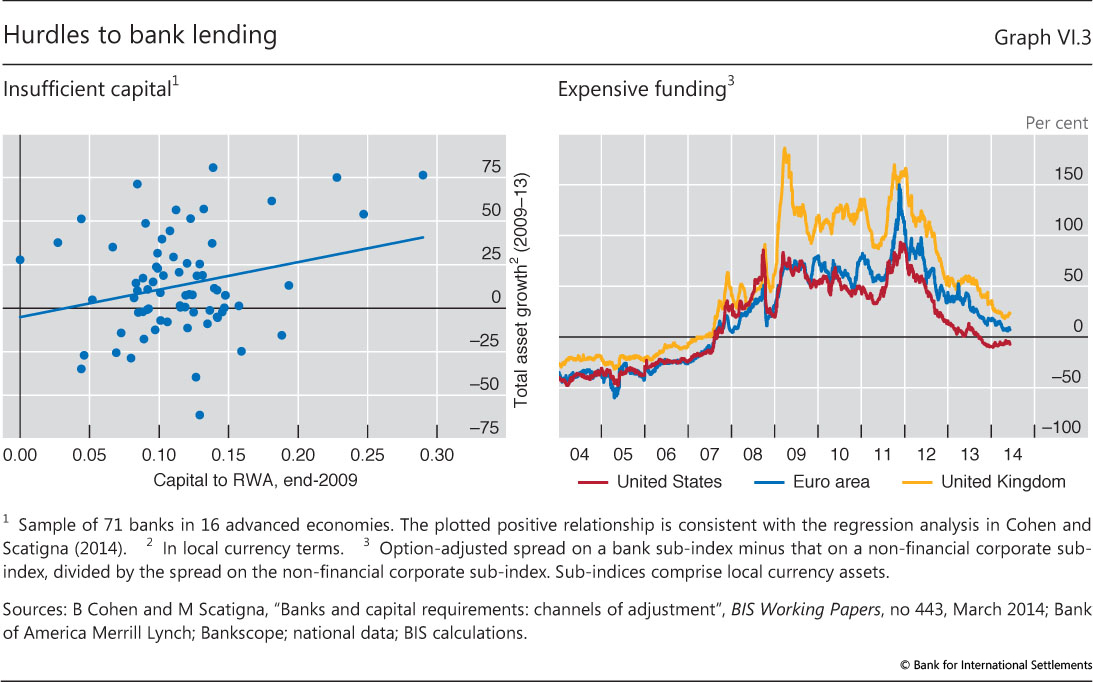
In the immediate crisis aftermath, banks in the hardest-hit economies pulled back from credit extension in order to nurse their balance sheets back to strength (Graph VI.2, left-hand and centre panels). Subsequently, these banks' lending to households remained flat, while that to the corporate sector declined, especially in Europe. Anaemic demand from overly indebted households and a weak economic recovery partly explain the stagnation of credit growth. But supply side factors also played a role. Banks with weak balance sheets were more reluctant to expand their activities (Graph VI.3, left-hand panel).
By contrast, bank credit has been buoyant in emerging market economies (Graph VI.2, right-hand panel). Credit to households has grown especially strongly, reflecting low interest rates and capital flows from crisis-hit economies.
In both advanced and emerging market economies, corporate borrowers have increasingly tapped bond markets. They have found eager investors, as in their search for yield asset managers have supplied financing at very attractive rates, which banks have been unable to match. In fact, banks are facing higher funding costs than corporate borrowers themselves (Graph VI.3, right-hand panel). This cost disadvantage is likely to persist as long as concerns about banks' health linger (see discussion below).
Investors' search for yield has also dented credit standards. The issuance of low-credit-quality instruments has surged (Chapter II). Sovereign bonds from the euro area periphery and hybrid bank debt instruments are cases in point.
Structural adjustments in the financial sector
The crisis has had a lasting impact on financial intermediaries worldwide. Compelled by the need to secure profitability, nudged by changes in the regulatory environment (Box VI.A) and motivated by market signals, many banks have been streamlining their business mix. In parallel, the asset management sector has grown to become an established player in the funding of investment. All this has reshaped the domestic and the international financial landscape.
Changes in business models
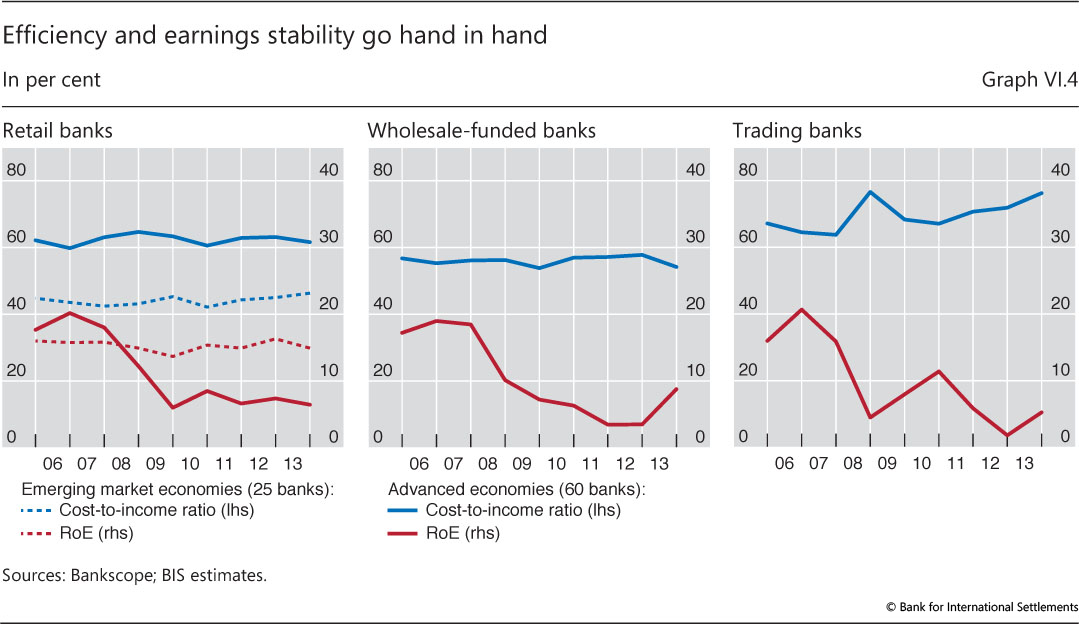
Analysis of bank-level balance sheets suggests that three business models provide a useful characterisation of a worldwide sample of large banks.2 Two of the models differ mainly in terms of the sources of banks' funding. Banks with a "retail" model obtain the bulk of their funding from retail depositors and engage mostly in plain vanilla intermediation, namely extending loans. "Wholesale-funded" banks also hold a large share of their assets in the form of loans, but rely strongly on the wholesale funding market. Finally, "trading" banks are particularly active on capital markets. Loans are a small share of their assets, they engage heavily in trading and investment banking, and they fund themselves predominantly with debt securities and interbank borrowing.
Performance and efficiency have varied markedly across business models over the past seven years (Graph VI.4). The onset of the crisis sent return-on-equity (RoE) plummeting for all bank business models in advanced economies (red lines). But while RoE stabilised for retail banks after 2009, it underwent drastic swings for trading and wholesale-funded banks. The story is qualitatively similar in terms of return-on-assets, an alternative metric that is largely insensitive to leverage. Despite trading banks' sub-par performance, high staff remuneration consistently inflated their cost-to-income ratios above those in the rest of the sector (blue lines). For their part, banks domiciled in EMEs, which had mainly adopted a retail model and were largely unscathed by the crisis, achieved stable performance on the back of greater cost efficiency than their advanced economy peers.
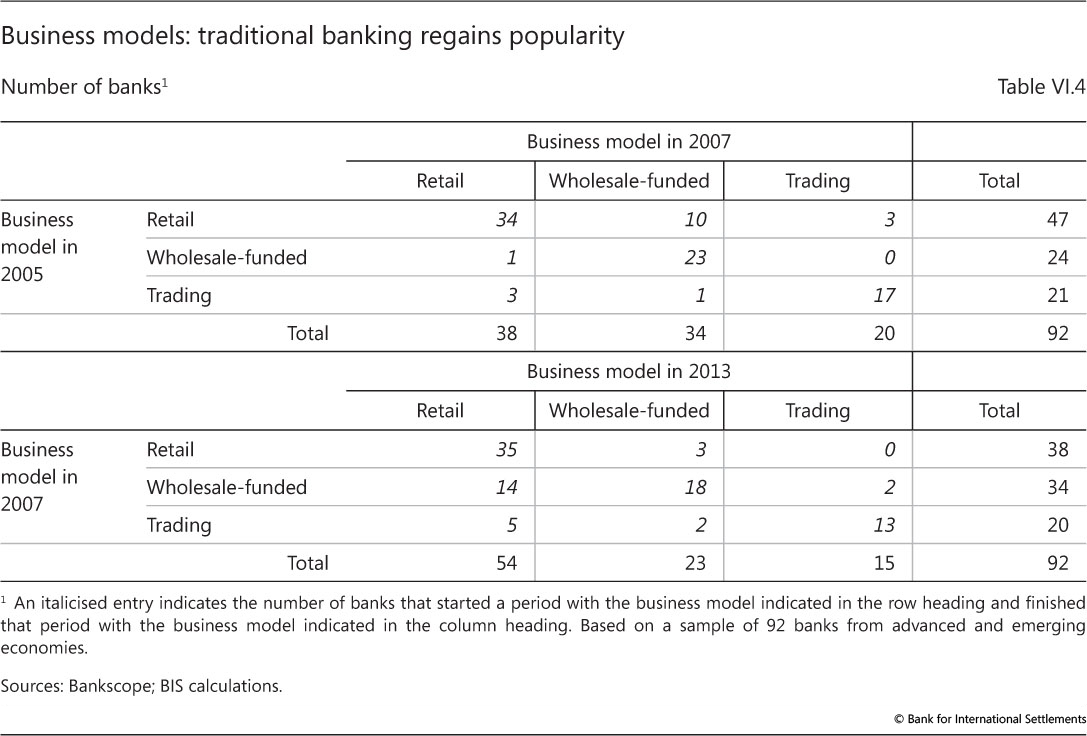
Many banks have adjusted their strategies post-crisis, in line with the business models' relative performance (Table VI.4). In the sample under study, one third of the institutions that entered the crisis in 2007 as wholesale-funded or trading banks (19 out of 54 institutions) ended up with a retail model in 2012. Meanwhile, few banks switched from retail to another business model post-crisis (three out of 38), confirming the relative appeal of stable income and funding sources. This recent trend stands in contrast to developments in the banking sector pre-crisis. From 2005 to 2007, only four of 45 banks switched to a retail model. In parallel, easy funding and high trading profits led a quarter of the banks with a retail model in 2005 (13 out of 47 institutions) to adopt another model by 2007.
Shifting patterns in international banking
A key aspect of internationally active banks' business model relates to the geographical location of their funding compared with that of their assets (Graph VI.5, left-hand panel). At one end of the spectrum are German and Japanese banks, whose international positions are mostly cross-border, largely funded in the home country. At the other end of the spectrum, Spanish, Canadian and Australian banks use foreign offices both to obtain funding and to extend credit within the same host country. Between these two extremes, Belgian and Swiss banks tap geographically diverse sources of funding and have large cross-border positions mostly booked in international financial centres, such as London, New York, Paris or the Caribbean.
International banking conducted through local offices in foreign countries has proved to be more resilient than cross-border banking over the past five years. This is evident in the positive relationship between the share of locally conducted intermediation in a banking system's foreign claims and the overall growth in these claims (Graph VI.5, right-hand panel). As a case in point, the foreign claims of Australian banks have increased markedly on the back of growing activity by offices in New Zealand and emerging Asia. Similarly, robust conditions in Latin America have allowed Spanish banks to increase their foreign claims, despite general pressure on European banks to reduce foreign lending in order to preserve capital for their home markets.

By contrast, cross-border activities came under strain when liquidity evaporated during the crisis, subjecting global financial markets to stress. Since then, cross-border bank lending has retreated, driving much of the decline in the foreign claims of Swiss and German banks over the past five years. In this context, the sizeable increase in Japanese banks' cross-border claims, mainly to US and emerging Asia residents, is a notable exception.
The ascent of the asset management sector
As banks reorganise their business lines and retreat from some capital market activities, market-based financial intermediaries have been gaining ground. The growth in the asset management sector is a case in point. Because asset managers are responsible for the investment of large securities portfolios, they can have a substantial impact on market functioning, on asset price dynamics and, ultimately, on the funding costs of governments, businesses and households.
AMCs manage securities portfolios on behalf of ultimate investors. They cater to both retail and wholesale customers. They manage the savings of households and handle the surplus cash balances of small businesses, but also manage large sums for institutional investors, such as corporate and public pension funds, insurance companies, corporate treasuries and sovereign wealth funds.
Arrangements vary widely in terms of product design and characteristics, in line with client funds' investment objectives. For example, open- and closed-end mutual funds pool individual investors' funds in larger portfolios that are managed collectively. By contrast, corporate and public sector pension funds can place money with AMCs in segregated accounts managed on the basis of mandates tailored to client needs. In most arrangements, AMCs do not put their balance sheets at risk in managing those funds. Rather, in exchange for a fee, they offer economies of scale and scope in the form of expertise in securities selection, transaction execution and timing, and portfolio administration. There are exceptions, though. For example, hedge funds actively manage portfolios following investment strategies that embody a high appetite for risk-taking and involve substantial leverage. The hedge fund manager has own funds at risk and is rewarded on the basis of performance. Similarly, a hidden form of leverage relates to the implicit reassurances of capital preservation made by money market funds. The AMC responsible for those funds might feel compelled to cover shortfalls due to bad portfolio performance. Explicit or implicit backing of a segregated fund's borrowing by the umbrella organisation managing the fund may also put the AMC balance sheet at risk.
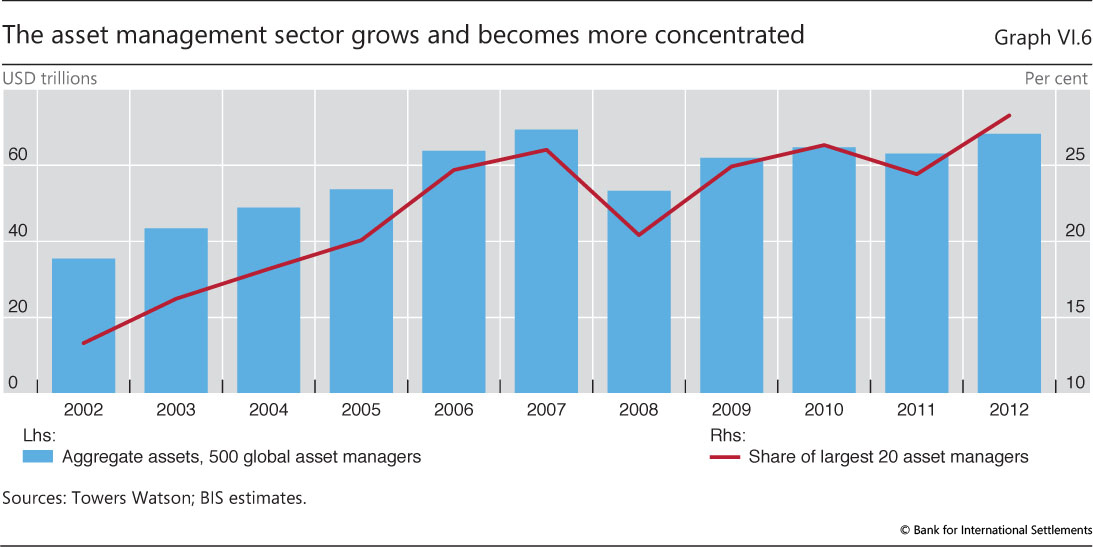
The asset management sector has grown substantially over the past several years. While the diversity in the profiles of AMCs and products complicates statistical measurement, estimates put the total assets under management at dozens of trillions of US dollars (Graph VI.6). Despite a brief decline in the size of the aggregate portfolio during the crisis, reflecting mainly a drop in valuations rather than client withdrawals, AMCs managed roughly twice as much money in 2012 as they did 10 years before.
The sector's growth has coincided with an increase in the market share of the largest players. That of the top tier of AMCs accounts for more than one quarter of the total assets under management (Graph VI.6, red line). Concentration is greatest at the very top, where a handful of firms dominate the rankings. Many of these top AMCs are affiliated with and/or operate under the same corporate umbrella as large, systemically important financial institutions.
The ascent of the asset management sector presents both opportunities and challenges for financial stability. On the one hand, strengthening market-based financial intermediation can provide a complementary channel to bank-based funding for businesses and households (see Box VI.C for an example). In fact, the growth in AMCs' portfolios mirrors the rebalancing of funding of the real economy away from banks and towards markets. Greater diversity in funding channels can be a strength, to the extent that one might compensate for supply problems in the other. That said, the nexus of incentives and objectives influencing the behaviour of AMCs can adversely affect market dynamics and funding costs for the real economy. Portfolio managers are evaluated on the basis of short-term performance, and revenues are linked to fluctuations in customer fund flows. These arrangements can exacerbate the procyclicality of asset prices, feeding the market's momentum in booms and leading to abrupt withdrawals from asset classes in times of stress.
Box VI.C
Financing infrastructure investment
Investment in infrastructure, if properly targeted and designed, can boost potential growth. Both emerging and advanced economies need to create, or upgrade, crucial transport and energy-related infrastructure. Overstretched fiscal positions set clear limits to the availability of public sector funding in many countries and put a premium on promoting private sector funding for such projects. Unlocking this potential requires a degree of certainty about project design and operation as well as diversity in financing instruments.
A key impediment to greater private sector funding is uncertainty about the pipeline of projects. The suitability of a project for private investors often hinges on the design of legal contracts that govern the distribution of risks and cash flows. Ill-structured contracts can lead to cost overruns and even failure. Political risks also loom large. For instance, a history of politically motivated changes to the prices that infrastructure operators can charge greatly increases the perception of such risks. Private financiers will bear the fixed costs of building up expertise if they can invest in well planned projects that are not subject to cancellation, or major revisions, during the long period of gestation and construction. Otherwise, less complex asset classes will be preferred.
Another factor that can attract long-term portfolio investors is greater diversity in financing instruments. Infrastructure bonds, for instance, are potentially attractive to pension funds and insurance companies. Over the long life cycle of infrastructure projects, these bonds' credit risk tends to subside more rapidly than that of comparable corporate bonds (Graph VI.C, left-hand panel). The bonds also tend to exhibit greater ratings stability and higher recoveries in the event of default. Specialised investment vehicles, such as infrastructure funds, can also attract new investors by offering diversification possibilities across projects in different sectors and countries. Nevertheless, bank loans remain the main form of debt financing for infrastructure (Graph VI.C, right-hand panel). While loans have some advantages in the construction and early operational phases, bonds could be used more widely for seasoned projects or the privatisation of existing infrastructure. In EMEs, their issuance is tied to the development of onshore local currency markets.
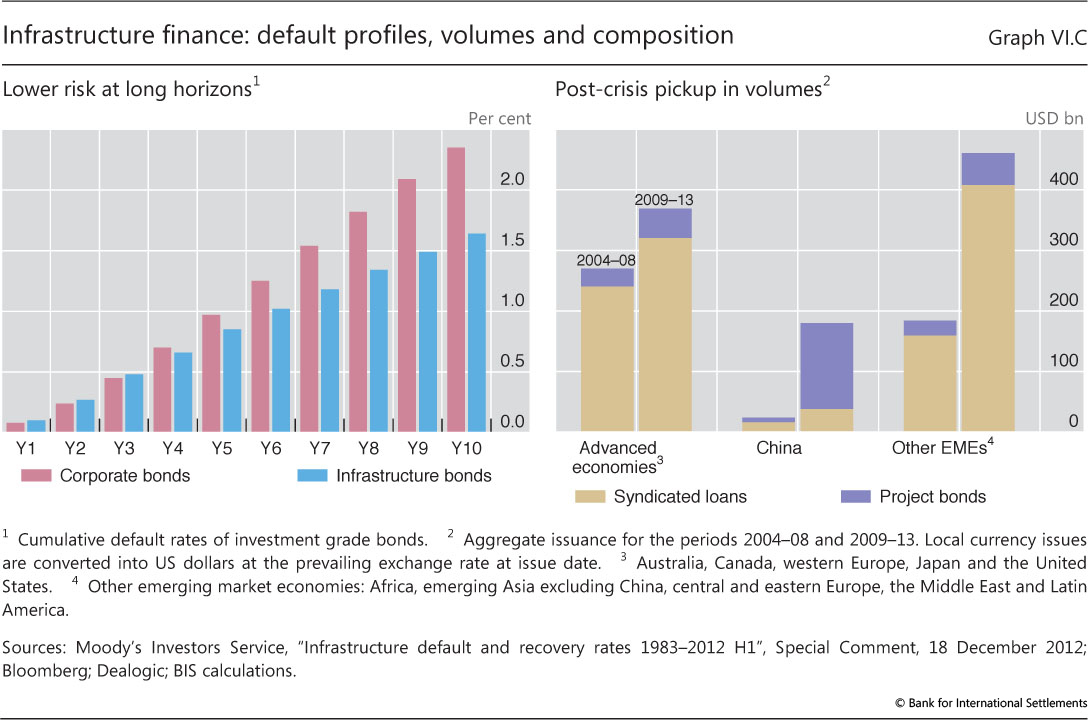
Hence, longer-term infrastructure debt is not necessarily riskier than its shorter-term counterpart. See M Sorge, "The nature of credit risk in project finance", BIS Quarterly Review, December 2004, pp 91-101. For more detail, see T Ehlers, F Packer and E Remolona, "Infrastructure and corporate bond markets in Asia", in A Heath and M Read (eds), Financial Flows and Infrastructure Financing, proceedings of the Reserve Bank of Australia annual conference, March 2014.
Greater concentration in the sector can strengthen this effect. Single firms in charge of large asset portfolios may at times exert disproportionate influence on market dynamics. This is especially true when different managers within the same organisation share research and investment ideas, and are subject to top-down risk assessments. Reduced diversity in the marketplace weakens the system's ability to deal with stress. Another concern arising from concentration is that operational or legal problems at a large AMC may have disproportionate systemic effects.
How strong are banks, really?
Banks still need to take important steps to buttress their resilience and ensure the long-term sustainability of their business models. In order to regain markets' confidence, institutions from a number of crisis-hit countries must further repair their balance sheets by recognising losses and recapitalising. This would reduce their funding costs and strengthen their intermediation capacity. At the same time, banks operating in, or exposed to, countries with recent financial booms should avoid excessive expansion and ensure that they have enough loss-absorbing capacity to face a turning financial cycle (Chapter IV).
Banks in post-crisis recovery
Banks directly affected by the financial crisis have not yet fully recovered. Even though their capital positions have improved (see above), analysts and markets remain sceptical. Downbeat perceptions drive banks' stand-alone ratings, which capture inherent financial strength and factor out explicit and implicit guarantees from an institution's parent or sovereign, as well as all-in ratings, which gauge overall creditworthiness. Scepticism is also evident in the valuation of certain banks' equity and in the spreads markets charge for bank debt.
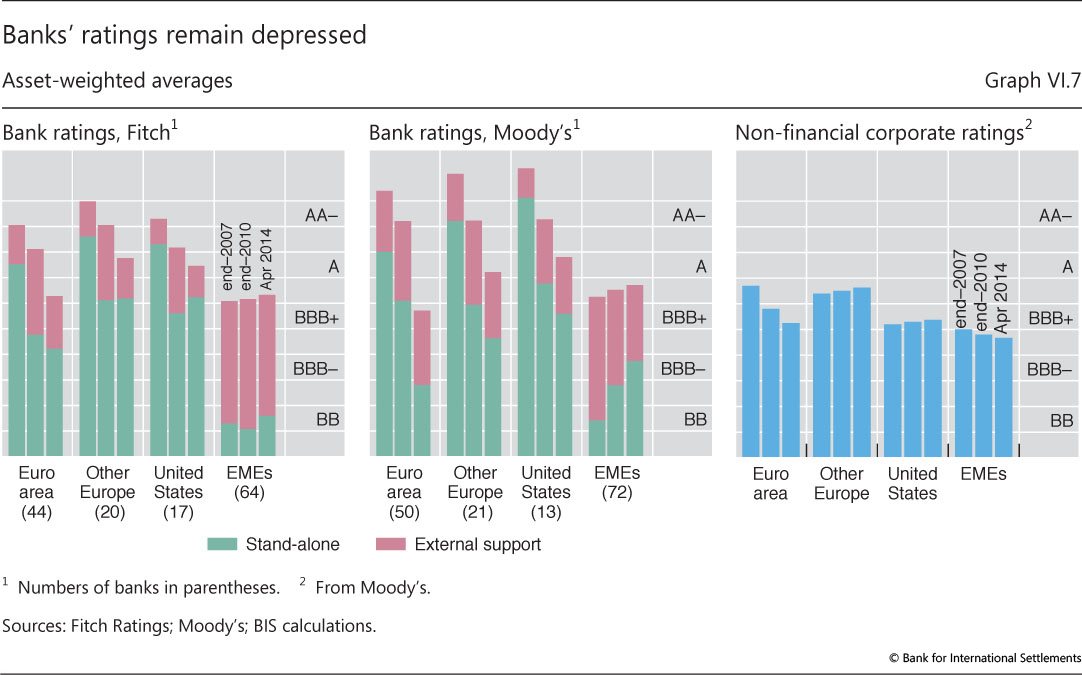
In April 2014, the stand-alone ratings of banks on both sides of the Atlantic stood several notches below their pre-crisis levels (Graph VI.7, left-hand and centre panels, green bar segments). The crisis exposed these banks' 2007 ratings as overly optimistic, triggering a wave of large downgrades. The major rating agencies' assessments of banks' inherent health continued to deteriorate even past 2010, showing only marginal signs of improvement more recently.
Low and deteriorating stand-alone ratings can undermine confidence in the banking sector. For one, they cast doubt on banks' own assessments that their financial strength has been improving. They also imply that banks need to rely more than in the past on external support to improve their creditworthiness. But, facing financial problems of their own or trying to reduce taxpayers' exposure to financial sector risks, sovereigns have had less capacity and have expressed a reduced willingness to provide such support. As a result, banks' all-in ratings have deteriorated in step with, or by more than, stand-alone ratings (Graph VI.7, left-hand and centre panels, combined height of green and red bar segments).
Price-based indicators from credit and equity markets also reveal scepticism, especially about euro area and UK banks. Given credit ratings in the non-financial corporate sector (Graph VI.7, right-hand panel), this scepticism has resulted in a positive wedge between the banks' funding costs and what their potential customers can obtain on the market (Graph VI.3, right-hand panel). Coupled with a slow recovery of the interbank and repo markets, this has weakened banks' cost advantage, thus causing them to lose ground to market-based intermediation. Likewise, euro area and UK banks' price-to-book ratios have remained persistently below one, in contrast to those of US banks, which seem to have regained market confidence (Graph VI.8, left-hand panel).
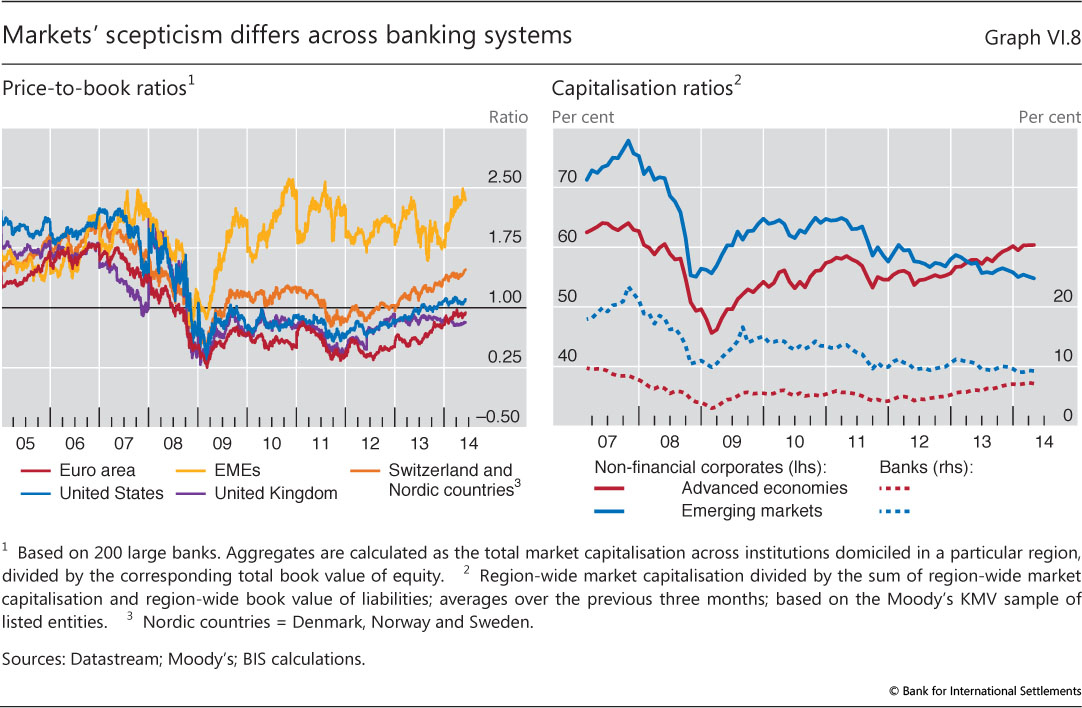
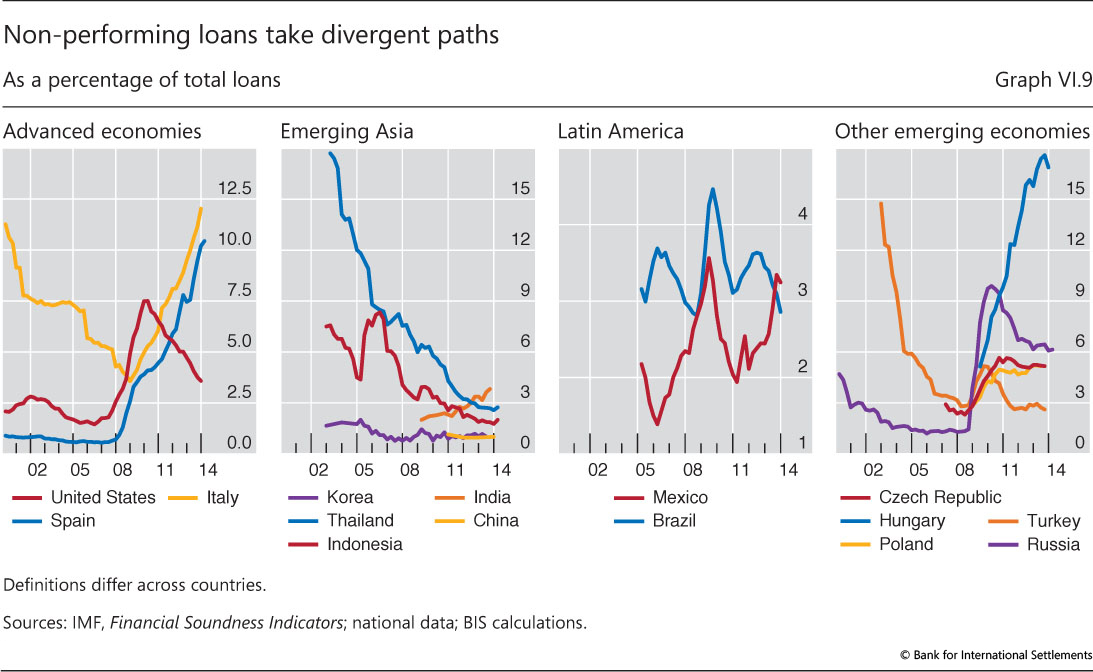
Despite post-crisis capital-raising efforts, doubts remain about the quality of certain banks' balance sheets. More fresh capital has supported an upward trend in banks' market capitalisation, both in absolute terms and relative to the book value of liabilities (Graph VI.8, right-hand panel, red lines). However, the capacity of capital to absorb future losses is severely undermined by unrecognised losses on legacy assets. Unrecognised losses distort banks' incentives, diverting resources towards keeping troubled borrowers afloat and away from new projects. And as these losses gradually come to the surface, they raise banks' non-performing loan (NPL) ratios. In the euro area periphery countries, NPL ratios have continued to rise, almost six years after the apex of the crisis (Graph VI.9, left-hand panel), while new lending has remained subdued. Similarly, banks in central Europe have reported stubbornly high and, in some cases, rapidly increasing NPL ratios since 2008 (Graph VI.9, right-hand panel).
In the United States, non-performing loans tell a different story. After 2009, the country's banking sector posted steady declines in the aggregate NPL ratio, which fell below 4% at end-2013. Coupled with robust asset growth, this suggests that the sector has made substantial progress in putting the crisis behind it. Persistent strains on mortgage borrowers, however, kept the NPL ratios of the two largest government-sponsored enterprises above 7% in 2013.
Enforcing balance sheet repair is an important policy challenge in the euro area. The challenge has been complicated by a prolonged period of ultra-low interest rates. To the extent that low rates support wide interest margins, they provide useful respite for poorly performing banks. However, low rates also reduce the cost of - and thus encourage - forbearance, ie keeping effectively insolvent borrowers afloat in order to postpone the recognition of losses. The experience of Japan in the 1990s showed that protracted forbearance not only destabilises the banking sector directly but also acts as a drag on the supply of credit and leads to its misallocation (Chapter III). This underscores the value of the ECB's asset quality review, which aims to expedite balance sheet repair, thus forming the basis of credible stress tests.
The goal of stress tests is to restore and buttress market confidence in the banking sector. Ultimately, though, it is banks' capacity to assess their own risks that would support this confidence on a continuous basis. Hence the importance of policy initiatives to promote transparent, reliable and internationally harmonised risk measurement systems and enhanced disclosure.
Banks in a late financial boom phase
In countries with recent financial booms, banks may be weaker than they appear. This concern applies mainly to institutions exposed to those emerging market economies where perceptions of a benign credit outlook and strong earnings potential have ridden on an unstable leverage-based expansion. A similar concern applies to bank operations in certain advanced economies, such as Switzerland and the Nordic countries, where strong valuations (Graph VI.8, left-hand panel) may be reflecting fast credit growth and frothy property prices (Chapter IV).
Several indicators deliver an upbeat message about EME banks. For one, the NPL ratios of banks domiciled in parts of emerging Asia and Latin America have been low and declining, standing at around 3% or lower at end-2013 (Graph VI.9, second and third panels). In this context, Indian banks' rising NPL ratios are an exception. In addition, the credit ratings that both Fitch and Moody's assign to large EME banks have remained stable and even improved slightly on aggregate since 2007 (Graph VI.7). And the corresponding price-to-book ratios have been high, hovering around 2 over the past five years (Graph VI.8, left-hand panel).
That said, such indicators failed to signal vulnerabilities in the past. Because of their backward-looking nature, NPL ratios did not pick up in advanced economies until 2008, when the crisis was already under way (Graph VI.9, left-hand panel). Similarly, pre-crisis credit ratings and market valuations did not warn about the imminent financial distress.
In contrast, measures of credit expansion and the speed of property price inflation, which have been reliable early warning indicators, are flashing red lights about a number of emerging market economies at the current juncture (Chapter IV). These warnings are echoed by capitalisation ratios, which equal the market value of equity divided by the book value of liabilities (Graph VI.8, right-hand panel, blue lines). On the back of leverage-based balance sheet growth, these ratios have declined steadily on aggregate for both banks and non-financial corporates (NFCs) in EMEs. Thus, any event that triggers investor scepticism would depress capitalisation ratios from a low starting point, potentially endangering financial stability. The EME NFC sector is an important part of the picture not only because it is the main source of credit risk to domestic banks but also because it has recently entered the intermediation chain (Chapter IV).
In a sign of growing investor scepticism, Chinese banks' price-to-book ratios have diverged from those of EME peers and have been declining over the past five years. Explicit and implicit links between regulated and shadow banks have contributed to this scepticism. National data indicate that non-bank credit to private NFCs grew sevenfold between mid-2008 and end-2013, thus increasing its share in the country's total credit from 10% to 25%. The fragilities accompanying this rapid rise surfaced in a number of near and outright defaults among China's shadow banks and contributed to a drastic reduction in the country's credit supply in the first quarter of 2014. Industry analysts expect such strains to have repercussions on banks, not least because they have acted as issuers and distributors of shadow banking products.
Authorities in EMEs need to alert banks to the scale of current risks, enforce sound risk management and strengthen macroprudential measures. For one, the deteriorating growth outlook in these economies calls for a downward revision of earnings forecasts. In addition, EME authorities will need to cope with the fallout from the phasing-out of monetary accommodation in advanced economies. The resulting market tensions (Chapters II and IV) have highlighted the importance of proper management of interest and exchange rate risk. More generally, the build-up of financial vulnerabilities underscores the importance of not being lulled into a false sense of security and of reassessing previously used macroprudential tools (Box VI.D). Emerging market economies have been early adopters of such tools and have gained extensive experience regarding their operation and effectiveness. This experience can be the basis for further refinements and improvements to the macroprudential policy framework.
Box VI.D
The effectiveness of countercyclical policy instruments
Policies that address macro-financial vulnerabilities require effective instruments that take a system-wide perspective. In recent years, several jurisdictions have strengthened the systemic orientation of their prudential framework by redesigning existing, and introducing new, macroprudential policy tools to mitigate the risks arising from the financial cycle. Similar tools have been incorporated in international standards. Even though it is premature to seek firm conclusions about the effectiveness of newly introduced tools, such as countercyclical capital buffers, the historical experience of some jurisdictions with similar tools provides a useful context.
The yardstick for the assessment of instrument effectiveness is tied to the objective of the policy. In the case of countercyclical tools, there are two complementary objectives. The first, narrower, one is to protect financial institutions from the effects of the cycle. The second, broader, objective is to tame the financial cycle. Success in the narrow objective does not guarantee success in the broader one, as policymakers' experience so far with the most prominent countercyclical instruments confirms.
Capital buffers and dynamic provisions
A number of jurisdictions have introduced a countercyclical capital requirement in order to increase banks' resilience in the face of risk built up during credit booms. Switzerland activated the tool in 2013 with a focus on the domestic mortgage market. The early signs are that the tool is more effective in strengthening banks' balance sheets than in slowing down mortgage credit growth or affecting its cost. This mirrors Spain's experience with dynamic provisioning. More ample provisions helped Spanish banks to partially buffer the impact of the bust in the property market, but did not prevent the bubble from inflating in the first place.
Loan-to-value (LTV) and debt service-to-income (DSTI) ratios
These tools have a longer track record in a number of jurisdictions. The evidence indicates that they help to improve banks' resilience by increasing that of borrowers. A number of studies find that tighter LTV caps reduce the sensitivity of households to income and property price shocks. The impact on the credit cycle is less well documented, but experience suggests that tightening LTV and DSTI caps during booms slows real credit growth and house price appreciation to some extent. In particular, a typical tightening of the maximum DSTI ratio generates a 4-7 percentage point deceleration in credit growth over the following year. But relaxing the constraint has a more ambiguous effect.
Time-varying liquidity requirements / reserve requirements
Similarly to capital, the impact of higher liquidity buffers on the resilience of banks is self-evident. There is also evidence that liquidity-based macroprudential tools can effectively enhance the system's resilience. The evidence on the impact of liquidity-based tools in curbing the credit cycle is not as strong. Studies assessing the impact of higher reserve requirements find that lending spreads increase and lending shrinks, but that the effects do not last.
See S Claessens, S Ghosh and R Mihet, "Macro-prudential policies to mitigate financial system vulnerabilities", Journal of International Money and Finance, vol 39, December 2013, pp 153-85; and K Kuttner and I Shim, "Can non-interest rate policies stabilise housing markets? Evidence from a panel of 57 economies", BIS Working Papers, no 433, November 2013. For a study of the net stable funding ratio, see BCBS, An assessment of the long-term economic impact of stronger capital and liquidity requirements, August 2010.
1 See BCBS, Regulatory Consistency Assessment Programme - second report on risk-weighted assets for market risk in the trading book, December 2013; and BCBS, Regulatory Consistency Assessment Programme - analysis of risk-weighted assets for credit risk in the banking book, July 2013.
2 For a description of a method that identifies the number of business models and assigns each bank in the sample to a model, see R Ayadi, E Arbak and W de Groen, Regulation of European banks and business models: towards a new paradigm?, Centre for European Policy Studies, 2012.