BIS international banking statistics and global liquidity indicators at end-June 2021

Key takeaways
- Banks' cross-border claims declined by $308 billion during the second quarter of 2021, settling at $36 trillion. Their year-on-year growth rate edged up to 2%.
- In contrast, cross-border claims on emerging market and developing economies (EMDEs) expanded in the second quarter (by $7 billion), driven by greater credit to the Asia and Pacific region, as well as to Africa and the Middle East.
- Banks' consolidated foreign claims on China alone stood at more than $970 billion at end-Q2 2021, representing almost 18% of foreign claims on EMDEs.
- The share of offshore claims – ie claims denominated in a currency foreign to both the lending bank and borrower – has continued to fall in major currencies.
- Foreign currency credit growth, an indicator of global liquidity, held up for credit to non-residents denominated in US dollars and euros. Yen-denominated credit, particularly to EMDEs, slumped. The rate of growth in credit to residents returned to pre-pandemic levels while bond financing continued to outpace bank lending.
Cross-border claims decline in the second quarter of 2021
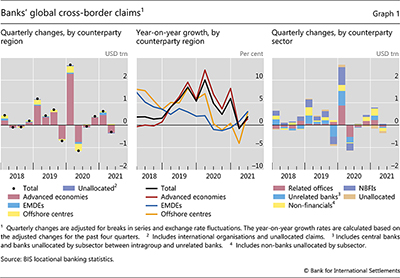
The BIS locational banking statistics (LBS) show that internationally active banks' cross-border claims declined by $308 billion during the second quarter of 2021 (Graph 1, left-hand panel).1 This left the stock outstanding at $36 trillion. Despite the quarterly drop in Q2, the year-on-year (yoy) growth rate of cross-border claims edged up from –1% to +2% due to a positive base effect following the sharp contraction a year earlier at the onset of Covid-19 (centre panel). Claims on EMDEs and offshore centres expanded by 3% yoy each.
The drop in cross-border claims in Q2 2021 was almost entirely due to falling claims on advanced economies (AEs, –$338 billion) (Graph 1, left-hand panel). Claims on non-banks in AEs fell by $140 billion, mostly driven by banks located in Japan (–$150 billion). The drop reported by these banks was mainly vis-à-vis non-bank borrowers in the United States, reflecting recurrent factors. In particular, the decline in Q2 2021 follows an outsized increase during the previous quarter; this pattern, which straddles the fiscal year-end in Japan in March, has been evident for several years.
Cross-border claims make up the bulk of international banking activity, which also includes local claims (on residents) in foreign currency.2 Examining international claims separately by currency shows the extent to which overall growth is driven by either banks and borrowers located inside the respective currency area as opposed to those located outside. Graph 2 provides an overview of international claims denominated in three major currencies – the US dollar, the euro and the Japanese yen – and highlights three market segments for each.3
International claims denominated in US dollars reached $19 trillion at end-Q2 2021 (top left-hand panel), continuing the relatively sustained growth observed since 2011. During much of the past decade, offshore claims – or claims denominated in a currency that is foreign to both the lending bank and the borrower (green area) – drove the overall expansion in dollar-denominated international claims. But since late-2018, cross-border dollar claims on borrowers in the United States (red area) and, to a lesser extent, cross-border claims of banks in the United States on borrowers abroad (blue area), have grown more rapidly. As a result, the share of offshore dollar claims in total dollar international claims has fallen from 62% in mid-2018 to less than 57% in mid-2021 (top left-hand panel).
Claims denominated in euros have exhibited a similar pattern in recent years. Euro claims reached $12 trillion in Q2 2021, up from $9 trillion in early 2017 (top centre panel). Growth in international euro claims was fuelled by claims on borrowers in the euro currency area (which includes cross-border positions within the euro area). Such claims grew at 3% yoy in Q2 2021 (bottom centre panel), contrasting with negative growth rates in the other market segments. As a result, offshore euro claims fell from 20% of total euro-denominated international claims in mid-2018 to 16% in mid-2021 (top centre panel).
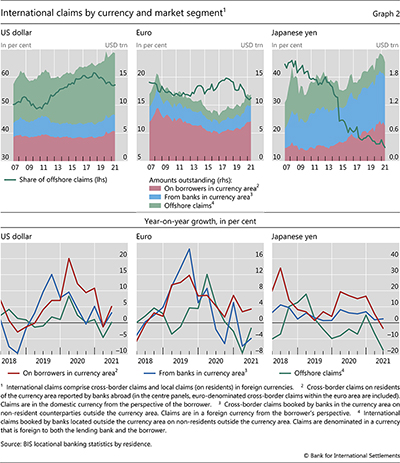
The shift away from offshore claims has been even more pronounced and longer lasting for claims denominated in Japanese yen. Overall, yen-denominated claims grew rapidly since 2015, exceeding $2 trillion at end-Q2 2021 (top right-hand panel). This growth has reflected an increase in yen claims of banks located in Japan on borrowers elsewhere, with a sustained expansion observed since at least 2018 (bottom right-hand panel, blue line). The same is true for borrowers in Japan, with a double-digit growth rate recorded in 2020 (red line). By contrast, offshore yen claims have continued to contract, driving the offshore share in the global total to less than 15% by mid-2021, from roughly 40% in the early 2010s.
Claims on China drive overall growth in claims on EMDEs
Banks' cross-border claims on emerging market and developing economies (EMDEs) grew modestly (+$7 billion) in the second quarter of 2021, following a surge in the first quarter (Graph 3, left-hand panel). Cross-border claims on Latin America and emerging Europe contracted modestly in Q2. By contrast, claims on Asia and Pacific and Africa and the Middle East expanded (left-hand and centre panels). Overall, the yoy growth rate of claims on all EMDEs moved further into positive territory (+3%).
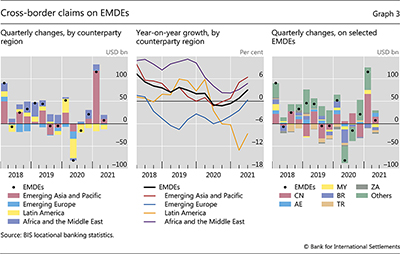
Claims on Latin America continued to decline in Q2 2021 (–$10 billion), albeit by less than in the previous quarter. This brought the total decline for Latin America over the past four quarters to more than $50 billion, or –9% in terms of yoy growth. Claims on most major countries in Latin America have continued to contract during Q2, including those on Brazil (–$7 billion), Chile and Colombia (–$1 billion each), as well as those on Venezuela and Mexico (about –$0.5 billion each).
Claims on emerging Europe also contracted by $2 billion, after expanding by more than $1 billion in the previous quarter. This was due to a drop in claims on Turkey (–$5 billion) and Russia (–$2 billion), reported mainly by banks located in the United Kingdom, France and the Netherlands. In contrast, claims on both the Czech Republic and Poland expanded by more than $1 billion.
Turning to Africa and the Middle East, the region continued to attract cross-border claims at the rate of 5% yoy, with $9 billion in new claims in Q2. This expansion was mainly driven by claims on the United Arab Emirates (+$9 billion) and to a lesser extent on Egypt, Kuwait and Qatar (+$2 billion each); it was partly offset by a drop in claims on South Africa and Liberia (–$3 billion each).
Cross-border claims on the Asia and Pacific region grew again during the second quarter (+11 billion, +6% yoy). As in the first quarter, the increase mainly represented new claims on China (+$15 billion), the largest EMDE borrower by far (Graph 3, right-hand panel). Reporting banks in Macao SAR, Hong Kong SAR and the United Kingdom expanded their claims on China the most (+$34 billion combined), channelling funds mainly to non-financials. Elsewhere in the region, cross-border claims on Malaysia, Indonesia and Thailand declined.
Recent media coverage of Chinese real estate has focused attention on banks' exposures to that sector. The BIS consolidated banking statistics (CBS), which track the globally consolidated exposures of individual banking systems, can shed light on their exposures by sector and type to China (Graph 4), and on which creditor banking systems incurred the largest exposures (Graph 5).4
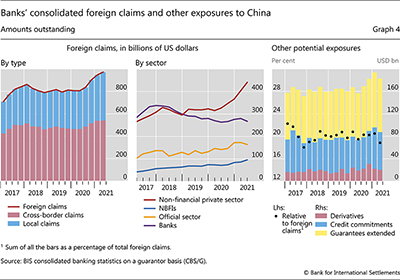
Global banks' overall consolidated foreign claims on China, which include their cross-border claims as well as local claims booked by their affiliates in China, topped $970 billion in mid-2021 (Graph 4, left-hand panel). This is more than double the foreign claims on other major EMDEs such as Mexico (about $400 billion), Brazil and Korea (over $350 billion each). Indeed, claims on counterparties in China accounted for some 18% of reporting banks' total foreign claims on all EMDEs combined.
On the borrowing side, global banks have increasingly channelled funds to the non-financial private sector in China (Graph 4, centre panel, red line). Their claims on this sector reached almost $450 billion, up some 40% since early 2020. Over the same period, their exposures to non-bank financial institutions and to the official sector (which in the CBS includes general government and the central bank) have grown by 31% and 12%, respectively. By contrast, banks' foreign claims on unrelated banks in China (purple line) have trended down, dropping to less than 30% of total foreign claims in Q2, from 40% at end-2017.
Banks also have other potential exposures to China, and these amounted to more than $180 billion at end-Q2 2021 (Graph 4, right-hand panel). Such exposures include guarantees extended (yellow bars), undisbursed credit commitments (blue bars) and derivatives with positive market value (red bars). Combined, these potential exposures amounted to nearly 20% of banks' total foreign claims on China (black dots).
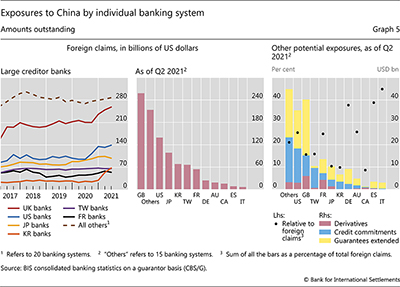
Exposures to China were concentrated in a handful of banking systems (Graph 5, left-hand panel). UK banks, the largest creditors to China, had exposures of $258 billion by mid-2021, up by more than 20% since end-2019. Including their other potential exposures to China added another $40 billion, or 16% to the UK banks' total foreign claims (right-hand panel, "GB" bar). US banks and, to a lesser extent, Japanese banks also reported elevated exposures, amounting to $139 billion and $99 billion respectively in on-balance sheet claims alone. Banks headquartered in Korea and Chinese Taipei held $68 and $66 billion in foreign claims respectively while French banks reported $54 billion in foreign claims (centre panel).
1 Claims include loans, holdings of debt securities and derivatives with a positive market value.
2 International claims comprise cross-border claims in any currency and local claims on residents of BIS reporting countries denominated in currencies foreign to those residents. The BIS aggregate of international claims will understate the global total since (a) some BIS reporting countries do not report local positions in foreign currencies (eg the United States and China); and (b) the BIS statistics do not capture the international claims of banks in non-reporting countries.
3 For the US dollar, the three segments are (1) claims of banks in the United States on borrowers abroad; (2) claims of banks outside the United States on US residents; and (3) claims of banks outside the United States on borrowers outside the United States. For a discussion, see "Seven decades of international banking", BIS Quarterly Review, September 2021.
4 The CBS capture the worldwide consolidated positions of internationally active banking groups headquartered in reporting countries, which include the claims of banks' foreign affiliates but exclude intragroup positions. The LBS capture unconsolidated positions of internationally active banks located in reporting countries, including intragroup positions between offices of the same banking group. For more details, see "Introduction to BIS statistics", BIS Quarterly Review, September 2015.