BIS international banking statistics at end-September 2020
- Global cross-border claims changed little in aggregate in Q3 2020 after large fluctuations in Q1 and Q2.
- Cross-border claims on emerging market and developing economies continued to fall, driven again by claims on Latin America and the Caribbean.
- Since the start of the pandemic, the size of banks' balance sheets has increased sharply with the accumulation of claims on governments and monetary authorities.
- A new interactive chart for visualising bilateral cross-border positions based on the locational banking statistics is now available online.
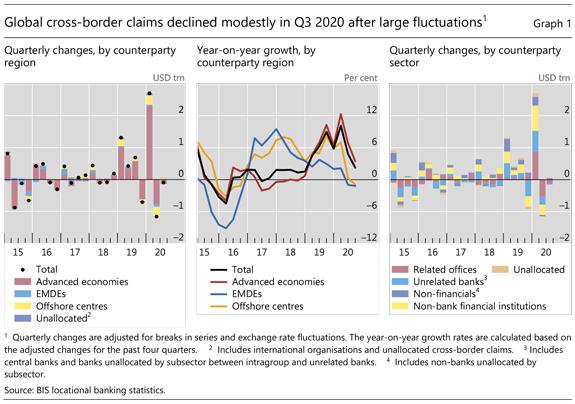
Global cross-border claims barely budged
Banks' cross-border claims registered a modest contraction of $93 billion in the course of Q3 2020 on an FX- and break-adjusted basis (Graph 1, left-hand panel). This quarterly contraction was quite muted (0.3% of previous quarter stock) compared with the large fluctuations in Q1 and Q2 2020, of +$2.7 trillion and –$1.2 trillion, respectively. Year-on-year growth rates continued to fall from their recent Q1 2020 peak, when cross-border positions had surged (centre panel).
Claims on both advanced economies (AEs, –$131bn) and emerging market and developing economies (EMDEs, –$13bn) declined. As earlier in the year, these movements were in part driven by intragroup positions (Graph 1, right-hand panel). The decline in claims on AEs centred on related offices (–$114bn), especially on those in the United States (–$81bn). The unwinding of central bank dollar swap lines, which had swelled intragroup positions in Q1, contributed to this decline.1 By contrast, claims on offshore centres expanded by $41bn (left-hand panel), especially vis-à-vis Hong Kong SAR (+$39bn) and the Cayman Islands (+$24bn). More than half of the increase on Hong Kong was in the form of intragroup claims.
Some of the larger movements vis-à-vis AEs involved non-bank financial institutions (NBFIs). Claims on the United Kingdom (–$50bn), the Netherlands (–$50bn), Luxembourg (–$46bn), France (–$40bn) and Italy (–$39bn) all fell, mostly vis-à-vis NBFIs. These declines were partly offset by increases in claims on Japan (+97bn) and Germany (+65bn), notably on their resident banks and NBFIs.
The modest aggregate decline also conceals large differences on the creditor side. Banks located in China, France and the United Kingdom saw the greatest increases in cross-border claims while those in Spain , Germany and the United States reported outsize declines.
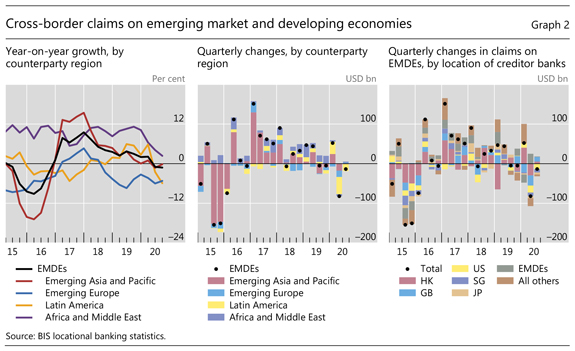
Cross-border claims on EMDEs continued to fall
Cross-border claims on EMDEs contracted for the second consecutive quarter in Q3 2020, by $13 billion, and their year-on-year growth remained negative (Graph 2, left-hand panel).2 Although smaller than in Q2, the quarterly decline was again driven by claims on borrowers in Latin America (–$17bn, centre panel). More than three-quarters of the drop was on the major economies in the region, ie Brazil, Mexico, Chile, Colombia and Argentina. Claims on non-financial corporations in these countries fell the most.
During the pandemic, creditor banks located in AEs and offshore centres have reported a large contraction in their cross-border claims on EMDEs, while creditor banks within EMDEs reported a modest expansion. As a result, global cross-border claims on EMDEs declined by a combined $95 billion during the second and third quarters of 2020. Major AE and offshore creditors to EMDEs, such as banks located in the United States, the United Kingdom, Hong Kong SAR, Singapore and Japan, reduced their lending by a combined $97 billion during this period (Graph 2, right-hand panel). By contrast, banks in EMDEs booked a $26 billion increase in cross-border claims on EMDEs during the past two quarters. Banks in emerging Asia-Pacific, mainly China and Chinese Taipei, led the expansion.
Claims on the official sector have surged since the start of pandemic
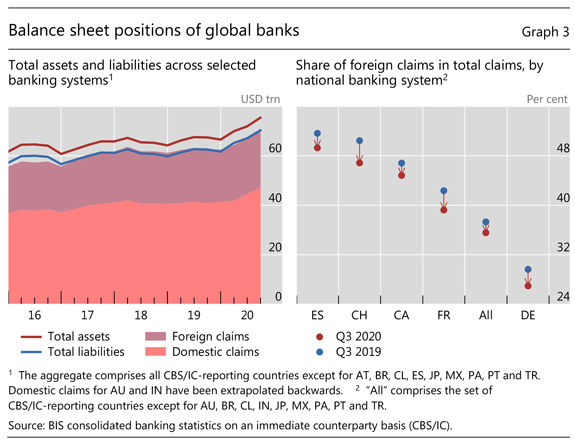
The fluctuations in cross-border positions provide but a partial picture of how internationally active banks' balance sheets have evolved during the Covid-19 pandemic. A more comprehensive view based on the BIS consolidated banking statistics (CBS), which track the globally consolidated positions of banks headquartered in a given country (net of inter-office positions), shows that their total assets and liabilities have actually surged since the same period last year (Graph 3, left-hand panel). The total assets of banks headquartered in 22 BIS reporting countries grew from $67 trillion at end-Q3 2019 to $75 trillion by the third quarter of 2020, a 12% increase.3 Total liabilities followed a similar pattern.
The bulk of the increase in claims was in domestic positions (ie claims on residents of the reporting banks' home country). Compared with the same period (Q3) the year before, banks' consolidated total claims have increased by $8 trillion in aggregate, almost 80% of this is on their home country borrowers. This pattern was evident across many banking systems. By contrast, banks' foreign claims – ie cross-border claims and local claims booked by their affiliates located abroad – contributed only 20% to the increase during this period.4
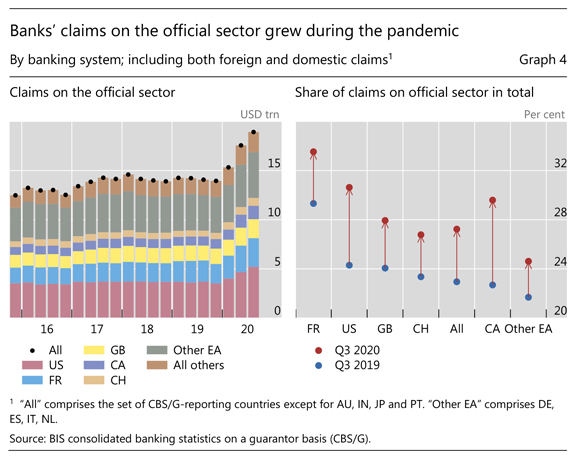
The expansion in total claims was mainly vis-à-vis the official sector, comprising governments and central banks.5 Outstanding claims on this sector – mainly holdings of government bonds and reserves at central banks – stood at $19 trillion at end-Q3 2020, up from $14 trillion a year earlier, a 34% increase (Graph 4, left-hand panel). Over that period, their share in total claims at Canadian and US banks rose by roughly 6 percentage points (right-hand panel). The official sector share for many other banking systems also rose noticeably, by 3–4 percentage points. Banks' claims on the official sector of their home country generally grew the most.
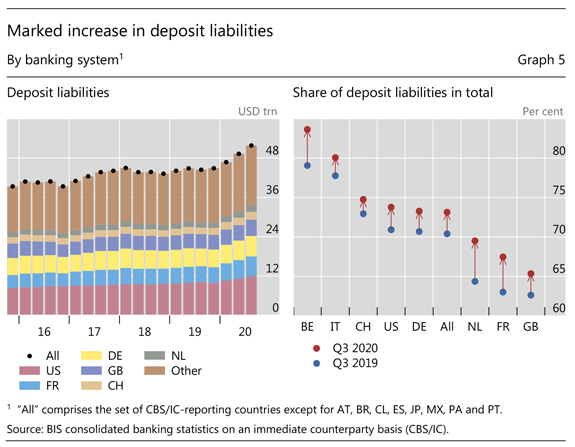
These developments went hand in hand with a rise in bank deposits, mostly from residents in banks' home countries. The growth in deposits has been evident since 2014, but accelerated during the pandemic (Graph 5, left-hand panel). End-Q3 2020 data show that the share of deposit liabilities6 in total liabilities increased by about 3 percentage points from a year earlier for several banking systems combined (right-hand panel); this rise contrasts with the overall stability observed in the previous two years. European banks, eg from Belgium, Finland, France, the Netherlands, Spain and Sweden, saw jumps of 4–7 percentage points in these shares compared with the year before. Other banking systems (eg German, Italian, Swiss, UK and US banks) also recorded increases.
1 See I Aldasoro, C Cabanilla, P Disyatat, T Ehlers, P McGuire and G von Peter, "Central bank swap lines and cross-border bank flows", BIS Bulletin, no 34, December.
2 Cross-border bank flows declined amid a resurgence of capital flows to emerging market economies in the third quarter of 2020. See Financial Times, "Foreign investors dash into emerging markets at swiftest pace since 2013", 18 December 2020.
3 The aggregation comprises banks headquartered in 22 of the 31 CBS-reporting countries because some countries report incomplete data. Throughout this section, the inclusion of a reporting country in the aggregate "All" depends on the completeness of data across time. In addition, the latest data are compared with Q3 2019, so as to avoid the year-end effects seen in Q4 data.
4 Data cited in this section are changes in amounts outstanding expressed in US dollars, and are not adjusted for exchange rate movements. In the period from September 2019 to September 2020, the US dollar depreciated against some major currencies (7% and 4% against EUR and CNY, respectively). Dollar depreciation increases reported amounts when positions denominated in other currencies are expressed in US dollars.
5 Note that, in the CBS, the official sector includes the central bank, and thus differs from the general government sector in the System of National Accounts.
6 In addition to deposits, total liabilities comprise debt securities, derivatives and other instruments, such as accounts payable and tax liabilities.