BIS international banking statistics at end-March 2019
- Global cross-border bank claims rose by $1.4 trillion between end-2018 and end-March 2019, their largest quarterly increase since 2007. This boosted their annual growth rate to 4.5%, the highest since end-March 2015. The surge in banks' claims was matched by a similar increase in their cross-border liabilities.
- The expansion was spread across all sectors. Cross-border claims on non-bank financial institutions grew most rapidly, expanding at an annual rate of 12%. Cross-border interbank claims grew at an annual rate of 1%, following four quarters of contraction.
- While the growth in cross-border claims on advanced economies (AEs) accelerated, that in cross-border claims on emerging market and developing countries (EMDEs) slowed further, to 2% at end-March 2019 from 9% at the end of 2017.
Growth in global cross-border bank lending strengthened
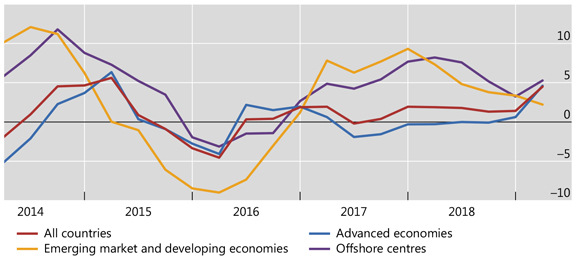
Graph 1: Annual percentage change in banks' cross-border claims by counterparty country (interactive graph).
Source: BIS locational banking statistics (Table A1).
The BIS locational banking statistics (LBS) reveal that global cross-border claims rose sharply by $1.4 trillion (on a non-seasonally adjusted basis) during the first quarter of 2019, to reach $30.5 trillion by end-March. Part of the global increase can be attributed to seasonal factors, characterised by an uptick in activity in the first quarter of each year. But the increase in Q1 was exceptionally large: the annual growth rate of cross-border claims accelerated to 4.5%, more than double the average rate over the preceding three years (Graph 1, red line).
After near zero growth throughout 2018, claims on counterparties resident in AEs rose noticeably during Q1 2019 (Graph 1, blue line). Lending to AEs surged by $1 trillion, to reach $21 trillion by end-March 2019. The expansion was primarily driven by cross-border claims on the United Kingdom (+$223 billion), France (+$176 billion), the United States (+$170 billion) and Germany (+$161 billion). The most notable increase in global cross-border claims outside AEs was vis-à-vis the Cayman Islands (+$261 billion).
The sizeable growth in banks' cross-border claims on all sectors (including banks) during Q1 2019 was matched by a similar increase in their cross-border liabilities, which rose by $1 trillion. The majority ($737 billion) of the expansion in cross-border liabilities was reported by banks located in the AEs versus counterparties in AEs.
Banks' cross-border claims on non-bank financial institutions grew rapidly
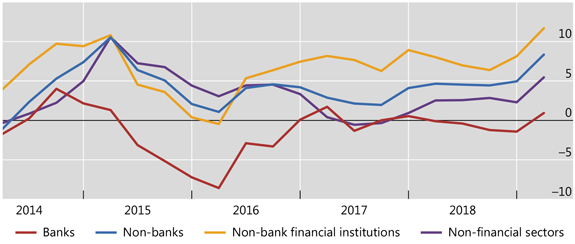
Graph 2: Annual percentage change in banks' cross-border claims by counterparty sector (interactive graph).
Source: BIS locational banking statistics (Table A1).
Reporting banks' claims on all sectors expanded in Q1 2019 - in particular, claims on the non-bank sector (Graph 2). Cross-border claims on non-banks accounted for more than one half ($864 billion) of the overall increase during the quarter. This pushed their annual growth rate to 8.3% (blue line), up from an average of 4% over the preceding three years. The pickup was particularly marked vis-à-vis non-bank financial institutions, pushing the annual growth rate to 12% (yellow line). The growth in cross-border interbank claims, which had been sluggish since end-2016, turned positive (1%, red line) in the first quarter of 2019.
The sharp increase in global cross-border claims on non-bank financial institutions during Q1 2019 was concentrated on borrowers in a few countries. In particular, claims on these borrowers located in the Cayman Islands grew by $210 billion (or 45% of the global increase in claims on this sector in Q1 2019), the bulk of which was reported by banks located in the United States ($166 billion). Cross-border claims on non-bank financial institutions in the United Kingdom also rose considerably, by $112 billion.1
The expansion in global cross-border interbank claims during Q1 2019 was driven by intra-euro area lending, which grew by $261 billion, mostly denominated in euros. This expansion in intra-euro area claims contributed to the $634 billion surge in global euro-denominated cross-border claims during Q1 2019. This boosted its annual growth rate to 9%, considerably higher than that for claims denominated in US dollars (1%).
Cross-border lending to EMDEs slowed
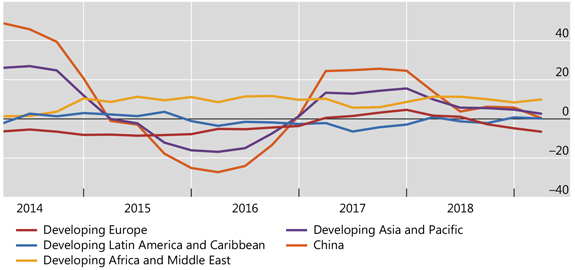
Graph 3: Annual percentage change in banks' cross-border claims by counterparty country (interactive graph).
Source: BIS locational banking statistics (Table A1).
Banks' global cross-border claims on EMDEs rose by $51 billion during Q1 2019, to $4 trillion at the end of the quarter. As a result, their annual growth rate slowed to 2%, extending the downward trend since the peak of 9% at the end of 2017.
Cross-border lending to borrowers in developing Africa and the Middle East rose the most (by $33 billion), with the annual growth rate remaining stable at around 10% (Graph 3, yellow line). Within this region, the largest increases in cross-border lending were vis-à-vis the United Arab Emirates (+$9 billion), Qatar (+$6 billion) and Saudi Arabia (+$4 billion).
In contrast, the annual growth rate of cross-border claims on developing Asia and the Pacific slowed further to 3% (Graph 3, purple line). The slowdown was primarily driven by a $27 billion decline in claims on China, their largest quarterly contraction since Q1 2016. The decline was due to a large decrease in cross-border interbank claims reported by Hong Kong SAR, which more than offset a $37 billion rise in claims on China reported by banks in other BIS reporting countries. On net, the annual growth rate of cross-border claims on China fell to zero.
Elsewhere, the annual growth of cross-border claims on developing Latin America and the Caribbean decelerated to near zero (Graph 3, blue line) in Q1 2019. Cross-border claims on Brazil and Mexico rose (by $9 billion and $5 billion, respectively), while claims on Venezuela contracted (by $2 billion).
Lastly, cross-border lending to developing Europe declined by $1 billion during Q1 2019, the third consecutive quarter of contraction. This brought its annual growth rate down to -7% (Graph 3, red line). Cross-border claims on Poland (-$3 billion) and Romania (-$2 billion) fell the most. By contrast, lending to Turkey rebounded (by $4 billion), following three quarterly contractions in a row.
1 Anecdotal evidence suggests that part of the increase in cross-border claims on the United Kingdom might be related to Brexit: several foreign banks are reported to have transferred some of their operations from their offices located in the UK to their offices outside the country (resulting in a mechanical rise in cross-border claims on UK residents).