BIS residential property price statistics, Q3 2025

Updates to the selected property prices data set
Since January 2026, the country groups advanced economies (AEs) and emerging market economies (EMEs) used in statistical releases have been aligned with the updated country classification.
Key changes:
These updates have resulted in revisions to the aggregate figures of the selected property prices data set.
The series for AEs and EMEs are back-calculated from their start date. Index revisions are minimal (below 2%); year-on-year growth rates may show larger revisions.
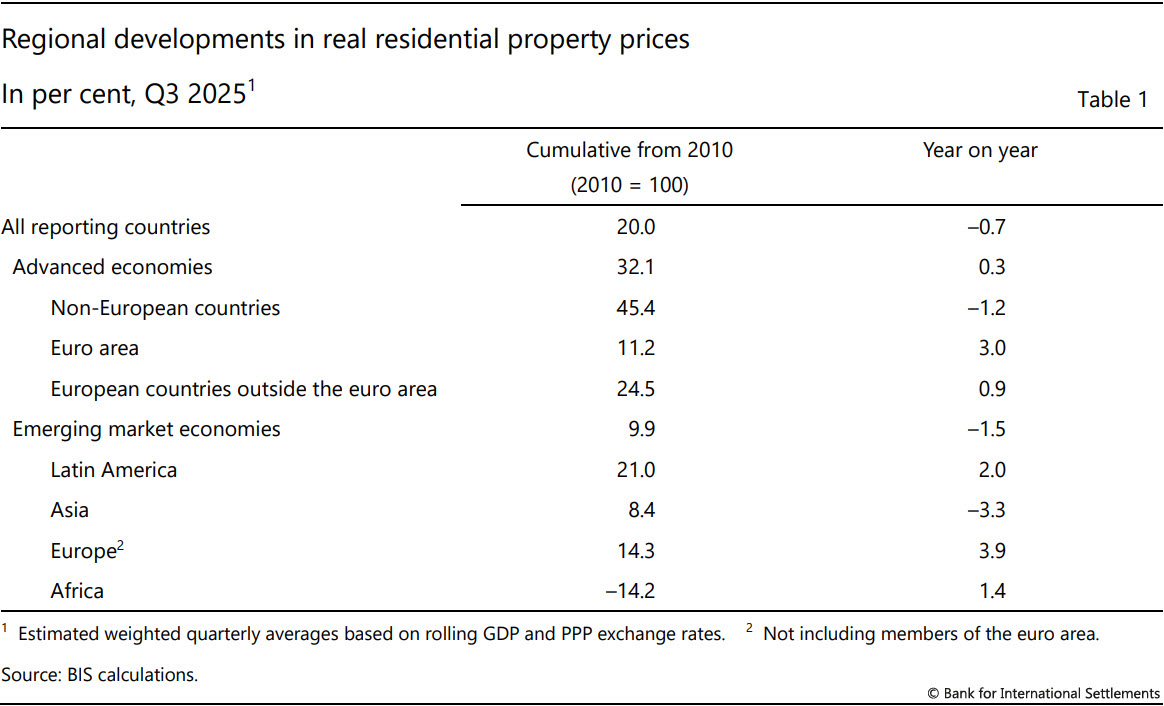
- In the third quarter of 2025, global real house prices fell by 0.7% year on year (yoy), a rate similar to the previous quarter (–0.8%); this was despite a rise in nominal prices (2%).
- Real house prices in AEs were almost stable (0.3% yoy), extending the recent period of moderate growth. In EMEs, prices continued to decrease, at a slower rate (–1.5%) compared with the previous quarters.
- The global decline in real house prices in aggregate terms was driven by a few major economies. In fact, most AEs and EMEs recorded price growth.
- Despite the continued decrease, global prices remain 20% above their levels observed at the end of the 2007–09 Great Financial Crisis (GFC), and 3% above pre-Covid pandemic levels.
- To access the full data set, visit Residential property prices - overview | BIS Data Portal.
Summary of latest developments
In the third quarter of 2025, aggregated house prices adjusted for consumer prices fell by 0.7% yoy, similar to the previous quarter (–0.8% yoy). Despite moderate growth in nominal terms, real prices have continued to decline since the third quarter of 2022, albeit at a slower pace recently.1
In Q3 2025, the gap between AEs and EMEs continued to narrow.2 In AEs, real house prices growth almost stabilised, at 0.3% yoy, down from 0.6% in Q2 2025. In EMEs, real house prices decreased by –1.5% yoy, compared with the 1.9% yoy decline in the previous quarter (Graph 1).
In AEs, price trends varied across regions. Real residential property prices grew by 3.0% in the euro area, while other European AEs saw only a moderate increase of 0.9%. These increases were offset by a 1.2% decline in non-European AEs. As a result, overall house prices in AEs almost stabilised (0.3%).
The decline in EMEs (–1.5%) was primarily driven by Asia, where prices decreased by 3.3% yoy. Real residential property prices increased in emerging Europe (+3.9%), Latin America (by 2.0%) and Africa (+1.4%) (Table 1).
Despite the global decline of 0.7% in aggregate terms, the median yoy change in real house prices remained positive at 1.5% (Graph 2.A). In fact, prices have increased in the majority of reporting jurisdictions, continuing the trend observed since 2024.
Country-level data reveal that around 60% of AEs and 70% of EMEs recorded price growth in Q3 2025, while price declines were generally moderate, in the range of –5 to 0%. Notably, 10% of EMEs recorded increases above 15% (Graph 2.B).3
In Q3 2025, the highest price increases among the reporting jurisdictions were observed in North Macedonia (+20%), Hungary (+16%) and Portugal (+15%). The largest declines occurred in China (–5%), Canada (–5%) and Finland (–4%) (Graph 3).
Advanced economies
In aggregate, real residential property prices in AEs almost stabilised with 0.3% yoy growth, a slight deceleration compared with Q2 (0.6%).
Overall, price changes were modest across all AEs. Prices continued increasing in the euro area (+3%), Australia (+2%) and Japan (+1%). Conversely, declines persisted in Canada (−5%), the United States (−2%), Korea (−2%) and the United Kingdom (−1%) (Graph 5).
In the euro area, prices continued growing by 3% in Q3 2025, a growth rate similar to the previous two quarters. Within the euro area, differences persisted. Prices continued rising sharply in Portugal (+15%) and Spain (+10%). To a more moderate extent, they kept increasing in Italy (+2%) and Germany (+1%). They remained stable in France (–0.2%) and continued to decline in Finland (–2%) (Graph 6).
Emerging market economies
In Q3 2025, real residential property prices in EMEs decreased by 1.5% yoy, driven by price declines in Asia (–3.3%).
In emerging Asia, real house prices continued to drop in China (–5%) and Indonesia (–2%), remained stable in India (+0.5%) and halted their growth in the Philippines (+0.5%). A moderate increase was observed in Thailand (+1%).
Real house prices in Latin America continued increasing by 2.0% yoy, driven by continued growth in Mexico (+5%) while prices remained stable in Brazil (–0.4%).
In emerging Europe, prices rose by 3.9% yoy, with notable increases in North Macedonia (20%) and Hungary (16%). Prices almost stabilised after six quarters of decline in Türkiye (–1%) (Graph 6).
Annex A: Nominal house price developments
1 Real residential property prices refer to nominal residential property prices (which in Q3 2025 grew by 2.0% globally) deflated by the consumer price index. Global figures are weighted aggregates of selected AEs (Australia, Canada, Czechia, Denmark, the euro area, Hong Kong SAR, Iceland, Israel, Japan, Korea, New Zealand, Norway, Singapore, Sweden, Switzerland, the United Kingdom and the United States) and EMEs (Brazil, Bulgaria, Chile, China, Colombia, Hungary, India, Indonesia, Malaysia, Mexico, Morocco, North Macedonia, Peru, the Philippines, Poland, Romania, Russia, Serbia, South Africa, Thailand and Türkiye), based on PPP exchange rates. Regional aggregates have been available since 2007.
2 Bulgaria will be reclassified as an AE starting with the release covering Q4 2025, when the euro area aggregate will be updated to reflect the new country composition. Data for the euro area are reported to the BIS by the ECB and based on the House Price Index compiled by Eurostat.
3 As regional aggregate developments (calculated using rolling GDP and PPP exchange rates) are driven mainly by changes in major economies, they can mask the detailed country-level features, as analysed in Graph 2.