BIS residential property price statistics, Q2 2025

Key takeaways
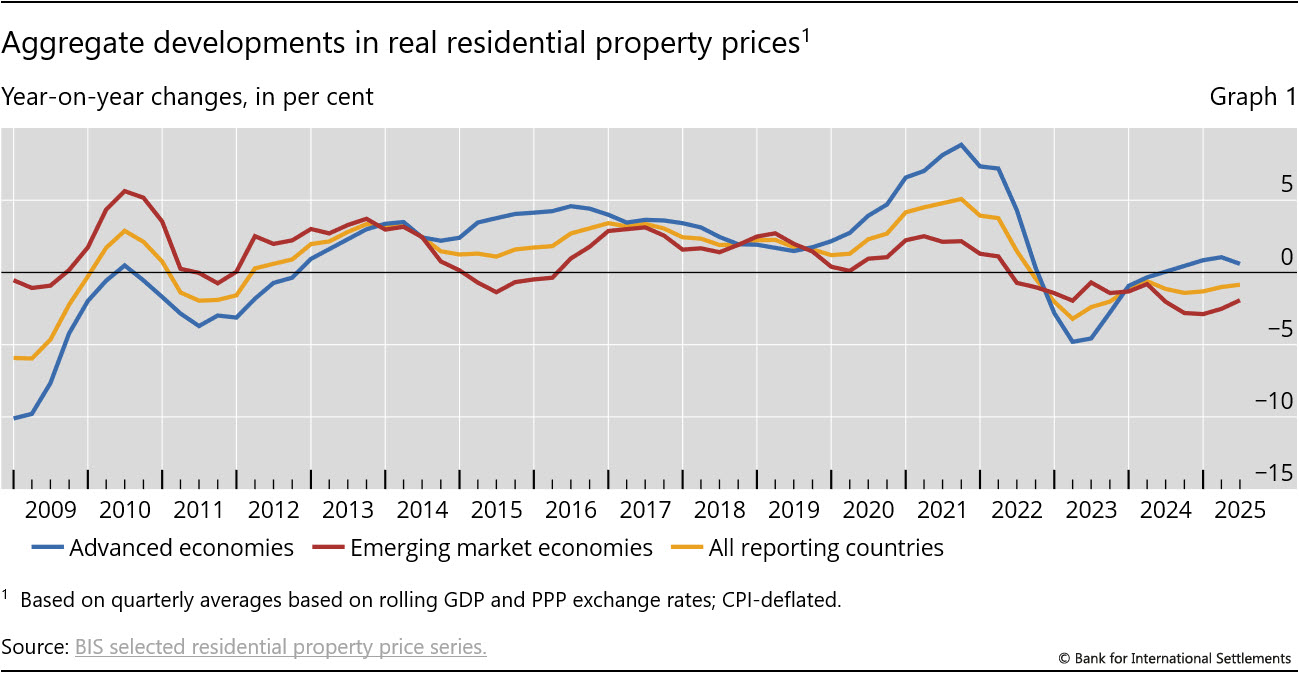
- Global house prices declined in real terms by 0.8% year on year (yoy) in Q2 2025, slightly less compared with the previous quarter (–1.0%).
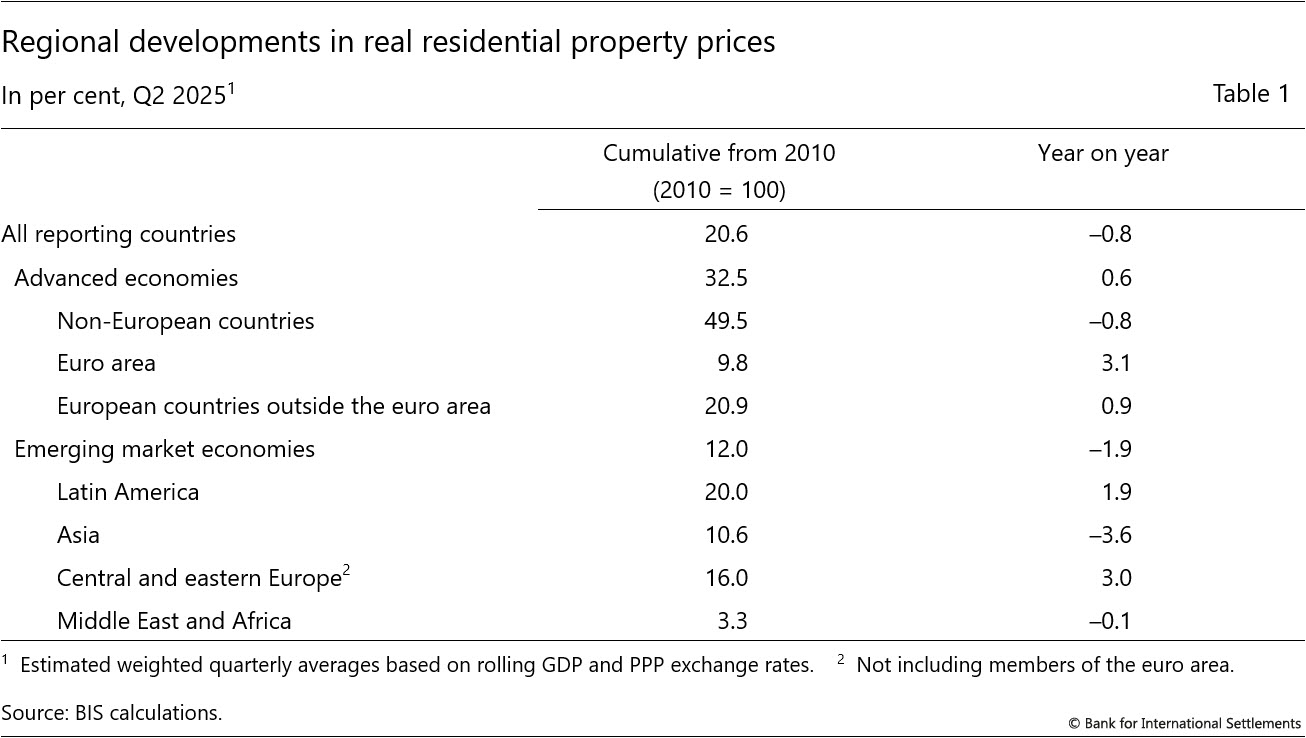
- In advanced economies (AEs), real house prices continued to increase, albeit at a slower pace (0.6%), while the price decline in emerging market economies (EMEs) moderated (to –1.9%).
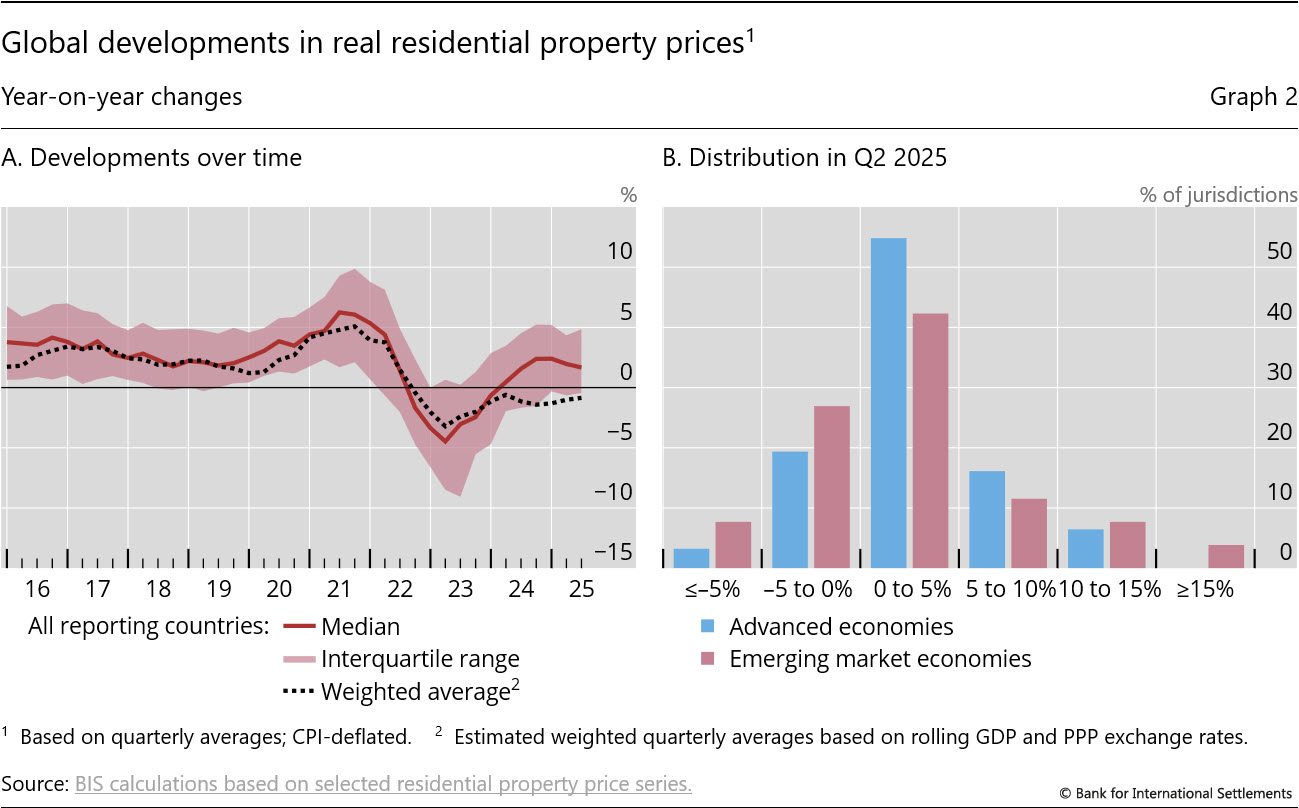
- Over 70% of AEs and 50% of EMEs experienced moderate residential property price growth (0–10%) in Q2 2025.
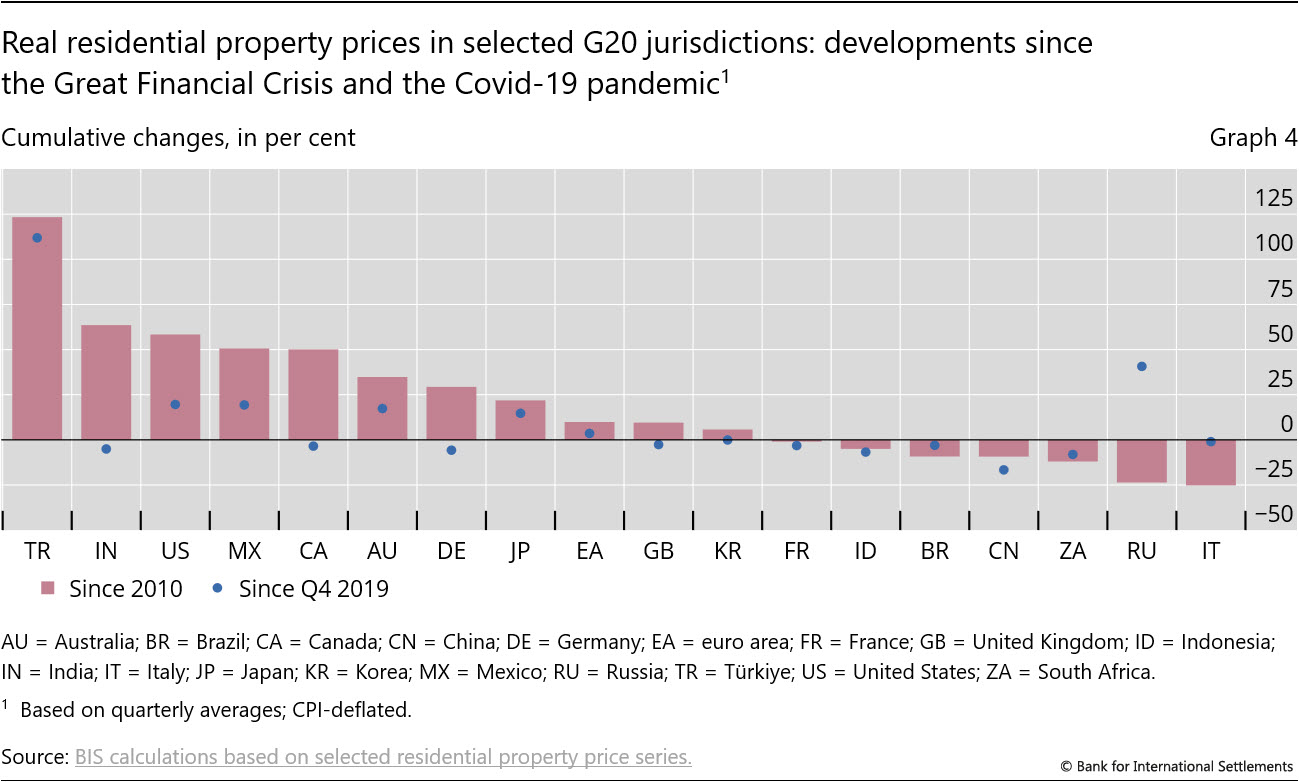
- From a longer-term perspective, real house prices have more than doubled in Türkiye since the Great Financial Crisis (GFC) of 2007–09, while they remain below their 2010 levels in Italy, South Africa and China.
- To access the full data set, visit Residential property prices - overview | BIS Data Portal.
Summary of latest developments
In the second quarter of 2025, aggregated house prices adjusted for consumer prices declined by 0.8% yoy, slightly less compared with the 1.0% decline registered in the previous quarter.1 Yet this marked the third consecutive year of falling property prices globally.
Diverging trends remained between AEs and EMEs, although the gap narrowed somewhat. Real house prices in AEs rose by 0.6% yoy, furthering their increase observed since 2024, despite some recent weakening compared with Q1 2025 (1.1%). In contrast, EMEs experienced a 1.9% yoy decline (versus –2.5% in Q1 2025), extending their downward trend that started in 2022 (Graph 1).
The decline in real house prices in EMEs (–1.9%) was primarily driven by Asia (–3.6%), while central and eastern Europe (3.0%) and Latin America (1.9%) recorded significant price growth. Turning to AEs, price increases occurred mainly in the euro area (3.1%) and other European countries (0.9%); in contrast, real prices fell moderately in non-European AEs (–0.8%) (Table 1).
Despite the decline observed in real house prices in global aggregated terms, jurisdiction-level data show that over 70% of AEs and 50% of EMEs experienced positive price growth (0–10%) in Q2 2025. Moreover, a small but significant proportion of economies experienced price increases above 10% (Graph 2.B). Reflecting the above, the median growth among the 57 reporting jurisdictions has remained in positive territory since the beginning of 2024 (+1.7% yoy in Q2 2025; Graph 2.A).2
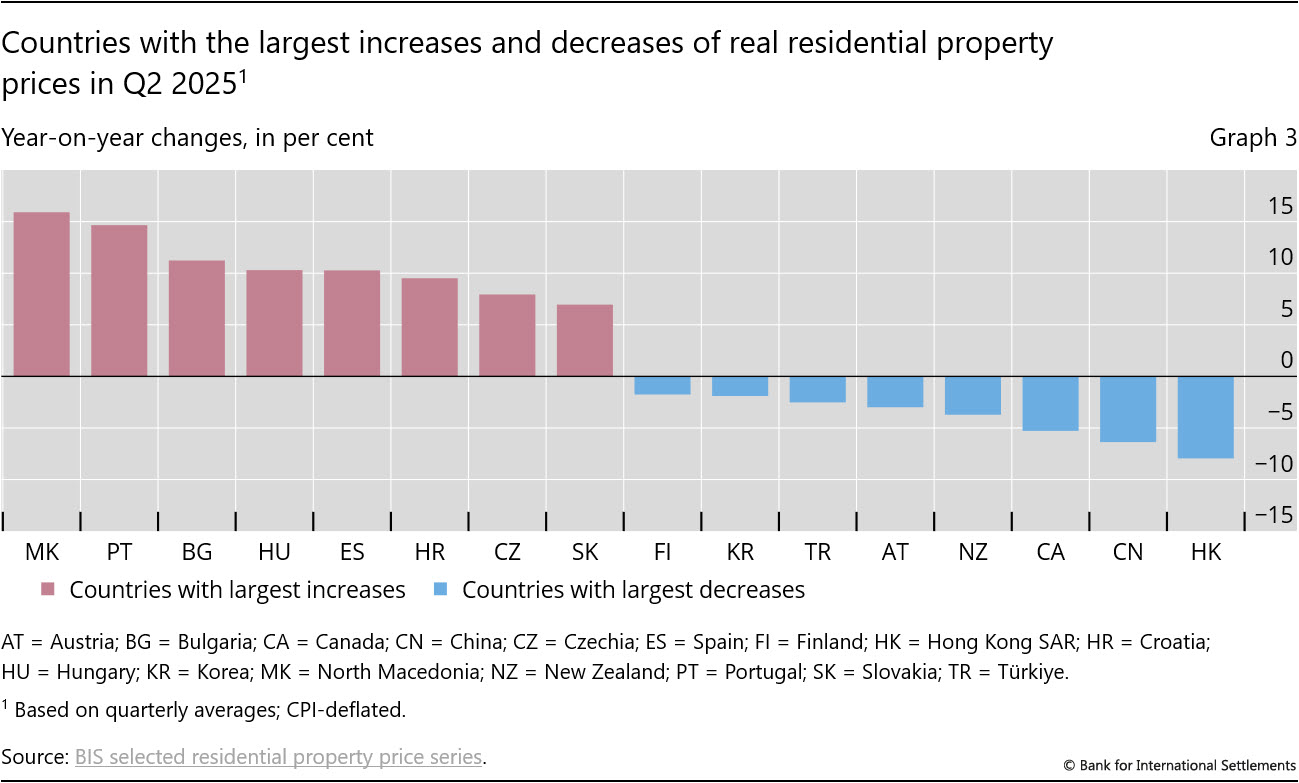
Graph 3 highlights the most significant changes observed across jurisdictions in Q2 2025: real prices rose sharply yoy in North Macedonia (16%), Portugal (15%) and Bulgaria (11%), while the biggest declines were observed in Hong Kong SAR (–8%), China (–6%) and Canada (–5%).
Since the Covid-19 pandemic, global real residential property prices have increased by 3.5%. Among the G20 economies, they have risen by 112% in Türkiye and 20% in the United States and Mexico, and have decreased by 17% in China and 8% in South Africa.
From a longer-term perspective, real global prices have grown by 20.6% since the GFC, ie compared with their 2010 levels. They have more than doubled in Türkiye and risen by over 50% in India, the United States and Mexico. But they remain well below their 2010 levels in Italy (–25%), South Africa (–12%) and China (–9%) (Graph 4).
Advanced economies
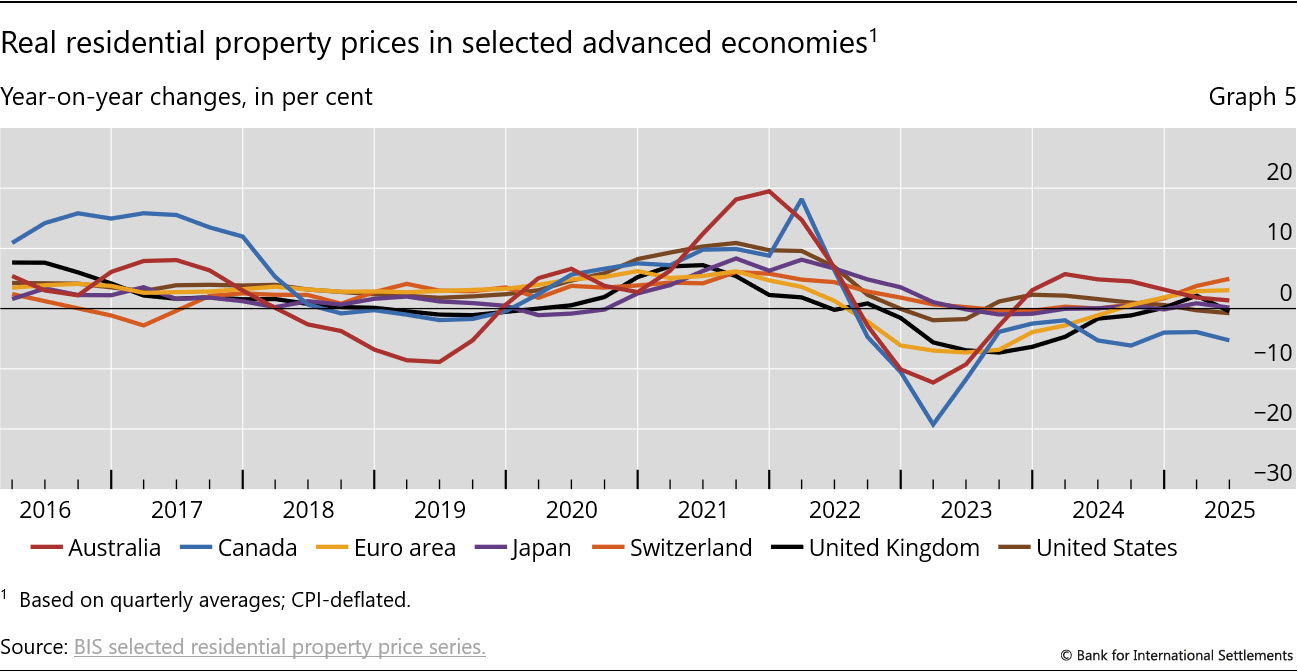
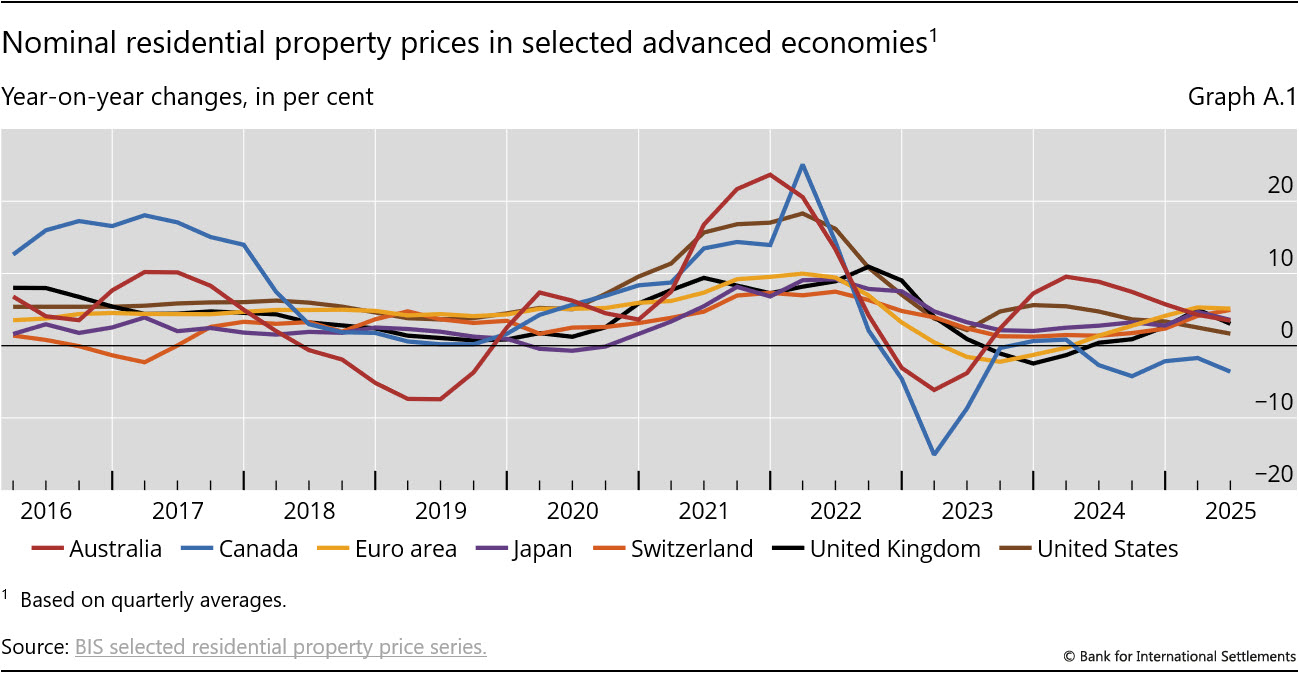
In aggregate, real residential property prices in AEs rose by 0.6% yoy in Q2 2025, continuing the upward trend observed since Q2 2024.
Among this group, a significant increase was observed in Switzerland (5.0%), where real prices have risen steadily since 2024. The expansion has been more moderate in the euro area (3.1%), while developments have remained broadly flat in Japan (0.2%), the United Kingdom (–0.4%) and the United States (–0.8%). In contrast, real prices continued to fall markedly in Canada (–5.3%) (Graph 5).
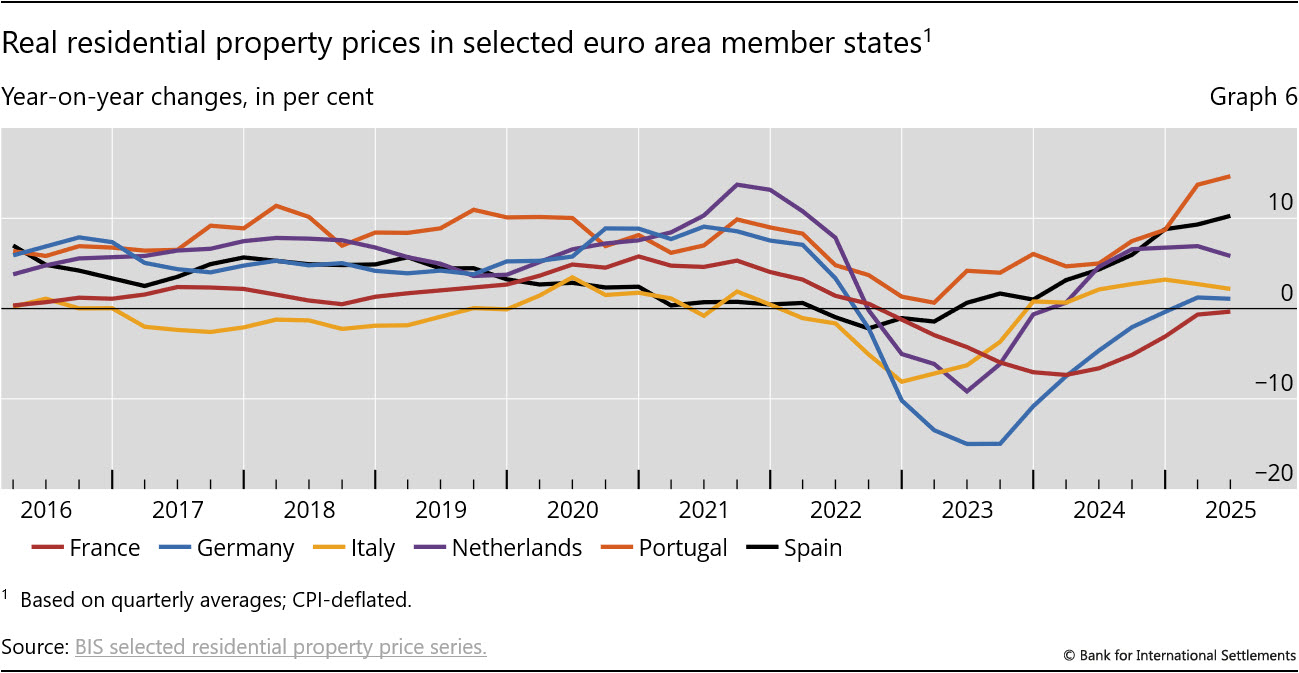
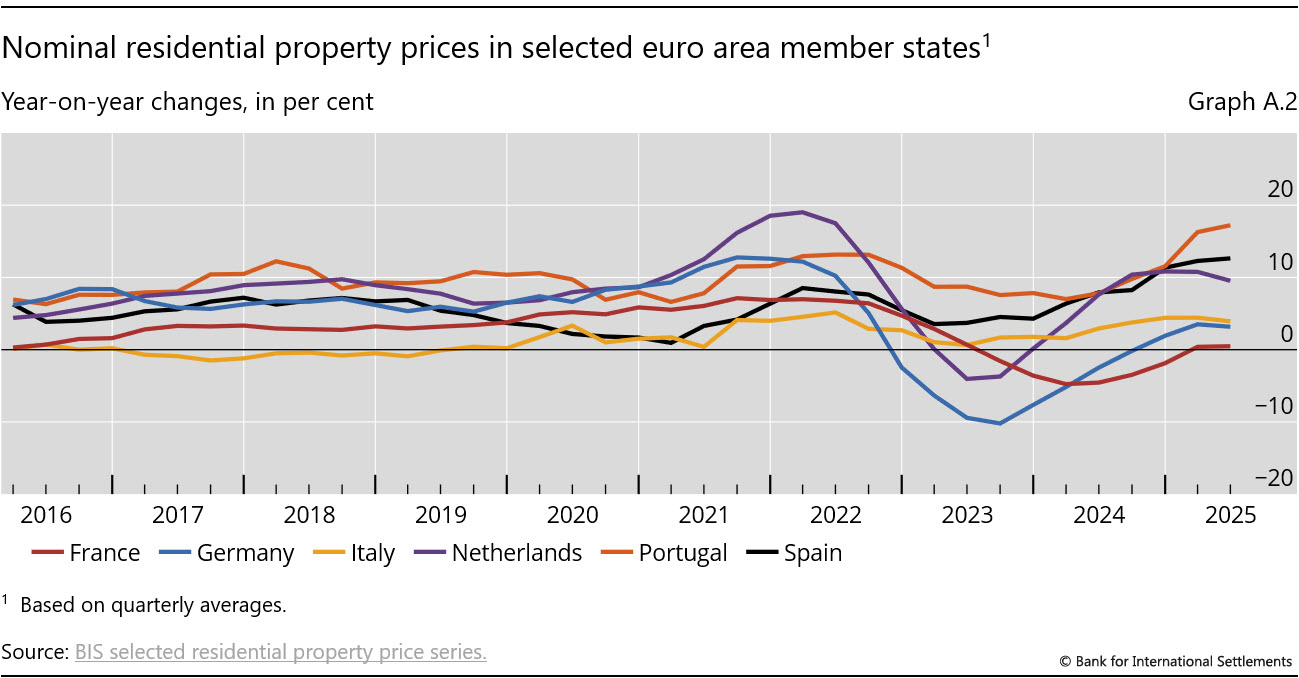
In the euro area, real house prices grew by 3.1% in aggregate in Q2 2025, with some notable diversity among member jurisdictions. Portugal recorded the highest increase at 15% yoy, continuing a long-running trend, followed by Spain (10%), where prices have kept increasing for two consecutive years. Prices kept growing also in the Netherlands (6%) and Italy (2%). Germany saw the second consecutive quarter of moderate growth (1%) after an extended period of decline, and prices almost stabilised in France.
Emerging market economies
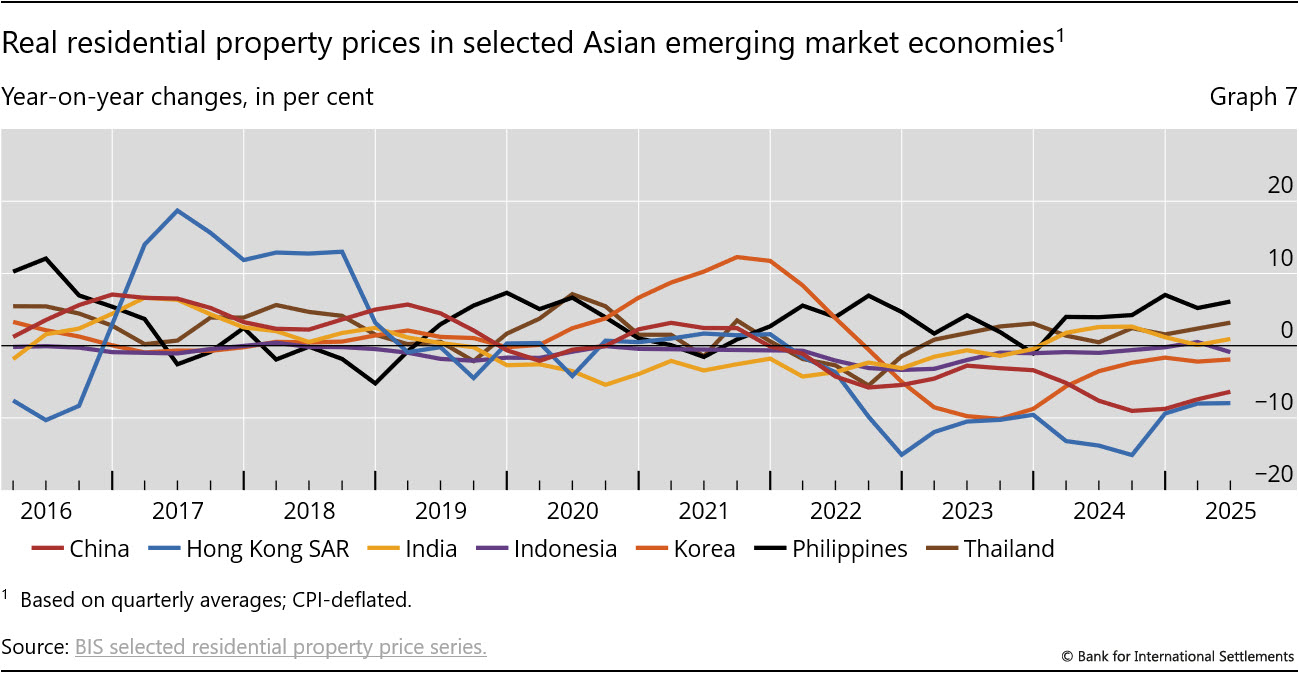
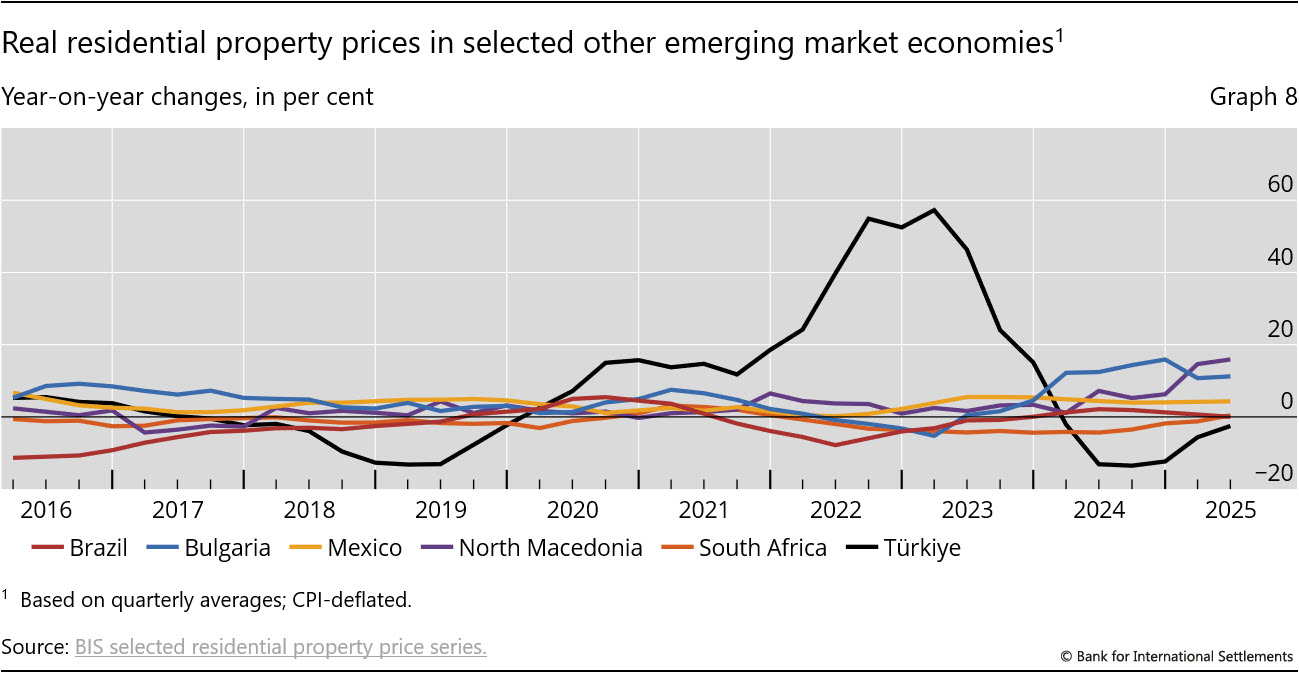
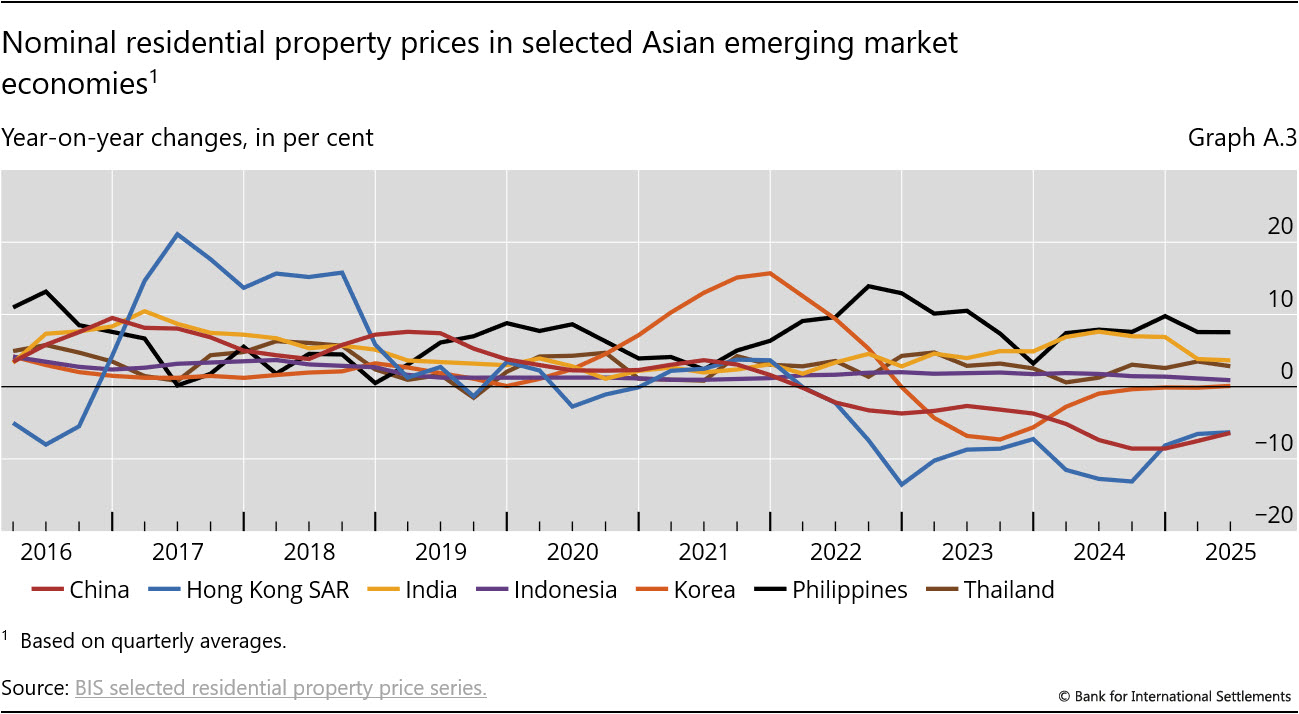
Real residential property prices in EMEs fell by 1.9% yoy in Q2 2025, reflecting a sharp decline in emerging Asia (–3.6%), with significant declines in Hong Kong SAR (–8%), China (–6%) and, to a lesser extent, Korea (–2%). Prices remained almost stable in India (1%) and Indonesia (–1%) and have risen somewhat in Thailand (3%). The Philippines recorded the highest increase in the region, at 6% (Graph 7).
Real house prices in Latin America grew by 1.9% yoy, primarily driven by Mexico, which recorded a 4% increase for five consecutive quarters, while prices in Brazil were stable.
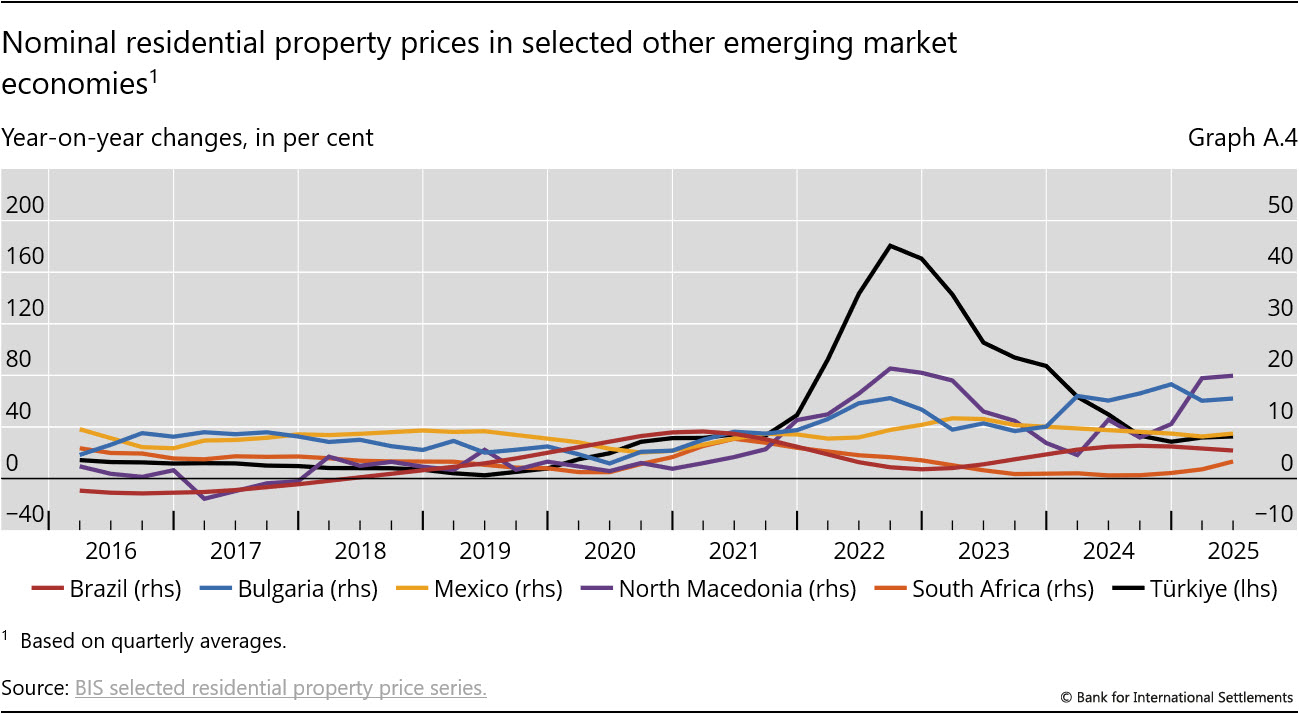
In central and eastern Europe, prices increased by 3% yoy, with notable growth in North Macedonia (16%) and Bulgaria (11%). Prices slowed their decline in Türkiye (–2.5%).
Prices were stable in the Middle East and Africa region (–0.1%) and in particular stabilised in South Africa for the first time since 2022 (Graph 8).
Annex A: Nominal house price developments
1 Real residential property prices refer to nominal residential property prices (which in Q2 2025 grew by 2.0% globally) deflated by the consumer price index. Global figures are weighted aggregates of selected AEs (Australia, Canada, Denmark, the euro area, Iceland, Japan, New Zealand, Norway, Sweden, Switzerland, the United Kingdom and the United States) and EMEs (Brazil, Bulgaria, Chile, China, Colombia, Czechia, Hong Kong SAR, Hungary, India, Indonesia, Israel, Korea, Malaysia, Mexico, Morocco, North Macedonia, Peru, the Philippines, Poland, Romania, Russia, Singapore, South Africa, Thailand, Türkiye and the United Arab Emirates), based on PPP exchange rates. Regional aggregates have been available since 2007.
2 As regional aggregate developments (calculated using rolling GDP and PPP exchange rates) are driven mainly by changes in major economies, they can mask the detailed country-level features, as analysed in Graph 2.