BIS residential property price statistics, Q1 2025

Key takeaways
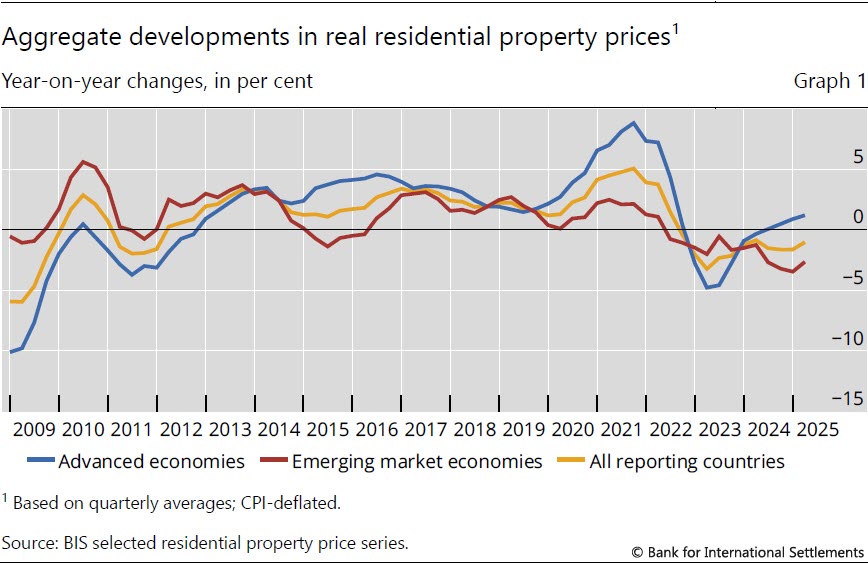
- In the first quarter of 2025, global real house prices fell by 1.0% year on year (yoy), representing a slower pace of decline compared with the second half of 2024 (–1.6%).
- Prices in advanced economies (AEs) continued to recover, rising by 1.2% yoy in real terms. Meanwhile, emerging market economies (EMEs) experienced a slower decrease (–2.6%, relative to –3.5% in previous quarter), mainly driven by a continued fall in Asia.
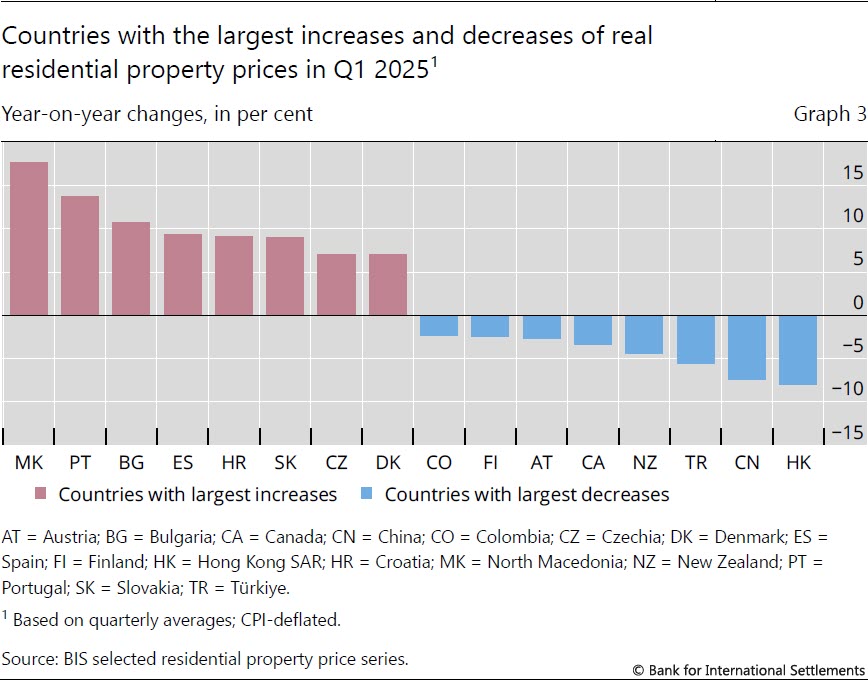
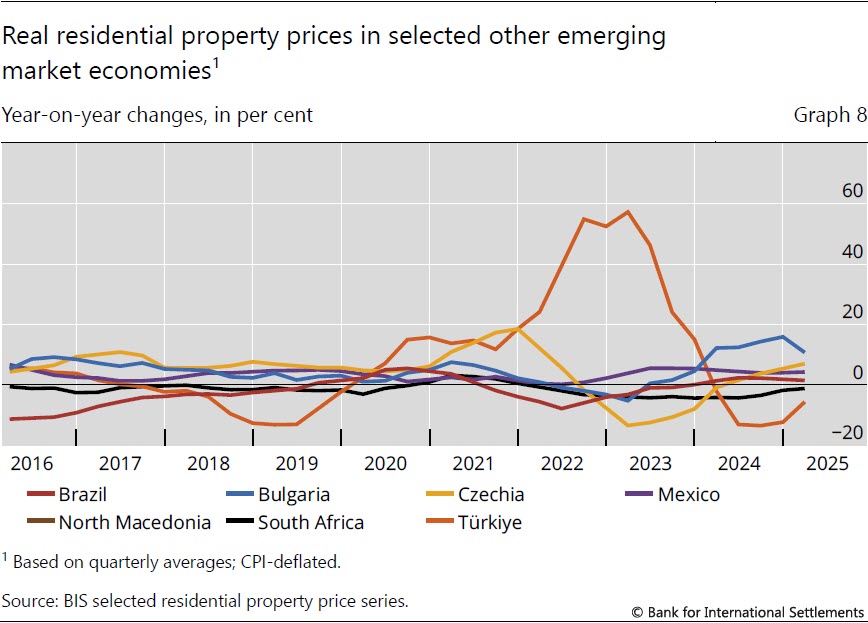
- Price developments showed greater variability across jurisdictions. Sharp yoy declines in Hong Kong SAR (–8%), China (–7%) and Türkiye (–6%) contrasted with significant increases in some European countries, namely North Macedonia (+18%), Portugal (+14%) and Bulgaria (+11%).
- Since the Great Financial Crisis (GFC) of 2007–09, global real house prices have risen by 21% (34% in AEs and 11% in EMEs).
- To access the full data set, visit Residential property prices - overview | BIS Data Portal.
Summary of latest developments
In first quarter of 2025, global house prices, adjusted for consumer prices, fell by 1.0% yoy, extending the downward trend that started in 2022. However, this evolution marked some improvement compared with the larger 1.6% decline registered in the previous quarter (Graph 1).1
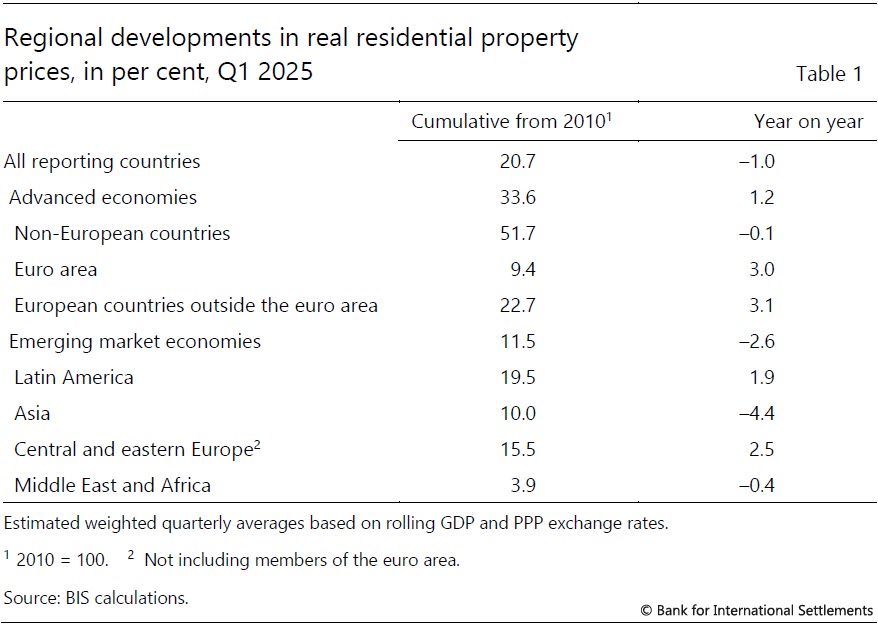
The continued decline of real global prices has been driven by developments in EMEs, where prices declined again in Q1 2025, although at a somewhat slower pace than in the previous quarter (2.6% versus 3.5%). The fall was primarily observed in emerging Asia (–4.4%) and was only partially offset by increases in central and eastern Europe (2.5%) and Latin America (1.9%) (Table 1).
In contrast, real house prices in AEs increased by 1.2% yoy in aggregate, continuing their recovery observed since mid-2024. The rise was particularly notable in the euro area and other European AEs (around 3% in both cases). Outside Europe, AEs experienced almost flat prices (–0.1%) (Table 1).
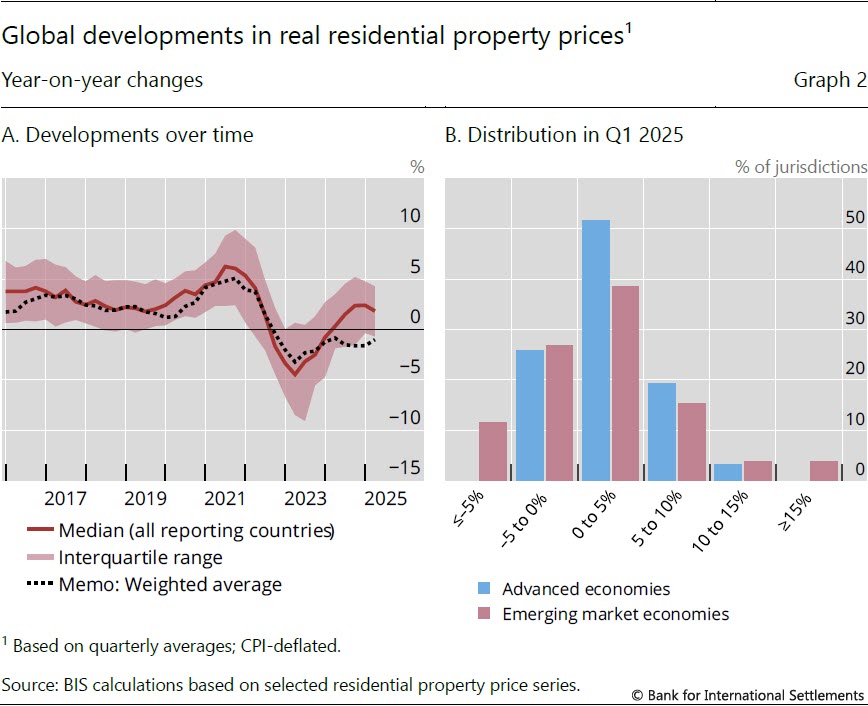
Although real global residential property prices decreased in aggregate, country-level data show growth in most jurisdictions in Q1 2025,2 with a median yoy increase of 1.8% (Graph 2.A). Indeed, prices increased significantly in the large majority of economies (over two thirds of AEs and half of EMEs).
House price inflation was relatively stable in AEs, with no jurisdictions observing price changes below –5% or above 15% (Graph 2.B). In contrast, prices in EMEs were more volatile, with jurisdictions there recording both the steepest declines (–8% in Hong Kong, –7% in China and –6% in Türkiye) and highest growth (18% in North Macedonia) (Graph 3).
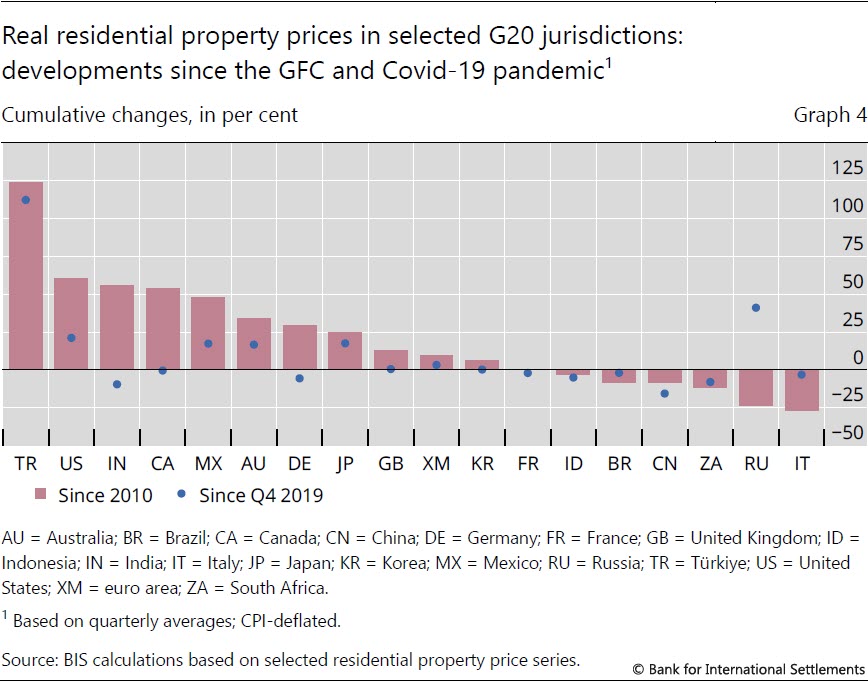
Since the outbreak of the Covid-19 pandemic, inflation-adjusted house prices in G20 jurisdictions have generally risen. Compared with Q4 2019, they have increased by 4% globally and, in particular, by 112% in Türkiye and 21% in the United States. In contrast, they have fallen by 16% in China and 10% in India.
From a longer-term perspective, global real house prices exceed their levels immediately after the GFC by 21% (by 34% for AEs and 11% for EMEs). Compared with 2010, prices have more than doubled in Türkiye and have risen by over 50% in the United States, India and Canada. However, they remain significantly below 2010 levels in Italy (–27%) and South Africa (–12%) (Graph 4).
Advanced economies
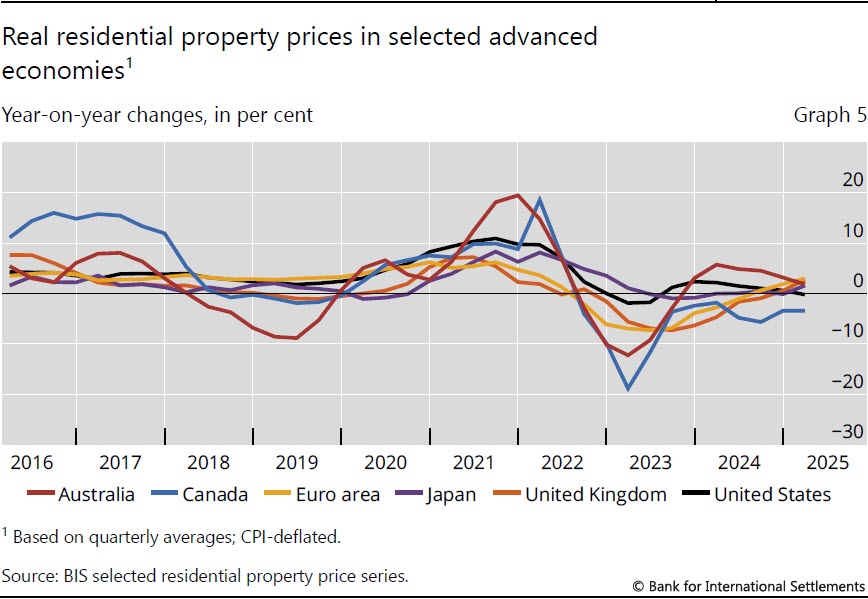
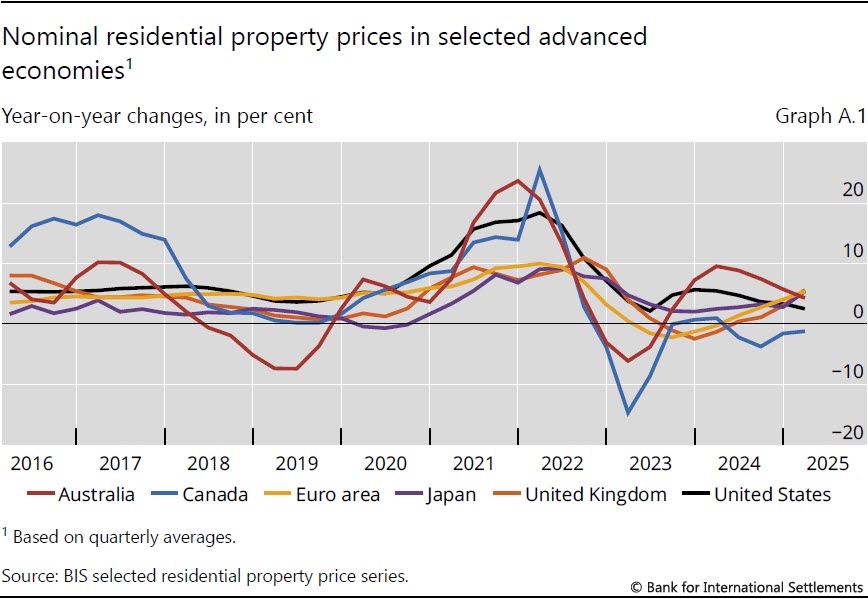
In aggregate, AEs recorded a 1.2% yoy increase in real residential property prices in Q1 2025, marking the fourth consecutive quarter of growth. Most major jurisdictions saw price increases, notably the euro area (3%), the United Kingdom (3%), Australia (2%) and Japan (2%). Prices continued to decline in Canada (–3%) and were stable in the United States (0%) (Graph 5).
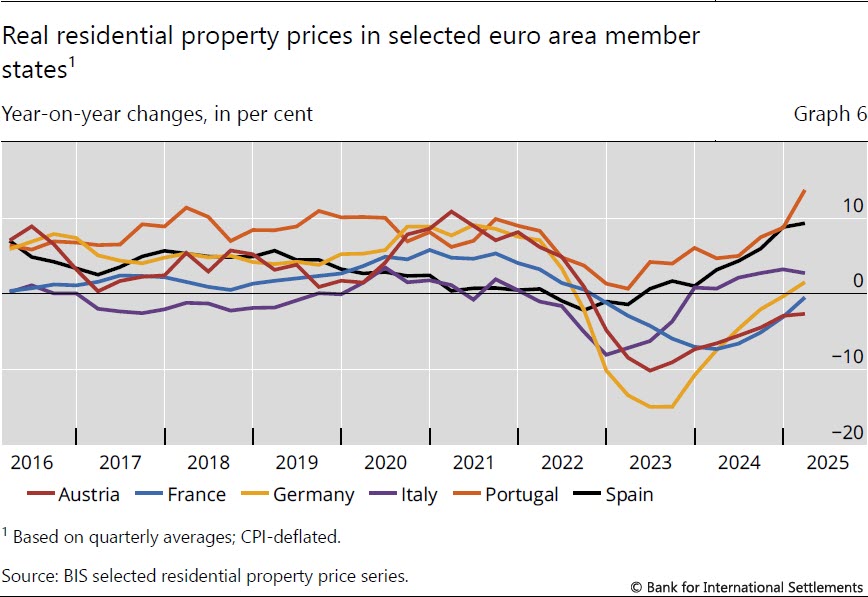
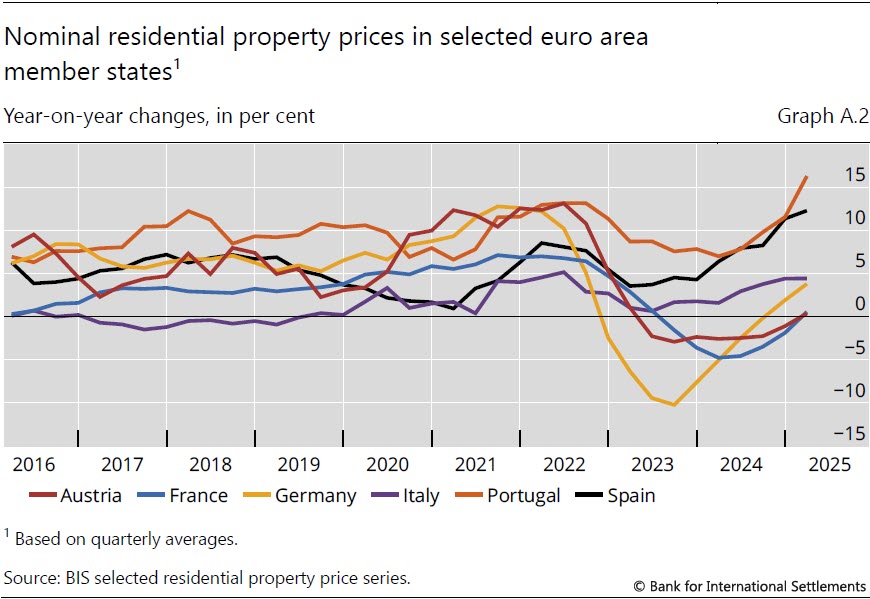
Within the euro area, real house prices tended to increase further in Q1 2025 or at least stabilised. Portugal and Spain recorded significant rises, with prices up by 14% and 9%, respectively. Prices grew moderately in Italy (3%) and, for the first time since 2022, in Germany (2%). They stabilised in France (0%) after an extended period of decline (Graph 6).
Emerging market economies
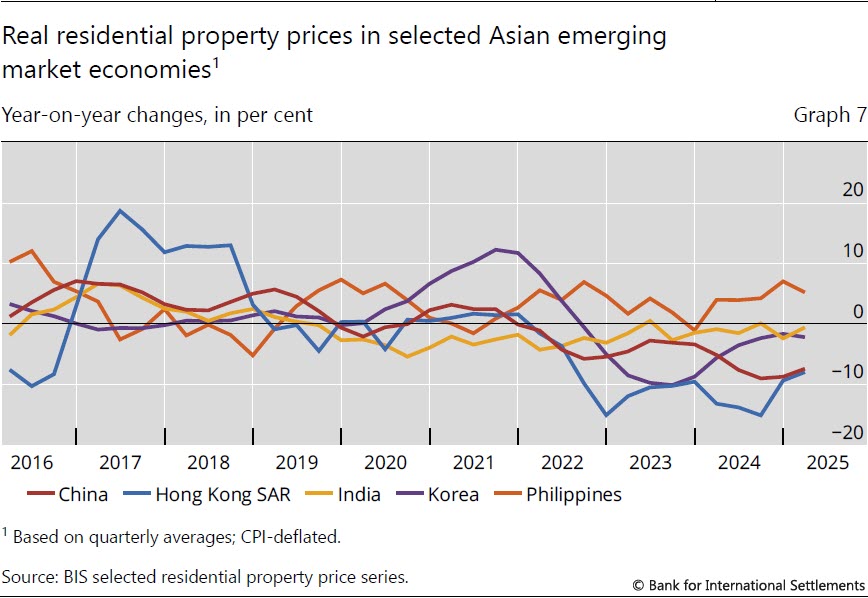
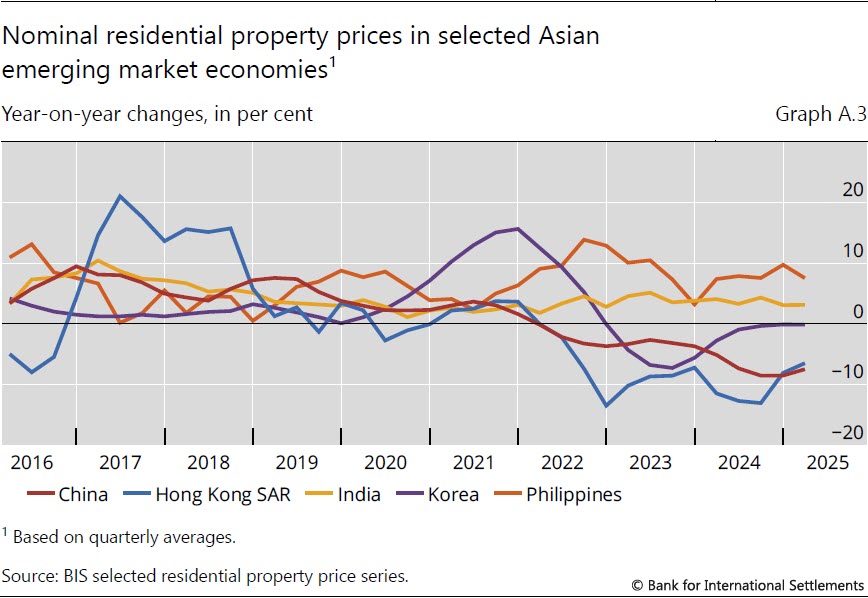
Real residential property prices in EMEs fell by 2.6% yoy in Q1 2025, driven by a continued decline in Asian jurisdictions, especially China (–7%). Nevertheless, prices remained broadly stable in Korea (–2%) after an extended period of decline as well as in India (–1%). They continued to rise significantly in the Philippines (5%) (Graph 7).
In Latin America, real house prices grew by 1.9% in aggregate in Q1 2025, led by a modest but continued expansion in Mexico (4%) and, to a lesser extent, in Brazil (1%). In central and eastern Europe, they rose by 2.5% in aggregate, with notable growth in North Macedonia (18%), Bulgaria (11%) and Czechia (7%). Prices fell further in Türkiye (–6%) and almost stabilised in South Africa (–1%) (Graph 8).
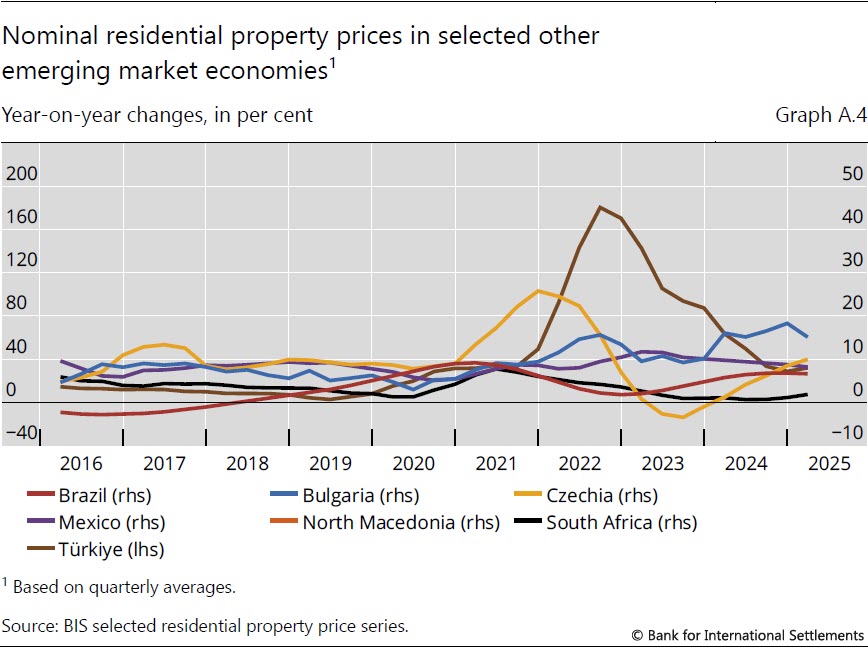
Annex: Nominal house price developments
1 Real residential property prices refer to nominal residential property prices (which in Q1 2025 grew by 2.1%) deflated by the consumer price index. Global figures are weighted aggregates of selected AEs (Australia, Canada, Denmark, the euro area, Iceland, Japan, New Zealand, Norway, Sweden, Switzerland, the United Kingdom and the United States) and EMEs (Brazil, Bulgaria, Chile, China, Colombia, Czechia, Hong Kong SAR, Hungary, India, Indonesia, Israel, Korea, Malaysia, Mexico, Morocco, North Macedonia, Peru, the Philippines, Poland, Romania, Russia, Singapore, South Africa, Thailand, Türkiye and the United Arab Emirates), based on PPP exchange rates. Regional aggregates have been available since 2007.
2 As regional aggregate developments (calculated using rolling GDP and PPP exchange rates) are driven mainly by changes in major economies, they can mask the detailed country-level features, as analysed in Graph 2.