BIS residential property price statistics, Q4 2024

Key takeaways
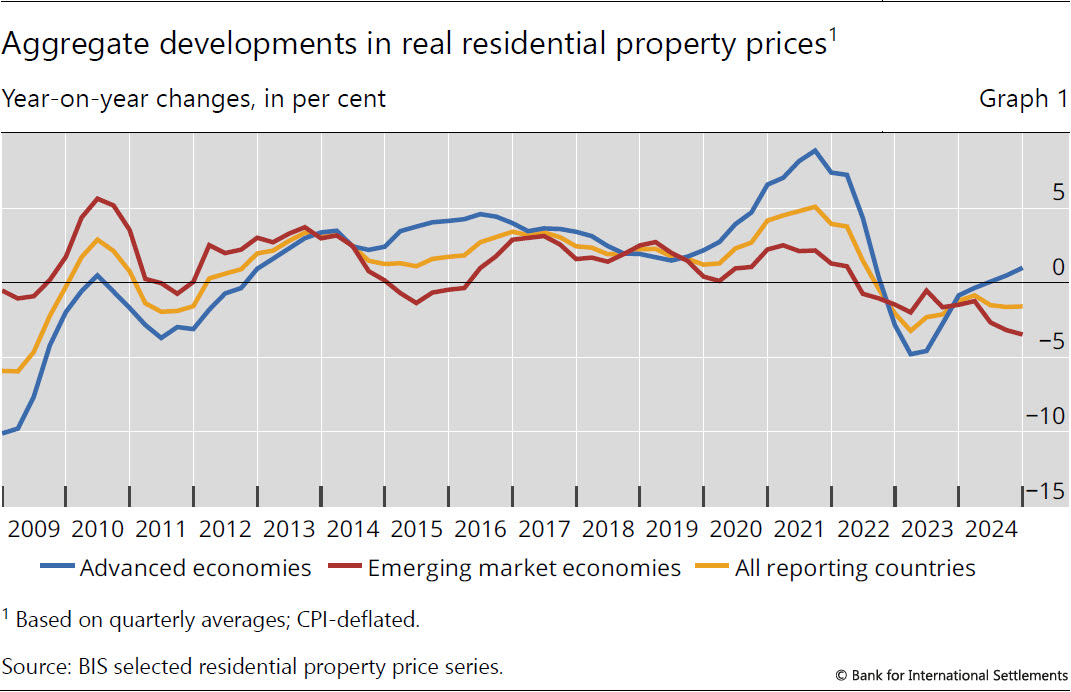
- In the fourth quarter of 2024, global real house prices decreased by 1.6% year on year (yoy), a decline rate similar to the previous quarters; this was despite a modest rise in nominal prices (+1.8%).
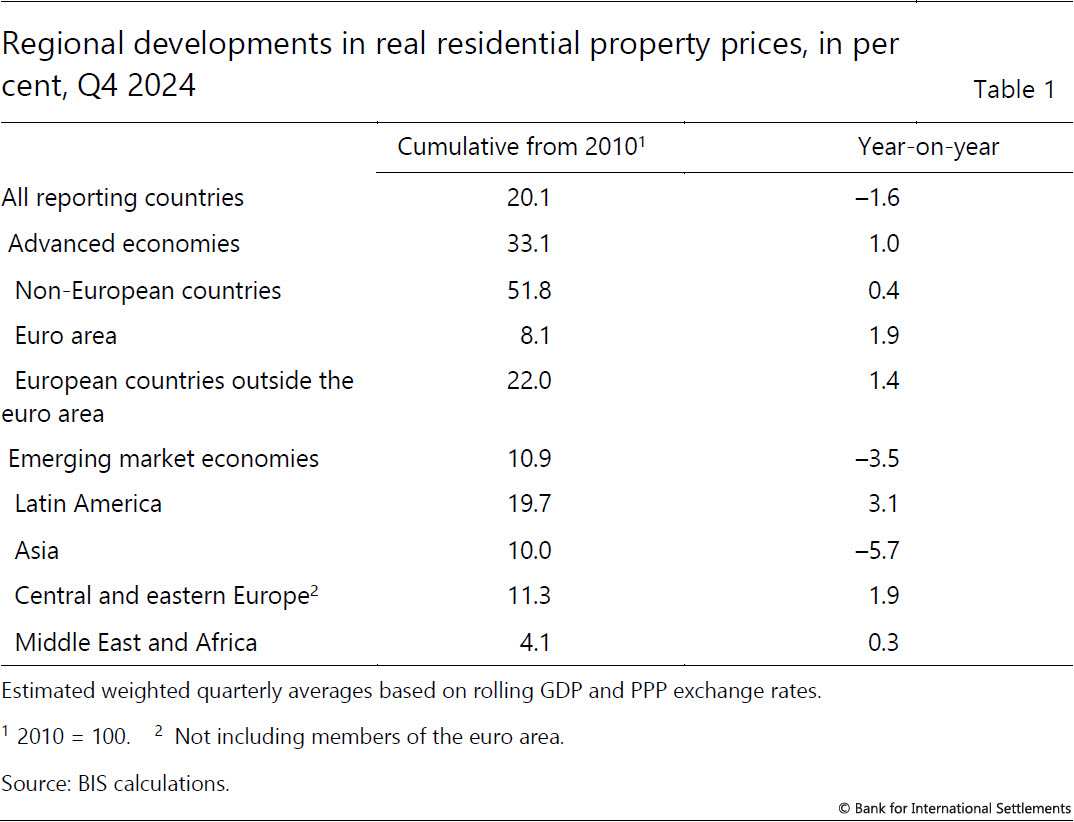
- Advanced economies (AEs) saw real house price growth of 1.0% yoy, led by developments in the euro area (+1.9%). In contrast, prices in emerging market economies (EMEs) extended their decline (–3.5%), largely driven by a 5.7% drop in Asia. Developments exhibited even greater variability across individual jurisdictions.
- From a long-term perspective, global real house prices remain 20% above their levels observed after the 2007-09 Great Financial Crisis.
- To access the full data set, visit Residential property prices - overview | BIS Data Portal.
Summary of latest developments
In the fourth quarter of 2024, global house prices deflated by consumer prices fell by 1.6% yoy, a rate unchanged from the third quarter.1 AEs saw a modest recovery, with real house prices increasing by 1.0% yoy in aggregate, marking the strongest growth recorded since Q2 2022. The rebound was especially notable in the euro area (+1.9%) and other European countries (+1.4%) (Table 1).
In contrast, prices in EMEs extended their decline observed since Q2 2022, dropping by 3.5% yoy in real terms (Graph 1), particularly in emerging Asia (–5.7%). This was only partially offset by stronger developments in Latin America (+3.1%) and central and eastern Europe (+1.9%).
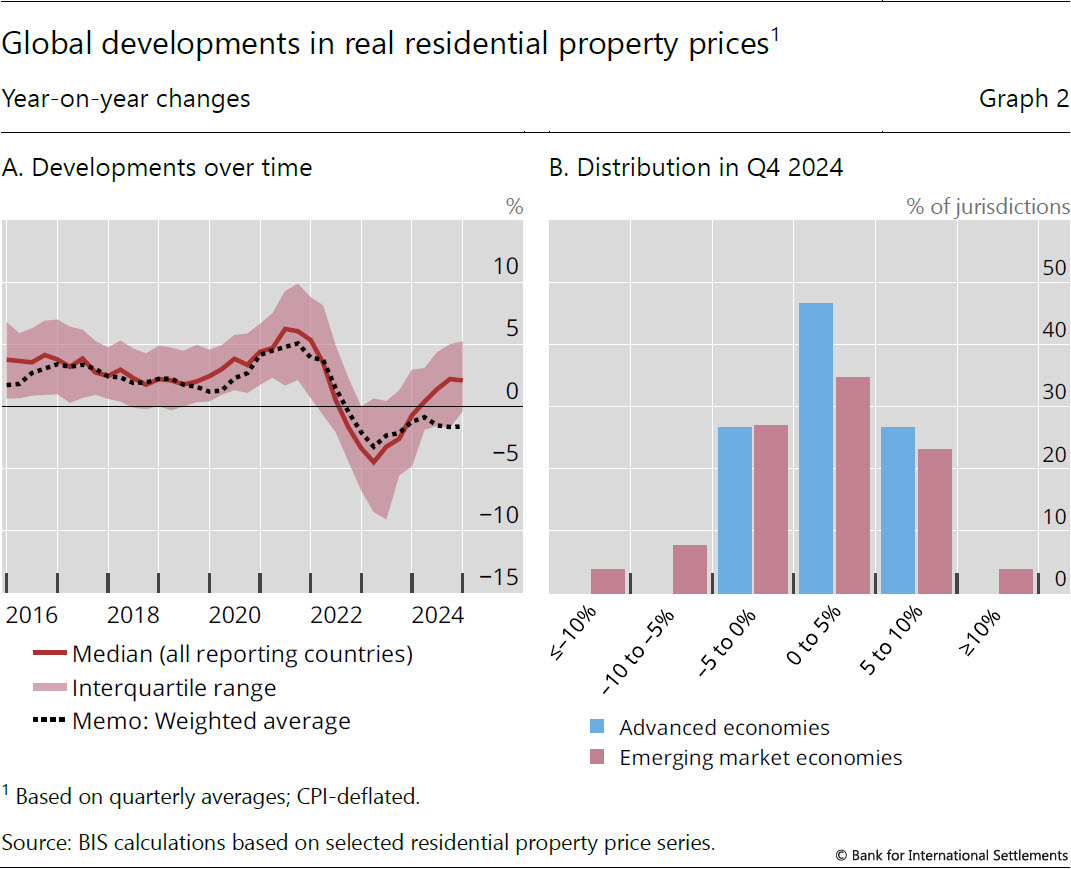
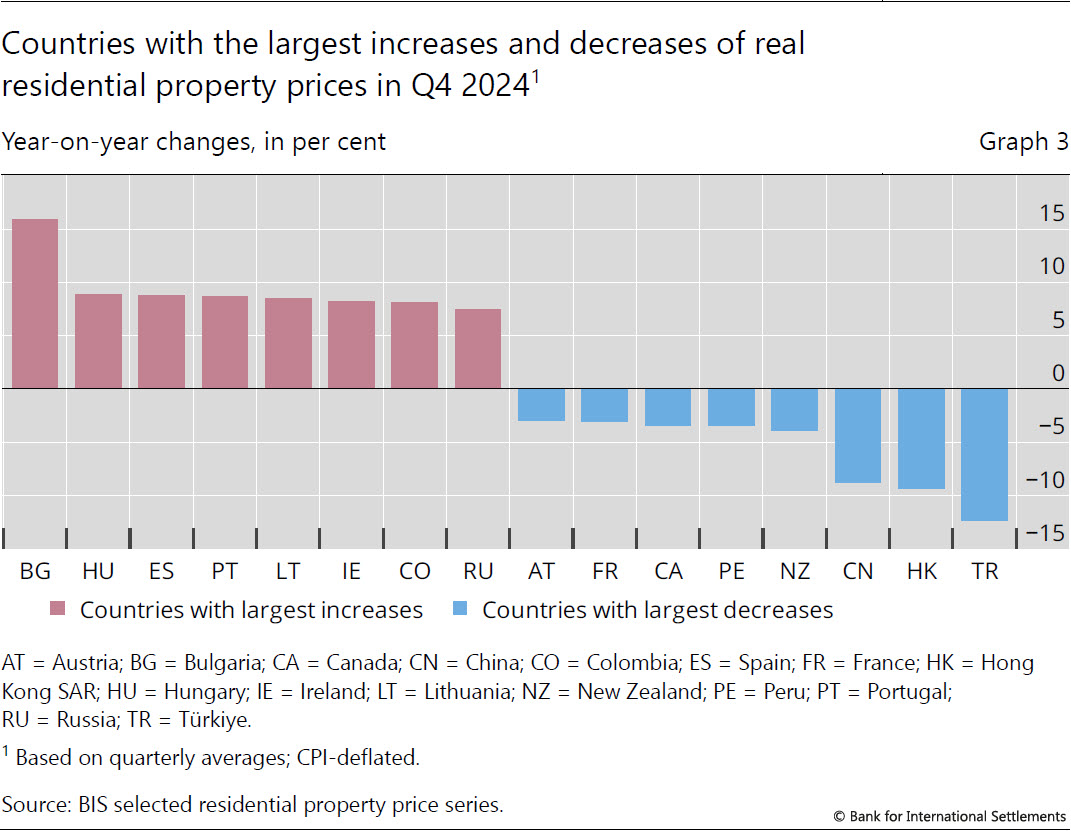
The fall observed in aggregate for global real residential property prices in Q4 2024 was mainly driven by a few large economies. In fact, the vast majority of jurisdictions experienced noticeable price increases, with the median price growth reaching 2.1% (Graph 2.A). About one half of AEs (45%) and one third of EMEs (35%) registered real price increases of 0 to 5%, and one fourth of AEs even saw robust growth in the 5 to 10% range (Graph 2.B).2 Among all reporting jurisdictions, Bulgaria registered the highest price increase (16%), followed by Hungary (9%) and Spain (9%). Conversely, prices fell significantly in Türkiye (–12%), Hong Kong SAR (–9%) and China (–9%) (Graph 3).
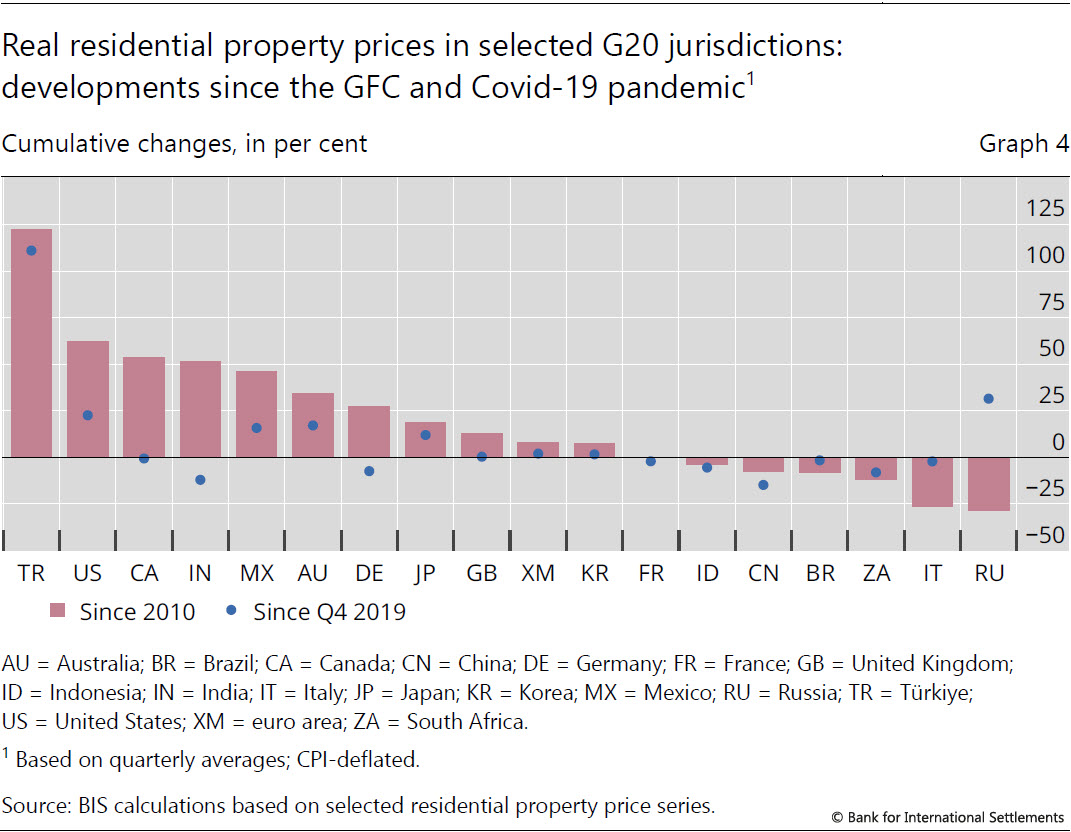
In most G20 economies, real house prices remain significantly above pre-pandemic levels, by 3% globally. However, there are significant differences between countries, with Türkiye leading (+111%) and China registering the steepest decline (–15%) since the pandemic.
From a longer-term perspective, aggregate real house prices exceed their post-Great Financial Crisis (GFC) levels by 20% globally (by 33% for AEs and 11% for EMEs). Since 2010, they have increased by more than 50% in non-European AEs, 22% in European AEs outside the euro area and 8% in the euro area. In EMEs, they increased by 20% in Latin America, 11% in central and eastern Europe and 10% in emerging Asia (Table 1). However, house prices remain below their post-GFC levels in one third of G20 jurisdictions, in particular South Africa (–12%) and Italy (–26%) (Graph 4).
Advanced economies
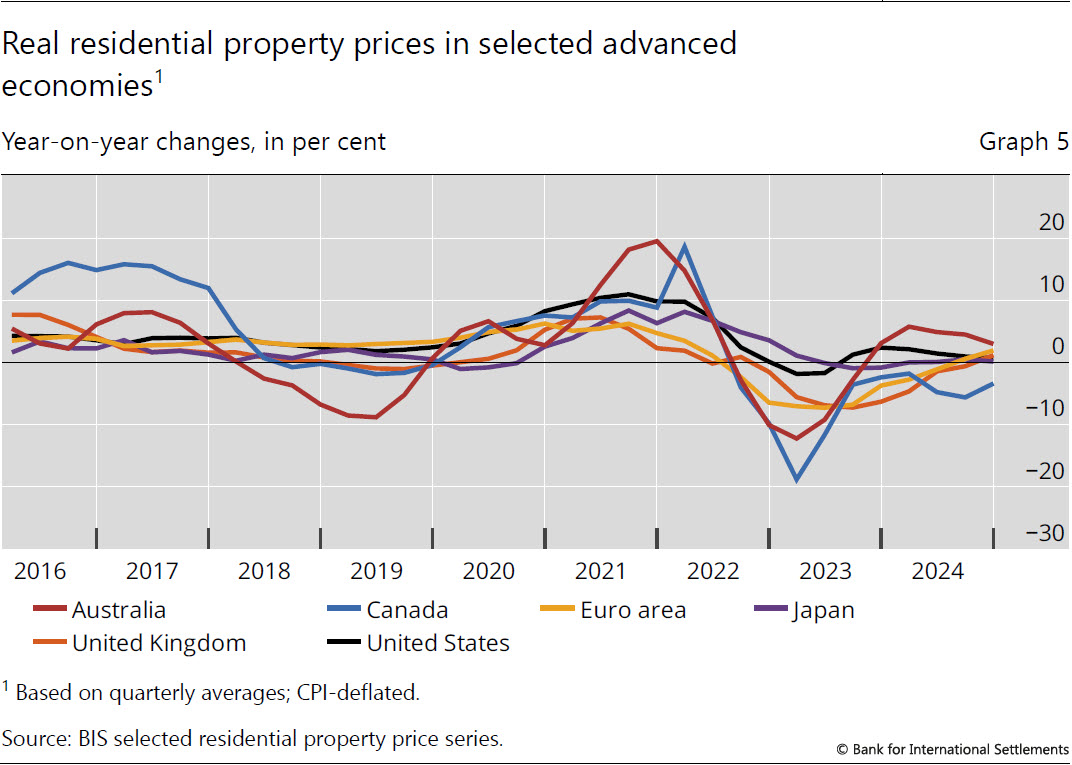
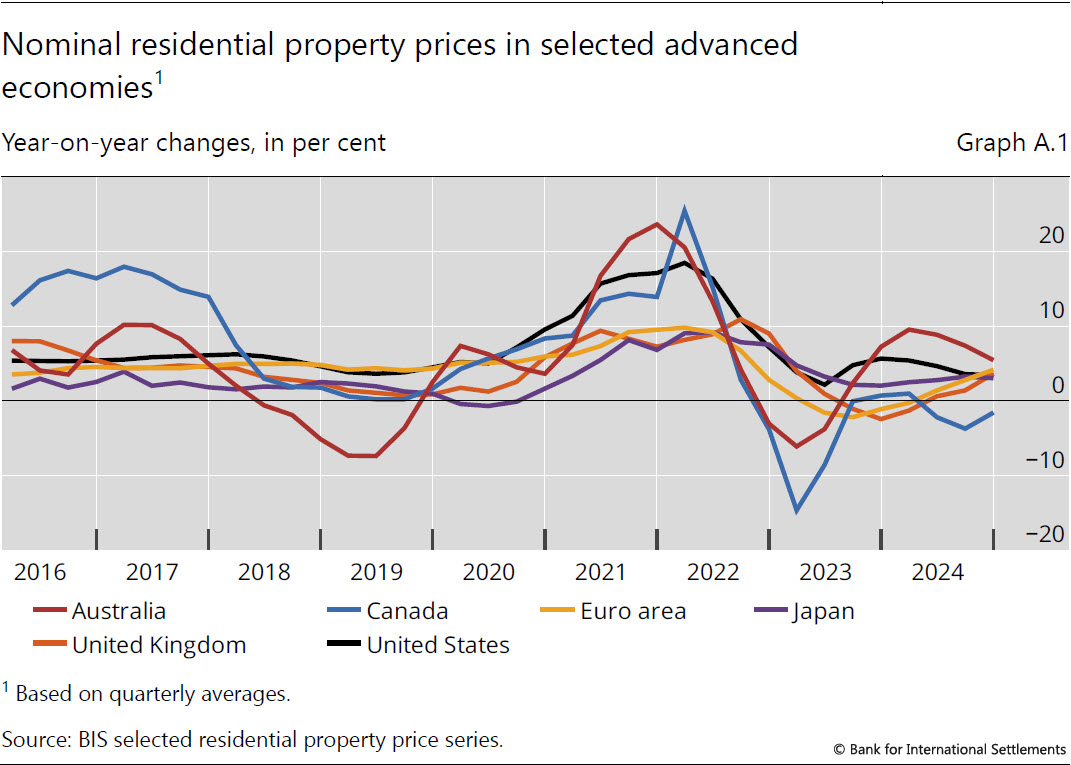
In aggregate for AEs, real residential property prices increased by 1.0% yoy in Q4 2024, the strongest growth since Q2 2022. Real house prices were up in the euro area (1.9%) and, for the first time since 2022, in the United Kingdom (1%). They remained broadly stable in the United States (1%) and Japan (0%) and continued to decline significantly in Canada (–3%) (Graph 5).
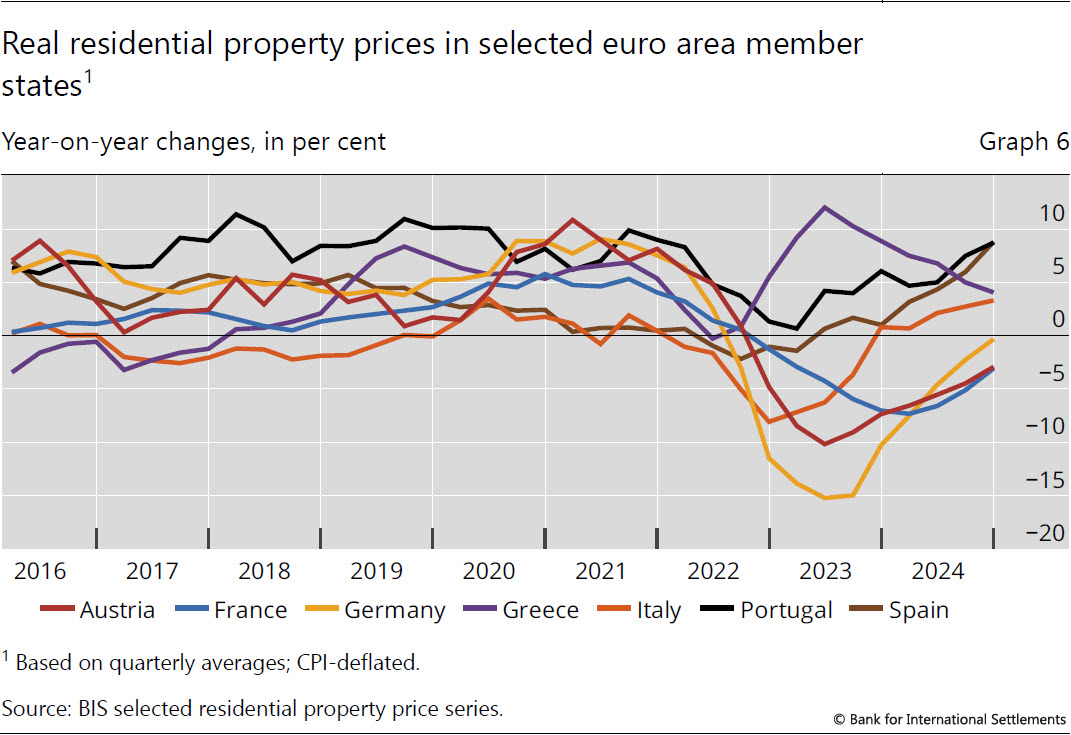
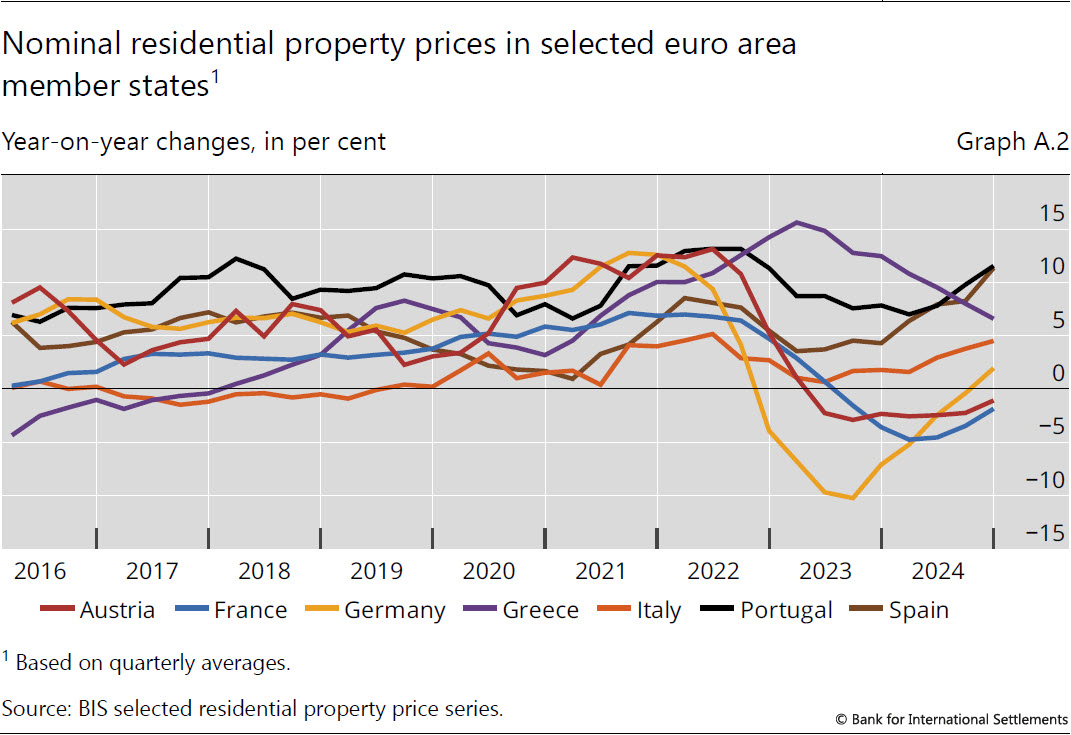
In Q4 2024, real house prices in the euro area increased by 1.9%. Spain (+9%) and Portugal (+9%) recorded the highest increases, followed by Greece (+4%) and Italy (+3%). Prices stabilised in Germany (0%) following an extended period of price declines. Meanwhile, they kept falling in Austria (–3%) and France (–3%), though at a slower pace than in previous quarters (Graph 6).
Emerging market economies
In Q4 2024, house prices in EMEs decreased further, by 3.5% yoy, largely driven by a few major Asian jurisdictions and despite the partial offset provided by Latin American economies.
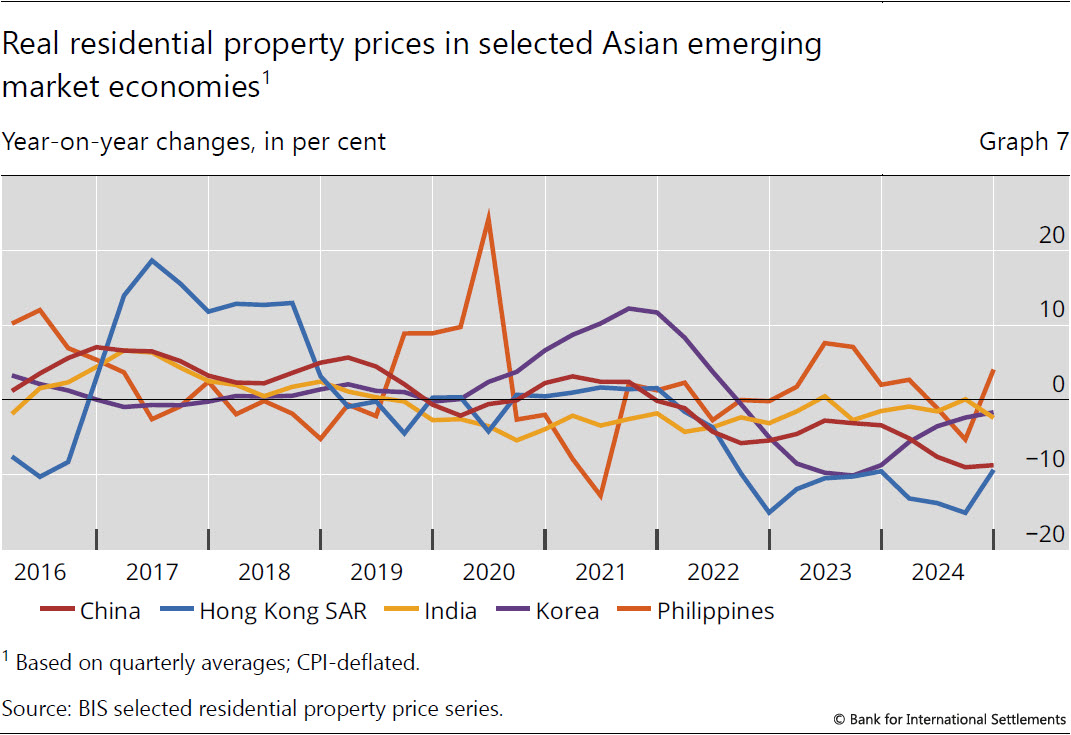
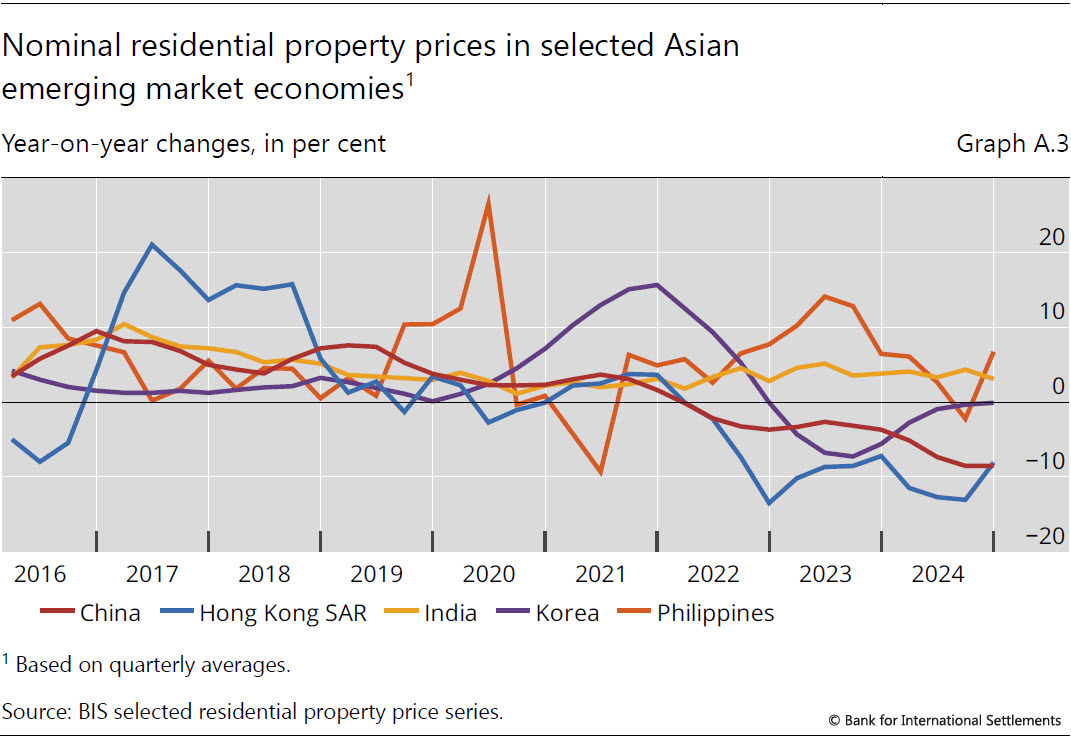
In emerging Asia, real residential property prices declined in many places: Hong Kong and China experienced significant declines of around 9% each. Prices also fell in India (–2%) and Korea (–2%). Conversely, prices rose in the Philippines (4%) (Graph 7).
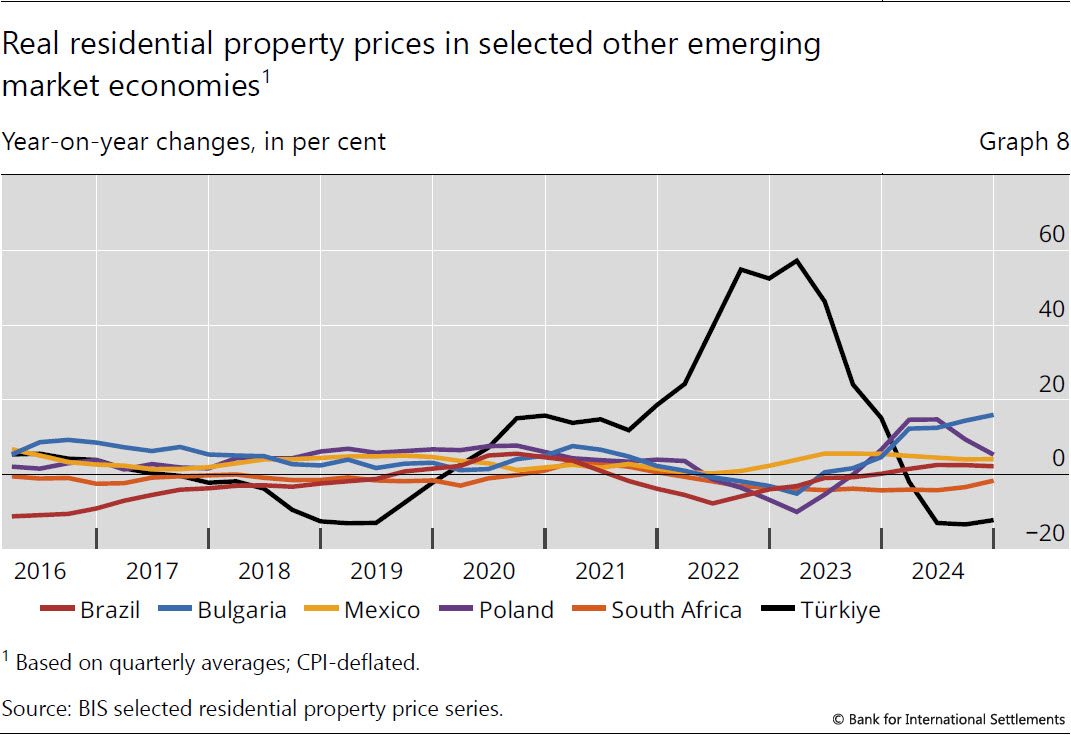
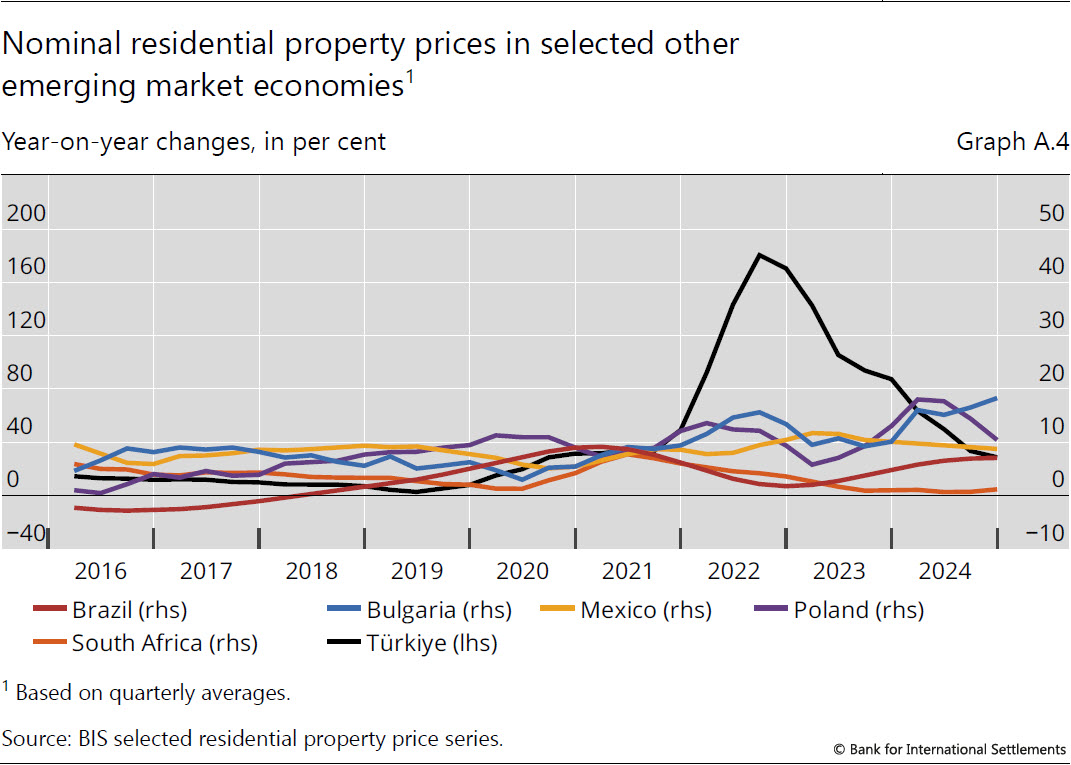
Real house prices in Latin America showed moderate growth, driven by Mexico (+4%) and Brazil (+2%). In central and eastern Europe, real prices rose by 1.9% in aggregate, with notable growth in Bulgaria (16%) and Poland (5%), while they fell in Türkiye (–12%). Prices continued to decline in South Africa (–2%) (Graph 8).
Annex: Nominal house price developments
1 In contrast, nominal growth in Q4 2024 remained at +1.8%. Real residential property prices refer to nominal residential property price indicators deflated by the consumer price index. Global figures are weighted aggregates of selected AEs (Australia, Canada, Denmark, the euro area, Iceland, Japan, New Zealand, Norway, Sweden, Switzerland, the United Kingdom and the United States) and EMEs (Brazil, Bulgaria, Chile, China, Colombia, Czechia, Hong Kong SAR, Hungary, India, Indonesia, Israel, Korea, Malaysia, Mexico, Morocco, North Macedonia, Peru, the Philippines, Poland, Romania, Russia, Singapore, South Africa, Thailand, Türkiye and the United Arab Emirates), based on PPP exchange rates. Regional aggregates have been available since 2007.
2 As regional aggregate developments (calculated using rolling GDP and PPP exchange rates) are driven mainly by changes in major economies, they can mask the detailed country-level features as analysed in Graph 2.B.