BIS residential property price statistics, Q3 2023

Key takeaways
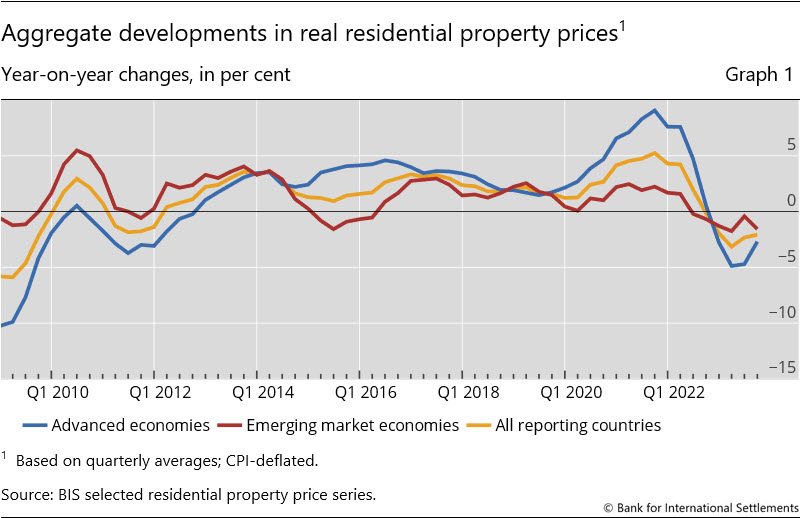
- Global house prices fell slightly less in the third quarter of 2023 than in the previous three months, by 2.1% year on year (yoy) in aggregate and in real terms.
- Real house prices continued to decline at a faster pace in advanced economies (AEs) (–2.7% yoy) than in emerging market economies (EMEs) (–1.6%).
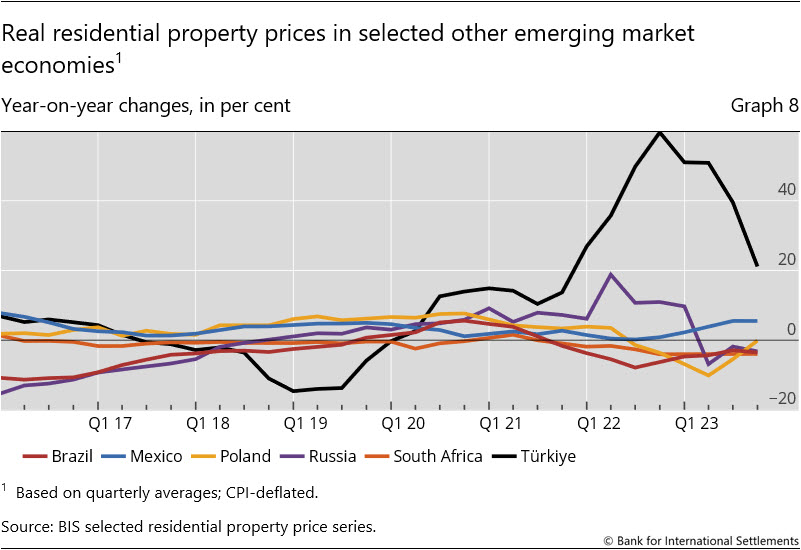
- Considerable differences still persist across major economies. For instance, real house prices remained relatively buoyant in Türkiye, increased in Mexico, remained broadly flat in Indonesia, Japan and the United States and declined sharply in the euro area, the United Kingdom and even more so in Korea.
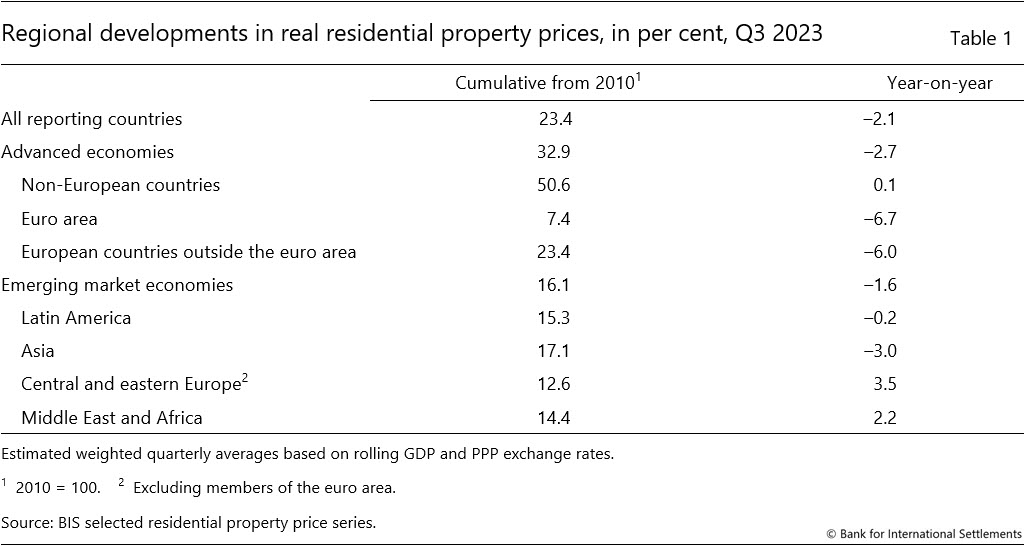
- In real terms, global house prices remain significantly (23%) above their average level after the 2007–09 Great Financial Crisis (GFC): by 33% in AEs and 16% in EMEs.
Summary of latest developments
In the third quarter of 2023, global house prices deflated by consumer prices declined by 2.1% yoy, compared with 2.3% in the second quarter.1 This evolution in real terms reflected the first pickup in nominal terms (+2.5%, after +2.3%), marking an end to the extended period of deceleration observed for nominal prices since early 2022, combined with a stabilisation in consumer price index (CPI) inflation.2
The decline in real house prices moderated to 2.7% yoy in AEs in Q3 2023, compared with –4.7% yoy in the previous quarter. In contrast, prices fell by 1.6% yoy in EMEs, after being almost stable (–0.4%) in Q2 2023 (Graph 1). This resulted from a further decline in Asia (–3.0%), partially offset by increases in central and eastern Europe (+3.5%) and in the Middle East and Africa region (+2.2%). Real prices remained broadly flat in Latin America.
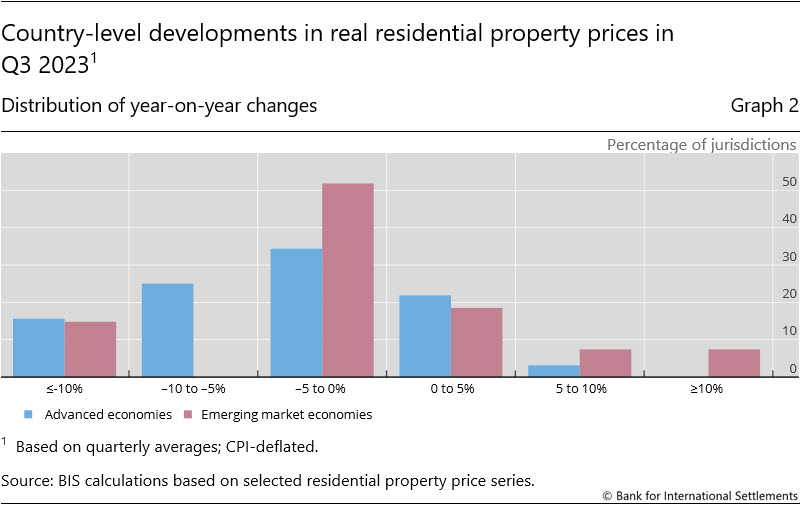
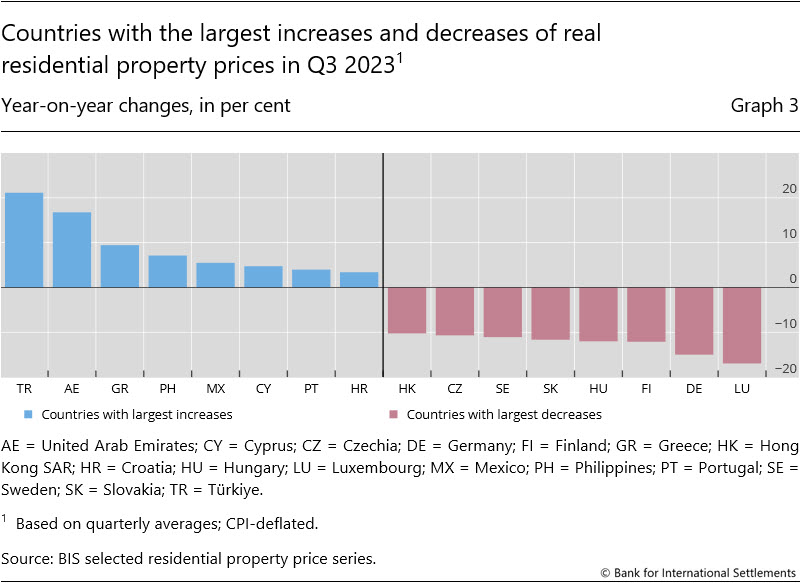
Country-level data indicate that the decline in real house prices remains more widespread among AEs, affecting three quarters of them, compared with two thirds of EMEs. In both groups, 15% of the jurisdictions are now registering price declines of more than 10% (Graph 2).3 Real prices declined the most sharply in Luxembourg (–17%), Germany (–15%), Finland, Hungary and Slovakia (all three economies at –12%) (Graph 3).
However, a significant number of countries still have buoyant housing markets. Real housing prices grew by at least 5% in four jurisdictions in EMEs, compared with only one in AEs. Prices grew the most rapidly in Türkiye (+21%), the United Arab Emirates (+17%), Greece (+9%), the Philippines (+7%) and Mexico (+6%).
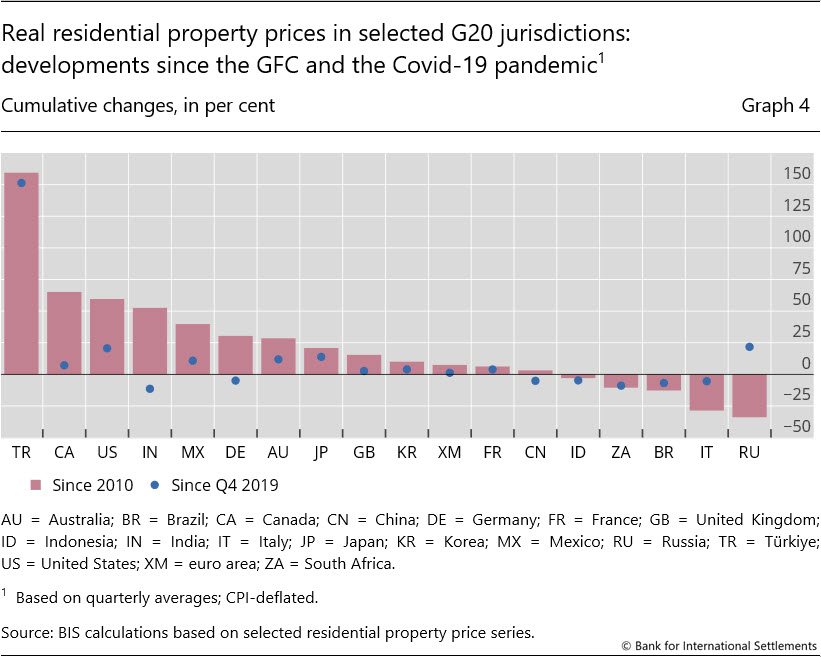
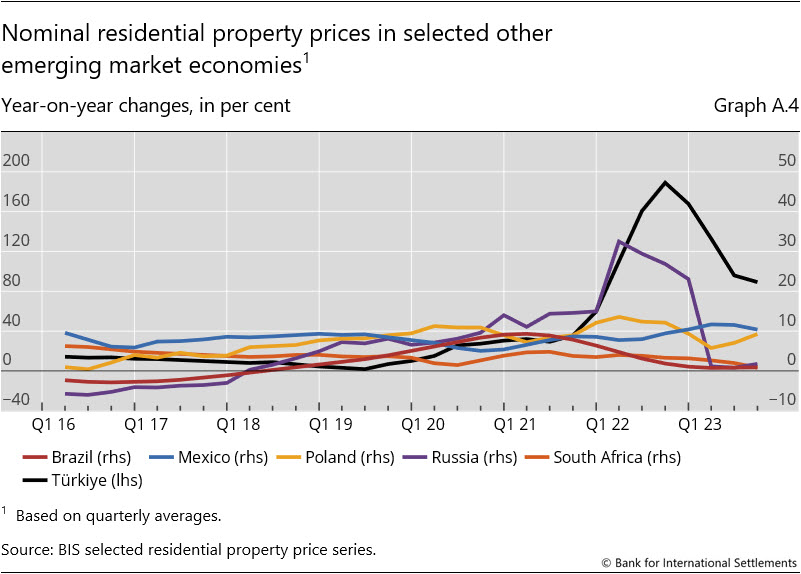
Despite their recent fall, global real residential prices still remain above their pre-Covid-19 pandemic levels (by 6% in aggregate). Compared with Q4 2019, they have increased by 150% in Türkiye, 21% in the United States and 14% in Japan. In contrast, real prices have experienced declines of 11% in India, 9% in South Africa and 7% in Brazil (Graph 4).
From a longer-term perspective, global house prices exceed (in real terms) their immediate post-GFC average by 23% (33% for AEs and 16% for EMEs) (Table 1). Among G20 economies, real prices have more than doubled since 2010 in Türkiye (up by 160%) and have risen by 65% in Canada, 60% in the United States and more than 50% in India. Conversely, at the other end of the scale, they remain well below their post-GFC levels in Italy, by 29%.
Advanced economies
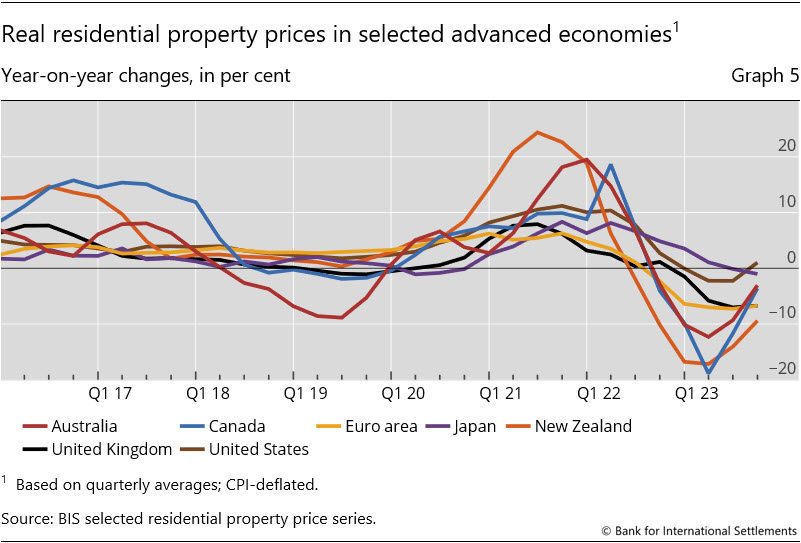
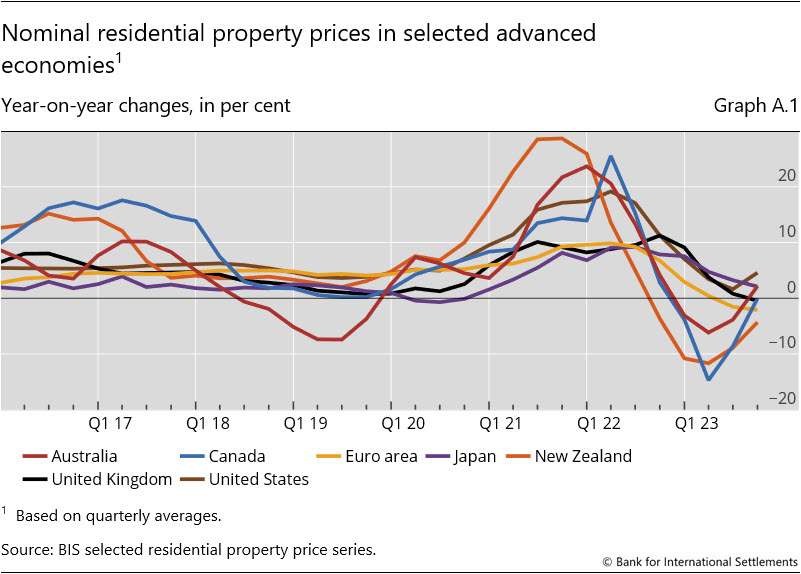
In aggregate for the group of AEs, real residential property prices declined by 2.7% yoy in Q3 2023, marking a significant moderation from the 4.7% fall observed in the previous quarter. Among the major economies, real prices were broadly stable in the United States (+1%) and Japan (–1%). They continued to fall, though less rapidly than in the recent past, in Australia (–3%) and Canada (–4%). They dropped markedly in the United Kingdom and the euro area (–7% in both cases) (Graph 5).
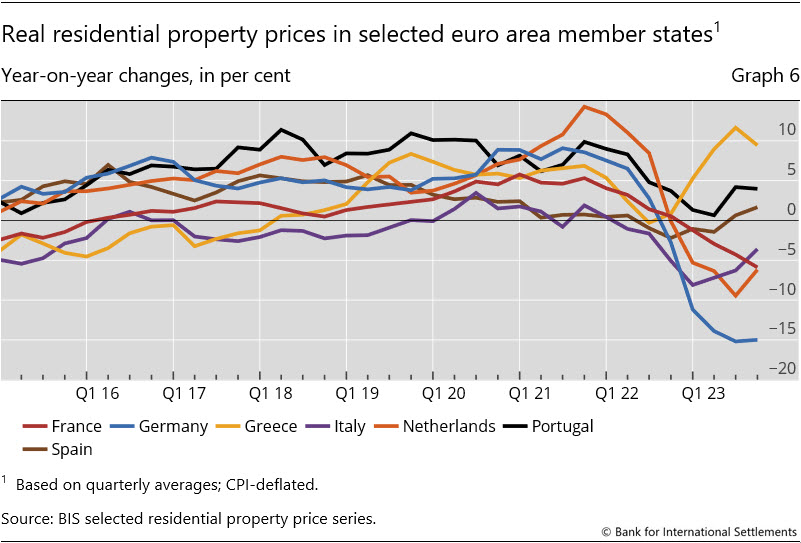
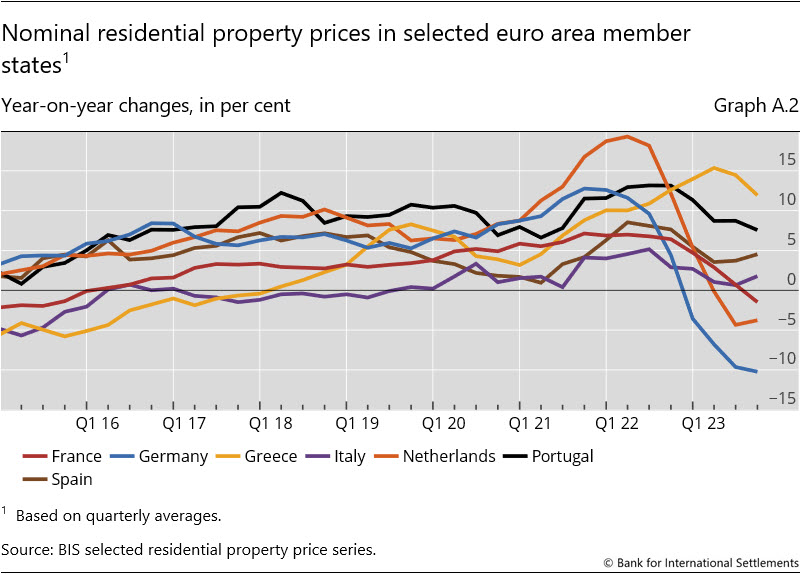
Within the euro area, real house prices continue to show significant variations among member states. Prices surged by 9% in Greece and were up by 4% in Portugal and by 2% in Spain. In contrast, they declined by 4% in Italy (nonetheless representing a slight improvement from the stronger decline observed over the past few quarters), 6% in both France and the Netherlands and, notably, 15% in Germany (Graph 6).
Emerging market economies
Real residential property prices extended their declines in EMEs during the third quarter of 2023, to –1.6% yoy (from –0.4% in Q2 2023).
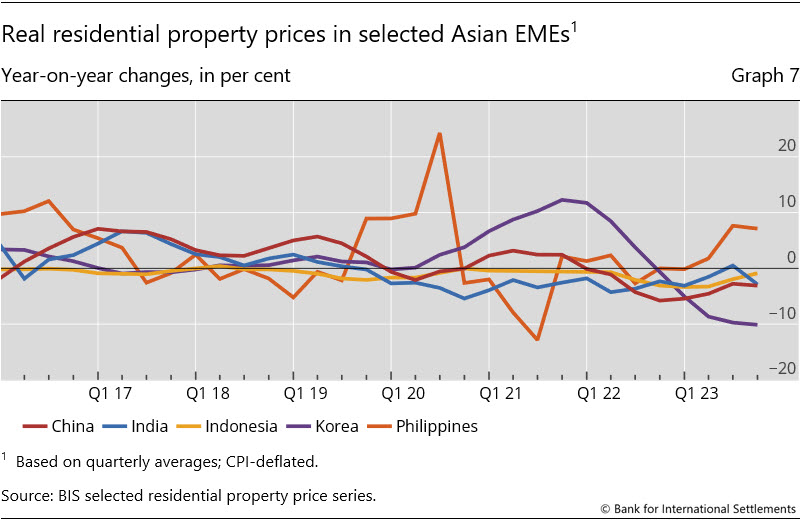
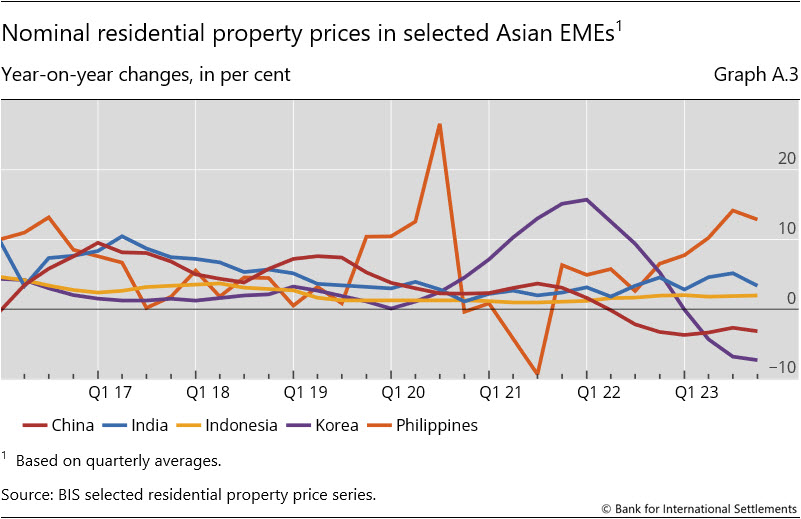
Prices fell by 3.0%, on average, in Asian economies. They increased by 7% in the Philippines, remained almost stable in Indonesia (–1%) and fell by 3% in both China and India and, notably, by 10% in Korea (representing the sharpest decline observed in 25 years in this country) (Graph 7).
Real prices remained broadly unchanged in Latin America (–0.2% in aggregate), as the continued decline in Brazil (–4%) was almost fully offset by a significant rise in Mexico (+6%). In central and eastern European countries, real prices grew by +3.5% in aggregate, driven by the notable surge in Türkiye (+21%) – though this surge was much more moderate when compared with the peak observed at the end of 2022.. Lastly, prices fell by 4% in South Africa (Graph 8).
Annex: Nominal house price developments
1 Real residential property prices refer to nominal residential property price indicators deflated by the consumer price index. Global figures are weighted aggregates of selected AEs (Australia, Canada, Denmark, the euro area, Iceland, Japan, New Zealand, Norway, Sweden, Switzerland, the United Kingdom and the United States) and EMEs (Brazil, Bulgaria, Chile, China, Colombia, Czechia, Hong Kong SAR, Hungary, India, Indonesia, Israel, Korea, Malaysia, Mexico, Morocco, North Macedonia, Peru, the Philippines, Poland, Romania, Russia, Singapore, South Africa, Thailand, Türkiye and the United Arab Emirates), based on PPP exchange rates. Regional aggregates have been available since 2007.
2 Residential property price developments in nominal terms are shown in the annex.
3 As regional aggregate developments are driven mainly by changes in major economies, they can mask the detailed country-level features presented in the histogram.