BIS residential property price statistics, Q2 2023

Key takeaways
- In the second quarter of 2023, global house prices fell more moderately than in the previous three months, by an aggregate 2.4% year on year (yoy) in real terms. This was despite a further slowdown in nominal house prices and reflected the effect of slowing consumer price inflation.
- Real house prices continued to fall markedly in advanced economies (AEs) (–4.7% yoy). In emerging market economies (EMEs), by contrast, prices remained almost unchanged (–0.5%).
- Considerable differences still persist across major economies. For instance, real house prices surged in Türkiye, remained flat in India and Japan, and declined sharply in the United Kingdom, the euro area and even more so in Australia, Korea and Canada.
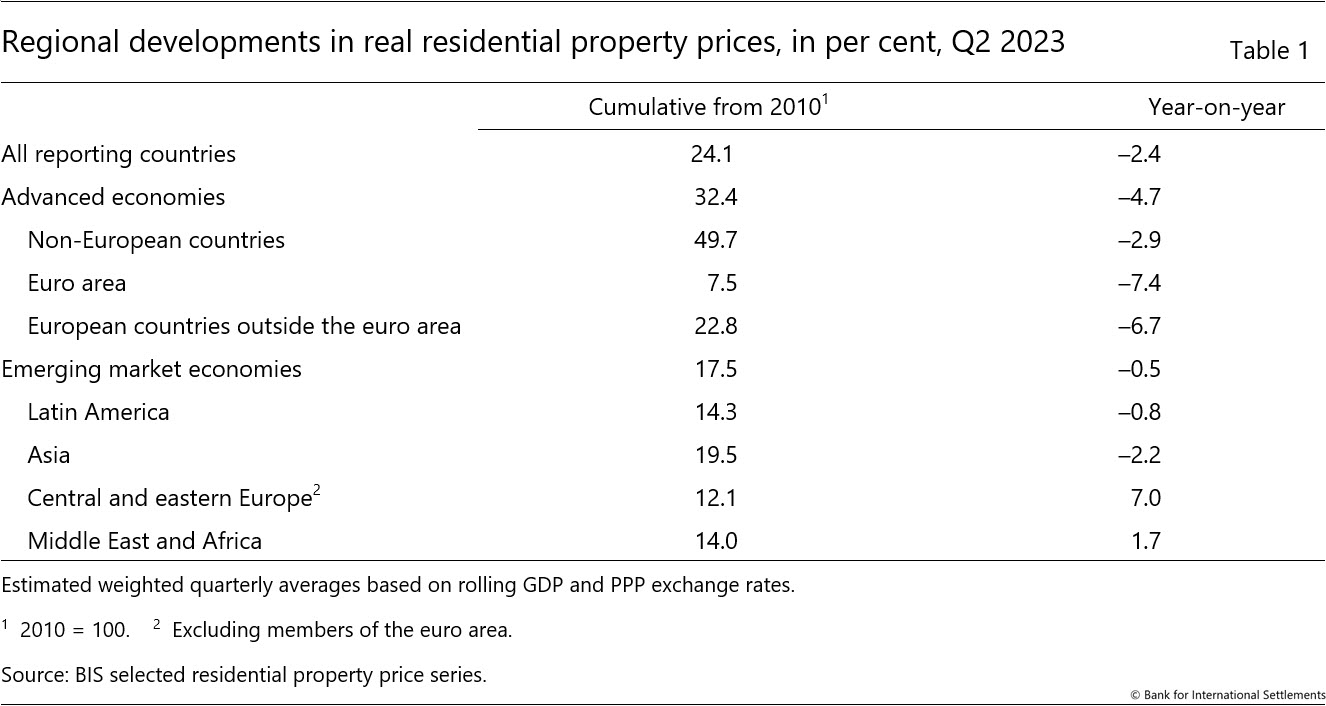
- In real terms, global house prices remain significantly (24%) above their average level after the 2007–09 Great Financial Crisis (GFC) (by 32% in AEs and 18% in EMEs).
- The residential and commercial property price data sets are now accessible through the new BIS Data Portal, with a dedicated dashboard for convenience.1
Summary of latest developments
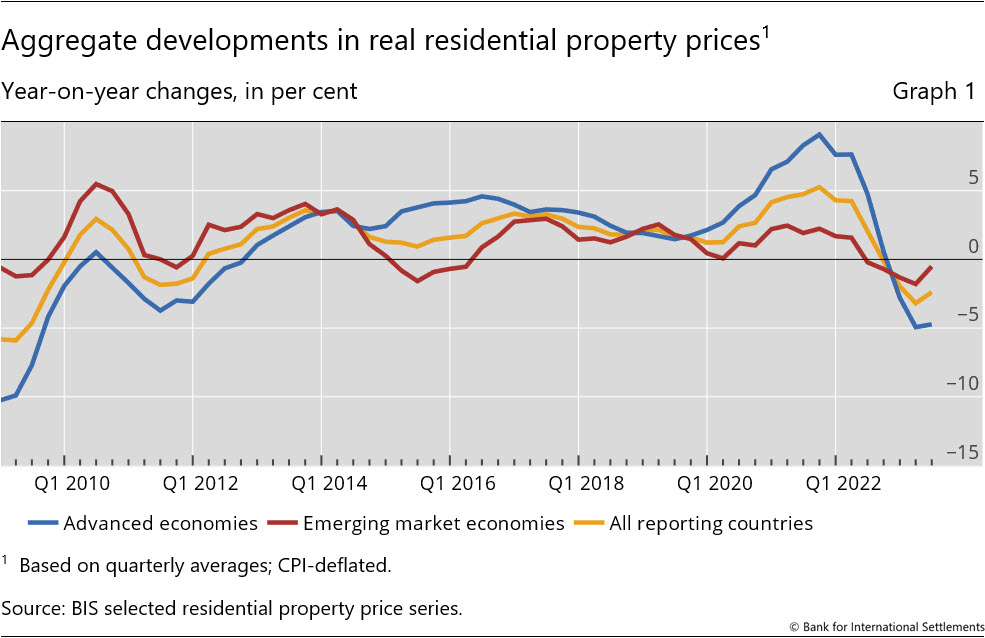
In the second quarter of 2023, global house prices deflated by consumer prices declined by 2.4% yoy, compared with 3.2% in the first quarter.2 This evolution in real terms was despite a further pronounced slowdown in nominal price growth (+2.2%, after 3.4%) and reflected the impact of moderating consumer inflation.3
Real house prices declined in AEs by 4.7% yoy, similar to the previous quarter (–4.9% yoy). In EMEs, the fall in prices moderated to –0.5% yoy, compared with –1.8% yoy in Q1 2023 (Graph 1). This resulted from the combination of further declines in Asia and Latin America (–2.2% and –0.8%, respectively), which were almost offset by strong price increases in central and eastern Europe (+7%).
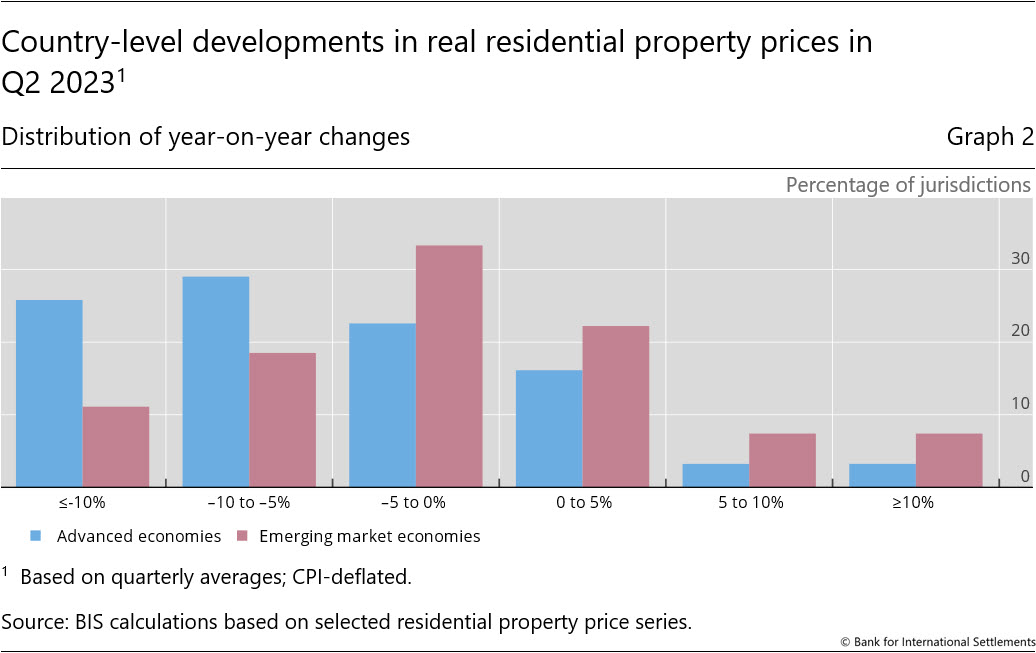
Country-level data show that the decline in real house prices remains more widespread among AEs, affecting 80% of them, compared with only 60% of EMEs. Moreover, one quarter of AEs are now registering price declines of more than 10%, versus only one tenth of EMEs (Graph 2).4 Prices declined sharply in Hungary (–16%), Germany and Sweden (both –15%) (Graph 3).
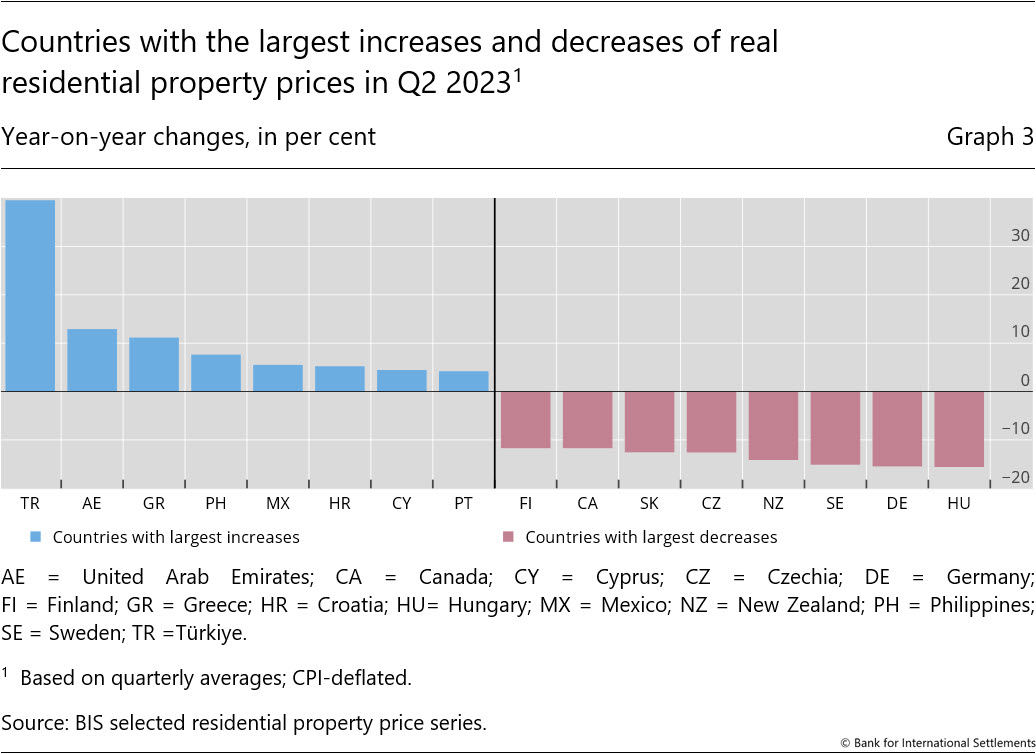
However, there are still a significant number of countries with buoyant housing markets. Real housing prices grew by at least 5% in one sixth of EMEs (compared with in only two jurisdictions in AEs). Prices grew the most rapidly in Türkiye (+40%), the United Arab Emirates (+13%) and Greece (+11%).
Despite their recent fall, global real residential prices remain well above their pre-Covid-19 pandemic levels (by 6% in aggregate). Compared with Q4 2019, they have increased by almost 160% in Türkiye, close to 20% in the United States, and 15% in Japan. In contrast, real prices have fallen by 8% in Brazil and 7% in both India and South Africa (Graph 4).
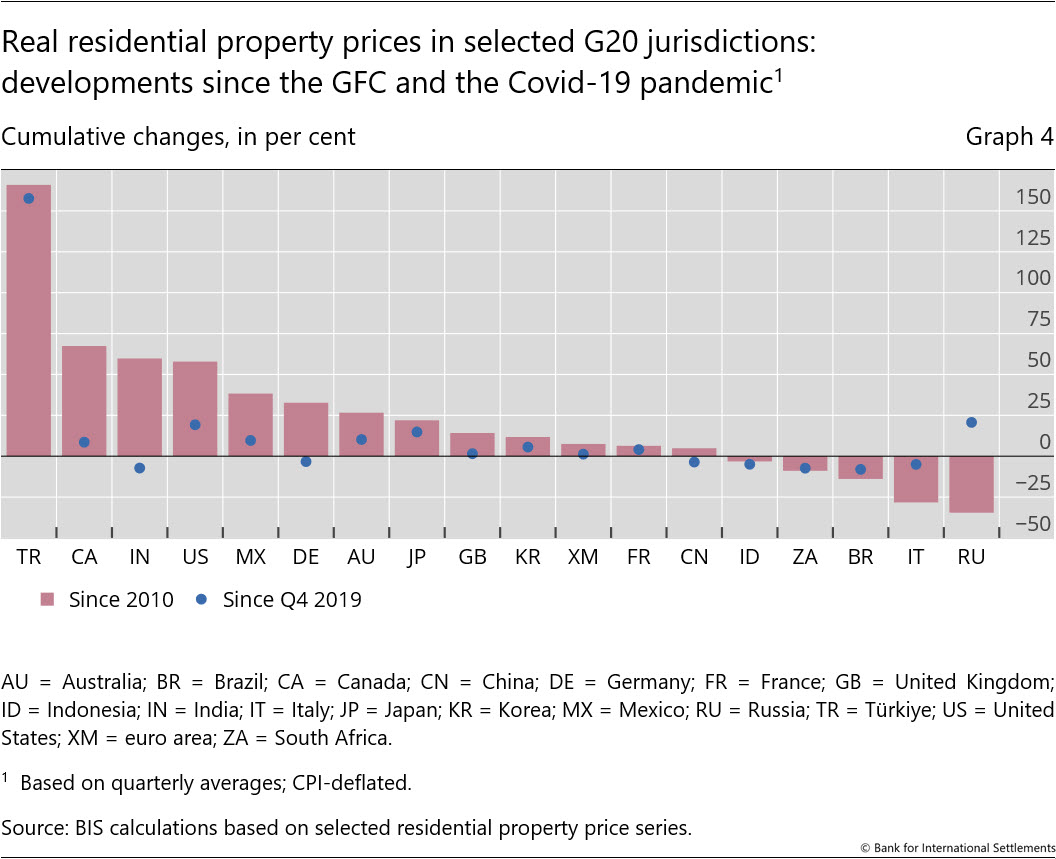
From a longer-term perspective, global house prices now exceed (in real terms) their immediate post-GFC average by 24% (32% for AEs and 18% for EMEs) (Table 1). Among the G20 economies, real prices have more than doubled since 2010 in Türkiye (up by almost 170%) and have risen by close to 70% in Canada and 60% in both India and the United States. At the other end of the scale, they remain well below their post-GFC levels in Italy, by 28%.
Advanced economies
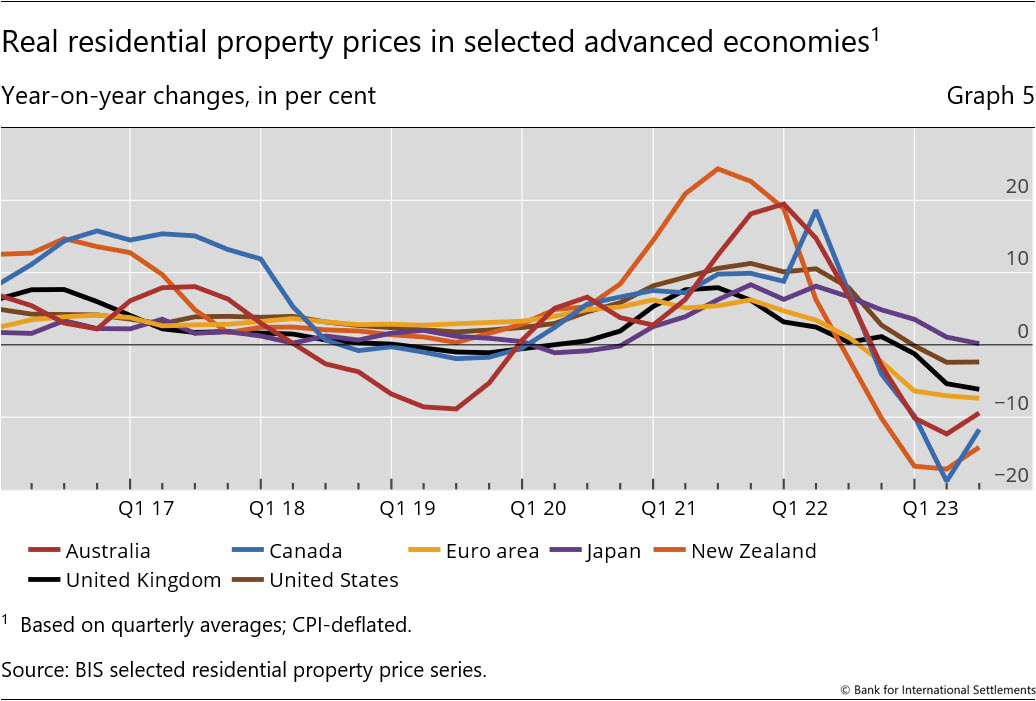
In aggregate for the group of AEs, real residential property prices declined by 4.7% yoy in Q2 2023, slightly less than the 4.9% fall registered in Q1 2023. Among the major economies, real prices were stable only in Japan (+0%). They fell by 2% in the United States, 6% in the United Kingdom and 9% in Australia. Double-digit declines were recorded in Canada (–12%) and New Zealand (–14%) (Graph 5).
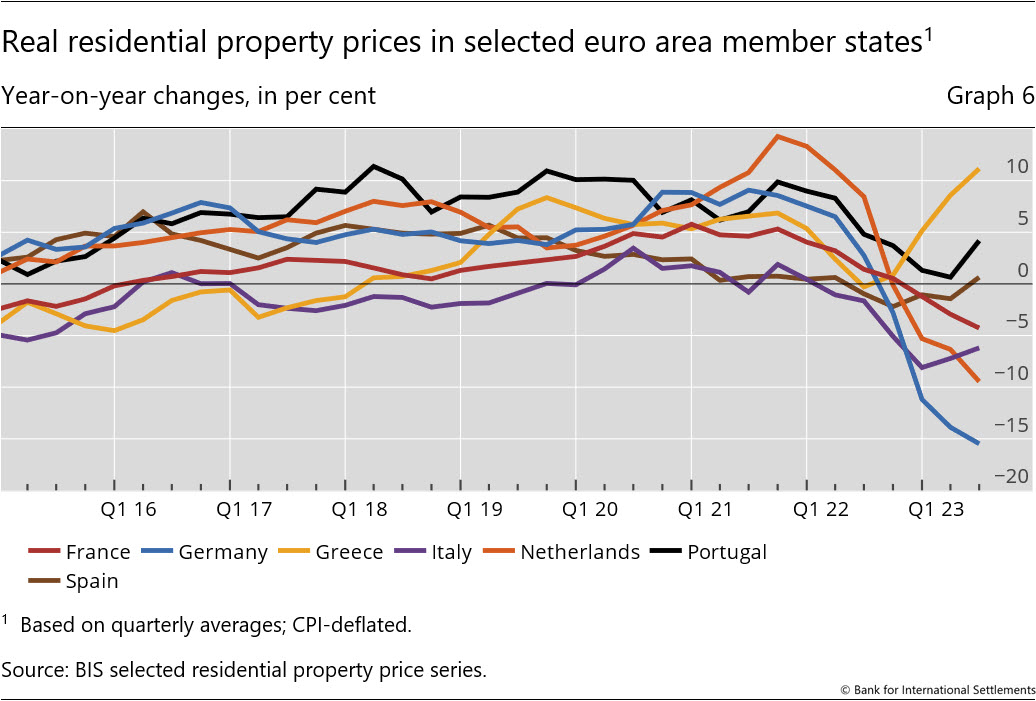
Real house prices fell further in the euro area (–7%), where developments continued to vary significantly among member states. Prices surged by 11% in Greece and were up by 4% in Portugal, while they stayed broadly unchanged in Spain (+1%). They declined by 4% in France, 6% in Italy, 9% in the Netherlands and, notably, 15% in Germany (Graph 6).
Emerging market economies
The decline in real residential property prices moderated in EMEs during the second quarter of 2023, at –0.5% yoy (from –1.8% in Q1 2023).
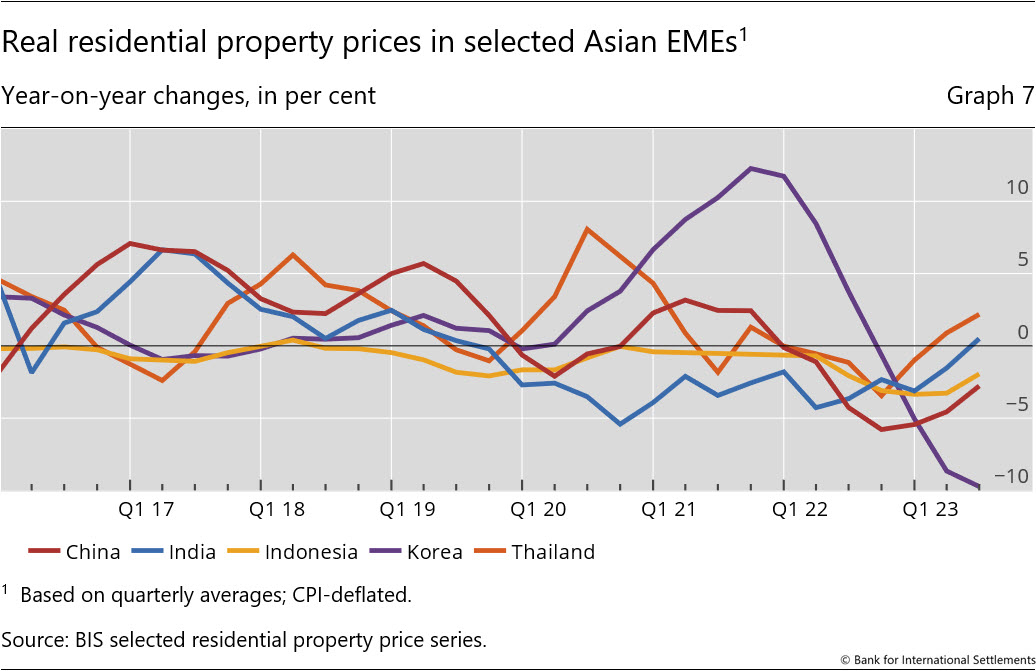
Prices fell on average in Asian economies, by 2.2% in aggregate. They increased by 2% in Thailand, were stable in India (+0%) and fell by 2% in Indonesia, 3% in China and, notably, 10% in Korea (Graph 7).
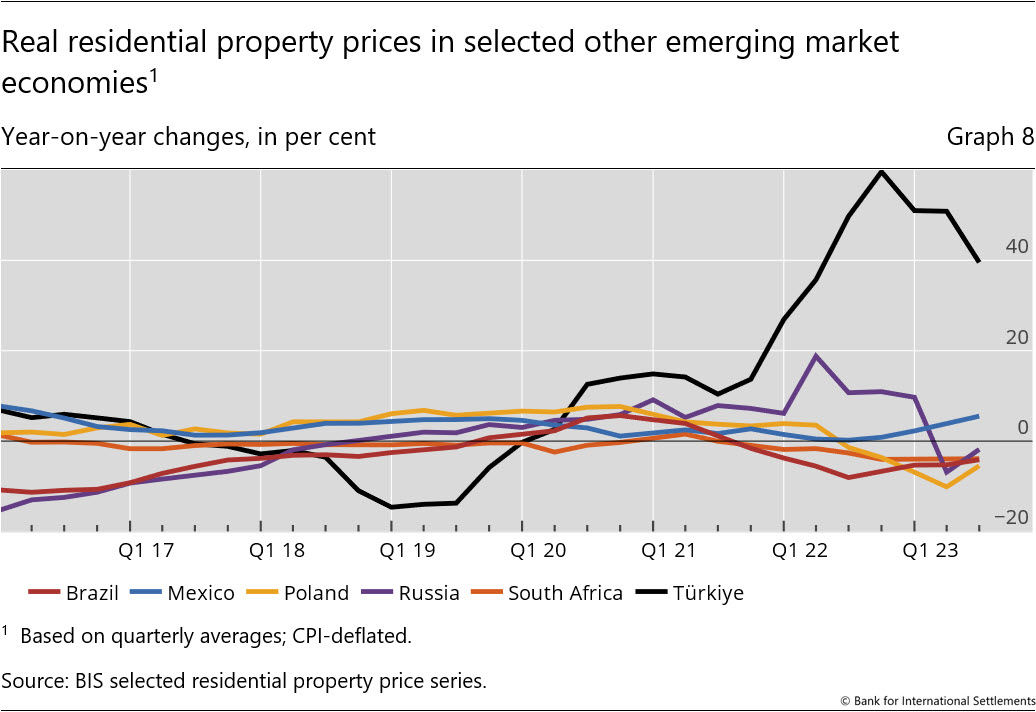
Real prices fell slightly in Latin America (–0.8% in aggregate), as their continued decline in Brazil (–4%) was partly offset by a significant rise in Mexico (+6%). In central and eastern European countries, real prices grew by +7.0% in aggregate, driven by the surge (+40%) in Türkiye. Lastly, prices fell by 4% in South Africa (Graph 8).
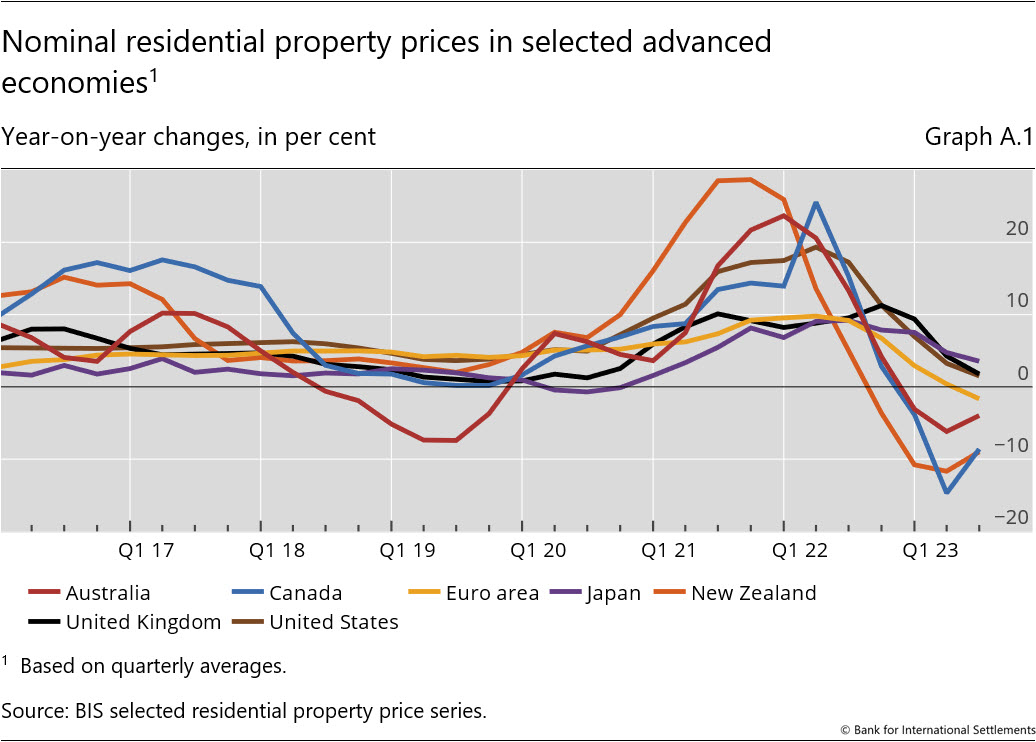
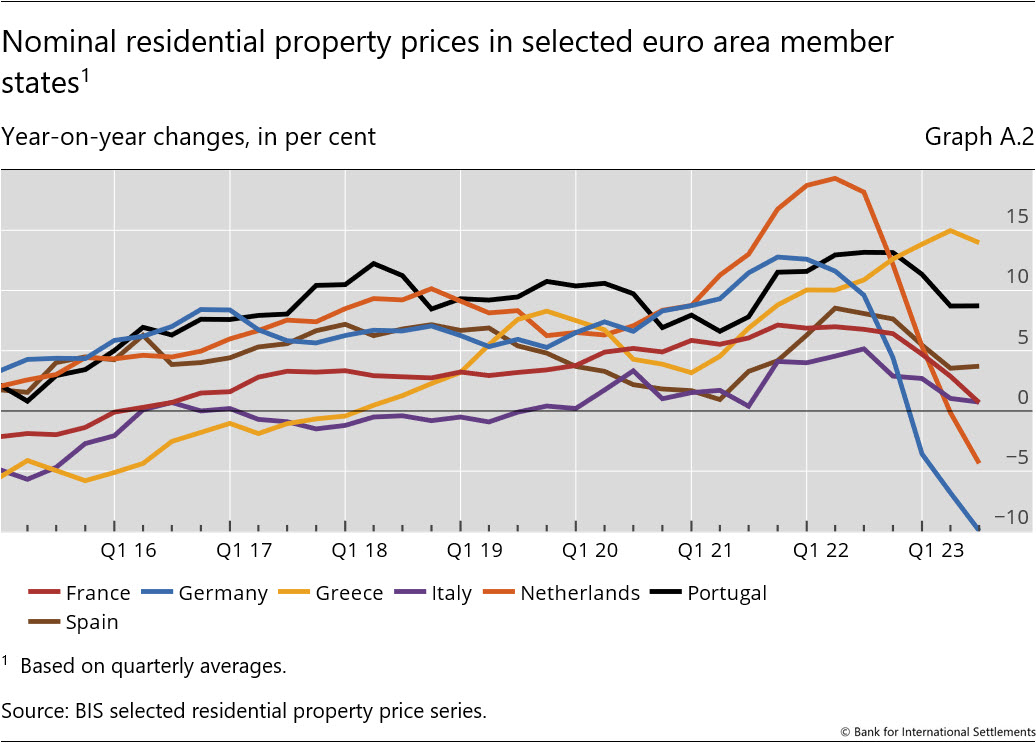
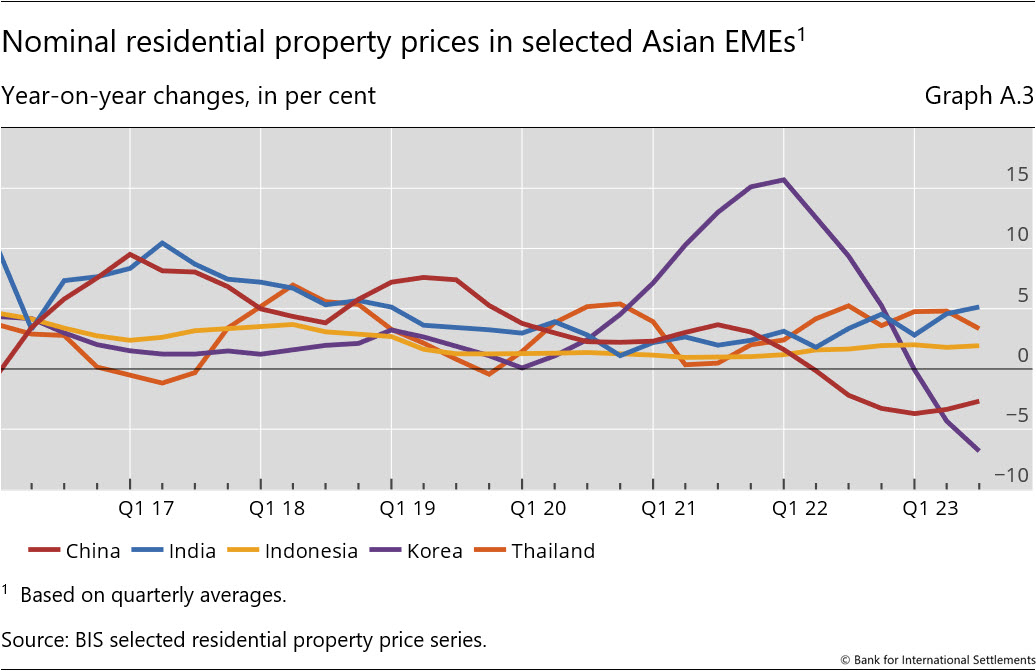
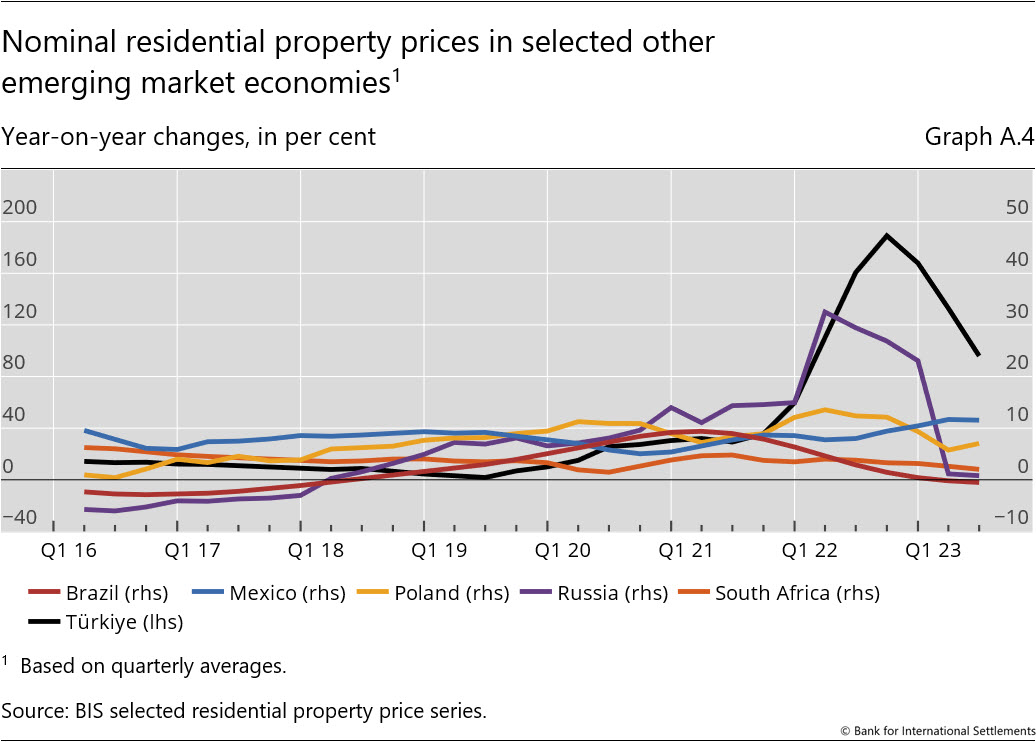
Annex: Nominal house price developments
1 The property price statistics are accessible via the BIS Data Portal, https://data.bis.org.
2 Real residential property prices refer to nominal residential property price indicators deflated by the consumer price index. Global figures are weighted aggregates of selected AEs (Australia, Canada, Denmark, the euro area, Iceland, Japan, New Zealand, Norway, Sweden, Switzerland, the United Kingdom and the United States) and EMEs (Brazil, Bulgaria, Chile, China, Colombia, Czechia, Hong Kong SAR, Hungary, India, Indonesia, Israel, Korea, Malaysia, Mexico, Morocco, North Macedonia, Peru, the Philippines, Poland, Romania, Russia, Singapore, South Africa, Thailand, Türkiye and the United Arab Emirates), based on PPP exchange rates. Regional aggregates have been available since 2007.
3 The year-on-year growth in CPI moderated in 95% of the economies covered in the BIS data set between the first and second quarter of 2023. Residential property price developments in nominal terms are shown in the annex.
4 As regional aggregate developments are driven mainly by changes in major economies, they can mask the detailed country-level features presented in the histogram.