BIS residential property price statistics, Q4 2021

Key takeaways
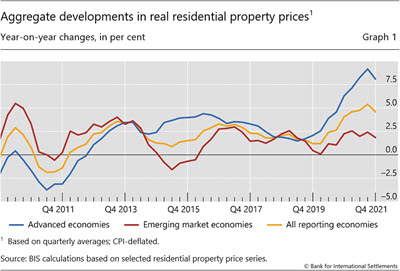
- Global real house prices growth moderated slightly to 4.6% year on year in aggregate in the final quarter of 2021 but remained high by historical standards.1
- This strong growth in real terms reflected very rapid nominal developments (up by almost 10% year on year, the highest rate since the eve of the Great Financial Crisis (GFC), partly offset by the acceleration in consumer price indices (CPIs).2
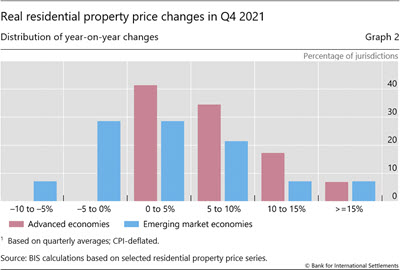
- Real house price developments continued to diverge between advanced economies (AEs, +8.1% year on year) and emerging market economies (EMEs, +1.9 %). Strong price growth (ie above 5%) was recorded in about two thirds of AEs, compared with only one third of EMEs.
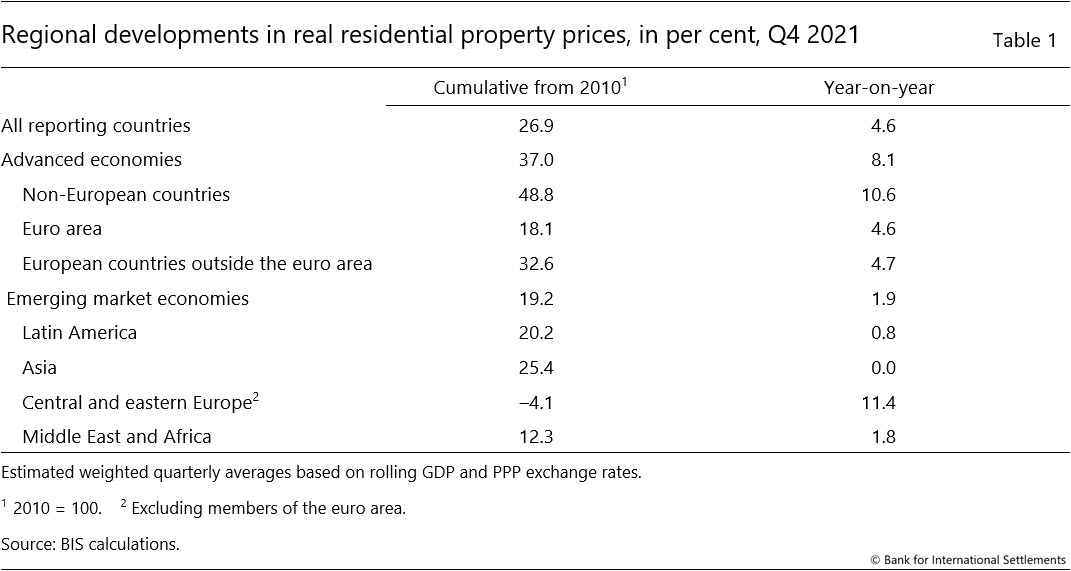
- In real terms, global house prices now exceed their immediate post-GFC average levels by 27%.
Summary of latest developments
Global growth in real house prices moderated to 4.6% year on year in aggregate in the final quarter of 2021, down from 5.4% in the previous quarter. This reflected record growth in nominal house prices post-GFC, from 9.2% to 9.8% year on year, offset by the parallel rapid rise in CPI inflation.
Real house price growth remained strong in advanced economies (AEs), at +8.1%, but was markedly lower in emerging market economies (EMEs), which saw growth of 1.9% on average (Graph 1). There were, however, substantial differences across major EME regions: real house price growth reached 11.4% in central and eastern Europe, while it was considerably lower in emerging Asia (0.0%), Latin America (0.8%) and the Middle East and Africa region (1.8%).
Country-level data confirm that housing inflation was concentrated among AEs, where real residential property prices increased year on year in all jurisdictions in the last quarter of 2021. Among these countries, strong price growth (ie above 5% year on year) was recorded in three out of five jurisdictions (down from four out of five in Q3) (Graph 2). At the same time one third of the EME's saw a fall in prices (this was the case for one quarter, in Q3).3
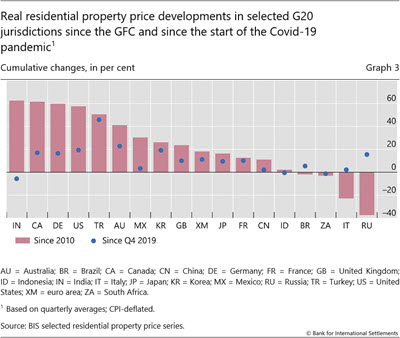
In real terms, global house prices now exceed their immediate post-GFC average by 26.9% (and by 37.0% and 19.2% for AEs and EMEs, respectively (Table 1)). Among the G20 economies, real prices have risen the most – by more than 50% since 2010 – in India, Canada, Germany, the United States and Turkey. At the other end of the scale, they remain well below their post-GFC levels in Italy and Russia, by 23% and 37% respectively.
Global residential prices appear to have gone from strength to strength since the outbreak of the Covid-19 pandemic. Compared with Q4 2019, real prices have increased by close to 50% in Turkey, by around 20% in Australia, Korea and the United States, and by around 15% in Canada, Germany and Russia. A major exception is India, where prices have fallen markedly over the past two years (–6%, Graph 3).
Advanced economies
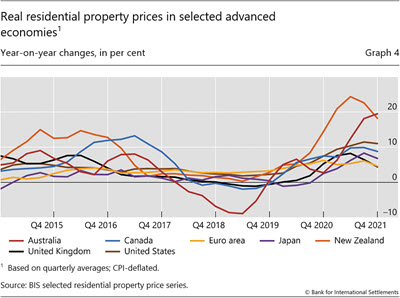
In aggregate for the group of AEs, real residential property prices grew by 8.1% in Q4 2021, from 9.2% in Q3. Prices rose with double-digit rates in Australia (+19%), New Zealand (+18%) and the United States (+11%). They increased somewhat less vigorously in Canada (+9%), Japan (+7%) and the United Kingdom (+4%) (Graph 4).
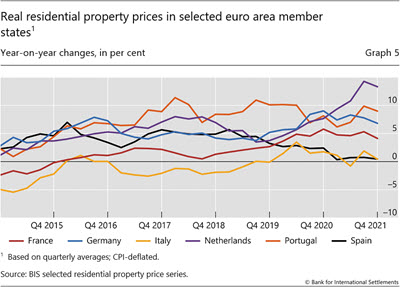
Prices were up by 5% in the euro area, where developments continued to vary significantly among member states. Strong real house price growth persisted in the Netherlands (+13%), Portugal (+9%), Germany (+7%) and, to a lesser extent, France (+4%), while prices remained basically flat in Italy and Spain (Graph 5).
Emerging market economies
In contrast to AEs, real residential property prices lost momentum in EMEs during the fourth quarter of 2021, growing by 1.9% year on year compared with 2.4% in Q3.
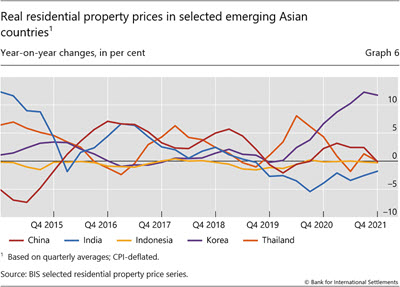
House prices were stable in Asia year on year, with significant variation across countries. Real prices surged further in Korea (+12%), remained flat in China, Indonesia and Thailand and kept falling moderately in India (–2%)4 (Graph 6).
Real house prices were also almost flat in Latin America in aggregate (+0.8% year on year). Prices were up slightly in Mexico (+1%), and remained unchanged in Brazil.
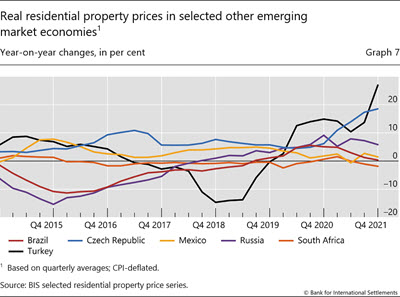
In contrast to other EME regions, real prices expanded in central and eastern Europe, by an average of 11.4% year on year, led in particular by a 27% surge in Turkey, up from 14 % in Q3,5 and Russia (+6%); house price inflation strengthened further in the Czech Republic (+19%) (Graph 7).
Prices extended their slight decline in South Africa (-1.9%).
1 Real residential property prices refer to nominal residential property price indicators deflated by the consumer price index. Global figures are weighted aggregates of selected AEs (Australia, Canada, Denmark, the euro area, Iceland, Japan, New Zealand, Norway, Sweden, Switzerland, the United Kingdom and the United States) and EMEs (Brazil, Bulgaria, Chile, China, Colombia, Croatia, the Czech Republic, Hong Kong SAR, Hungary, India, Indonesia, Israel, Korea, Malaysia, Mexico, Morocco, North Macedonia, Peru, the Philippines, Poland, Romania, Russia, Singapore, South Africa, Thailand, Turkey and the United Arab Emirates), based on PPP exchange rates. Regional aggregates have been available since 2007.
2 The year-on-year consumer price index was higher in Q4 2021 than in Q3 in 95% of the economies covered in the BIS data set.
3 As regional aggregate developments are driven mainly by property price changes in major economies, they can mask country-level features presented in histogram.
4 This primarily reflected the impact of higher CPI inflation, since house prices also increased in nominal terms in India.
5 The 26% increase in consumer prices in Turkey only partly offset the surge observed in nominal house prices (+60%).