BIS residential property price statistics, Q3 2021

Key takeaways
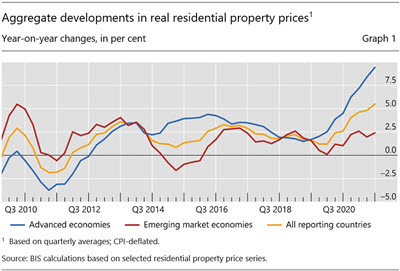
- Global house prices growth strengthened further in the third quarter of 2021, to 5.5% year on year in real terms, the highest rate observed since the eve of the Great Financial Crisis (GFC).1
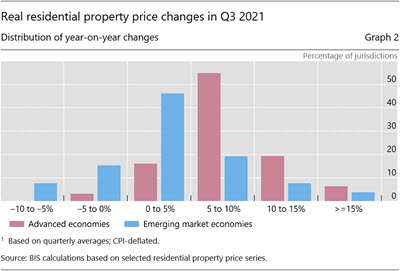
- House price developments diverged further between advanced economies (AEs, +9.4%) and emerging market economies (EMEs, +2.4 %).Strong price growth (ie above 5% year on year) was recorded in four out of five AEs, compared with only one third of EMEs.
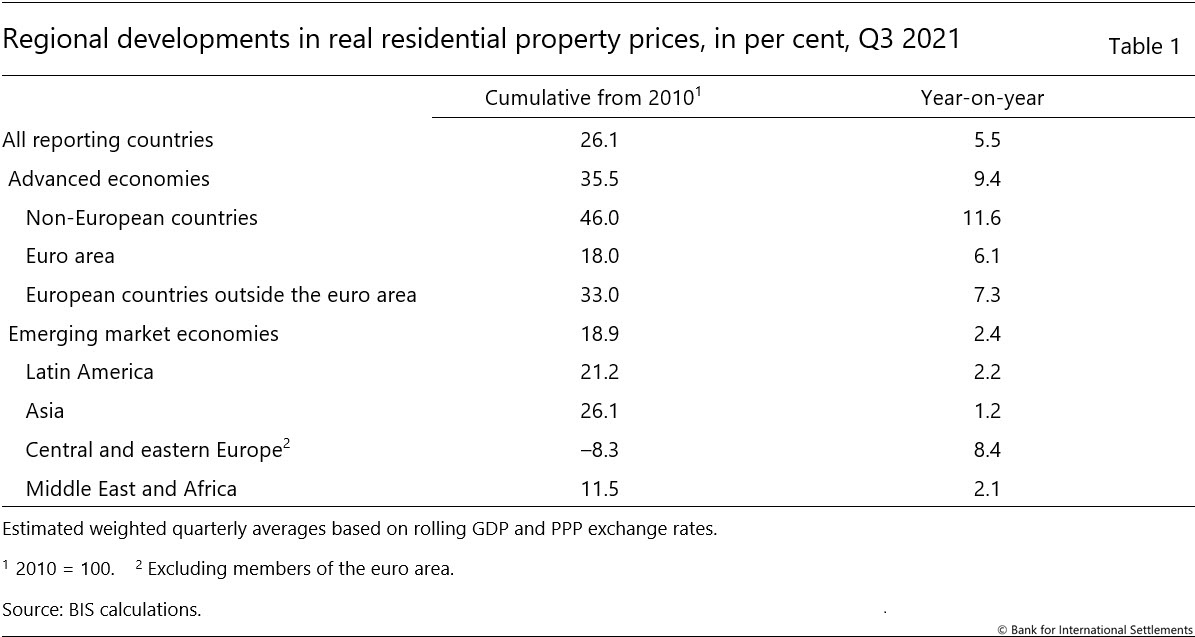
- In real terms, global house prices now exceed their immediate post-GFC average levels by 26%.
Summary of latest developments
Global real house prices rose by 5.5% year on year in aggregate in the third quarter of 2021, the fastest growth rate recorded since the eve of the 2007–09 Great Financial Crisis (GFC). Their growth was particularly strong in advanced economies (AEs), by 9.4% on average, up from 8.4% in Q2 and 4.5% a year earlier. It was markedly lower in emerging market economies (EMEs), by 2.4% on average, up from 2.0 % in Q2 and 1% a year earlier (Graph 1). There were, however, substantial differences across major EME regions: real house price growth reached 8.4% in central and eastern Europe, while it ranged between 1.2 and 2.2% in emerging Asia, Latin America and the Middle East and Africa region.
Country-level information shows that housing inflation was concentrated among AEs. Real residential property prices increased year on year in all but one of these countries in the third quarter of 2021, while they actually fell in one fourth of EME jurisdictions. Furthermore, strong price growth (ie above 5% year on year) was recorded in four out of five AEs, compared with only one third of the EMEs (Graph 2).2
In real terms, global house prices now exceed their immediate post-GFC average by 26.1% (35.5% and 18.9% for AEs and EMEs, respectively (Table 1)). Among the G20 economies, real prices have risen the most – by more than 50% since 2010 – in India, Canada, Germany and the United States. At the other end of the scale, they remain well below their post-GFC levels in Italy and Russia, by 22% and 38%, respectively (Graph 3).
Advanced economies
In aggregate for the group of AEs, real residential property prices grew further in Q3 2021, by 9.4% year on year from 8.4% in Q2.
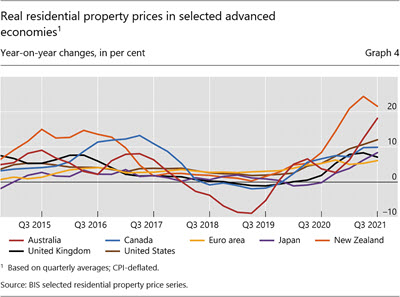
Prices rose with double-digit rates in New Zealand (+22%), Australia (+18%), the United States (+12%) and Canada (+10%). They increased less but still markedly in Japan (+8%) and the United Kingdom (+7%) (Graph 4).
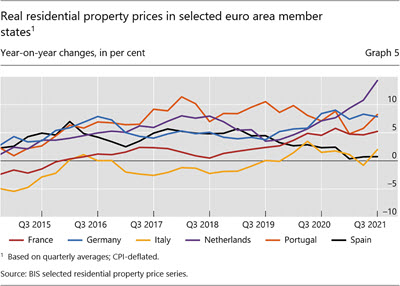
Prices were up by 6% in the euro area, where house price developments continued to vary significantly among member states. Real house price growth remained strong in the Netherlands (+14%), Germany and Portugal (+8% in both cases), and France (+5%), while prices remained broadly flat in Italy (+2%) and Spain (+1%) (Graph 5).
Emerging market economies
In contrast with AEs, real residential property prices rose more moderately in EMEs during the third quarter of 2021, by 2.4% year on year, compared with 2.0% the quarter before.
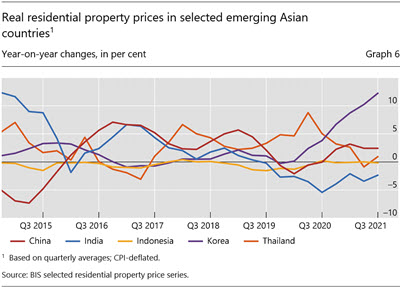
House price inflation remained subdued in emerging Asia (+1.2%), with significant variation across countries. Real prices surged in Korea (+12%) and rose moderately in China (+2%), but they remained stable in Indonesia and kept falling in India (–2%) (Graph 6).
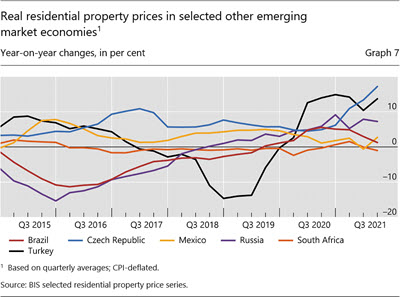
Real house price inflation was stronger in Latin America in aggregate (+2.2% year on year), driven by moderate price growth in Mexico (+3%) and Brazil (+1%).
Turning to central and eastern Europe, real prices expanded by an average of 8.4% year on year, led in particular by their continued strength in Turkey (+14%)3 and Russia (+7%); house price inflation surged further in the Czech Republic (+17%) (Graph 7).
1 Real residential property prices refer to nominal residential property price indicators deflated by the consumer price index. Global aggregates are weighted aggregates of selected AEs (Australia, Canada, Denmark, the euro area, Iceland, Japan, New Zealand, Norway, Sweden, Switzerland, the United Kingdom and the United States) and EMEs (Brazil, Bulgaria, Chile, China, Colombia, Croatia, the Czech Republic, Hong Kong SAR, Hungary, India, Indonesia, Israel, Korea, Malaysia, Mexico, Morocco, North Macedonia, Peru, the Philippines, Poland, Romania, Russia, Singapore, South Africa, Thailand, Turkey and the United Arab Emirates), based on PPP exchange rates.
These quarterly indicators are now released on a monthly basis, depending on country-level data availability. While the BIS statistical release continues to be produced five months after the end of a given quarter (ie end-May 2022 for Q4 2021 data), series are now made available for a subset of countries within three months (ie end-March 2022 for Q4 2021 data).
2 As regional aggregate developments are mainly driven by property price changes in major economies, they can mask country-level features presented in histogram.
3 The 19% increase in consumer prices in Turkey only partly offset the strong rise observed in nominal house prices (+36%).