BIS residential property price statistics, Q1 2021
Key takeaways
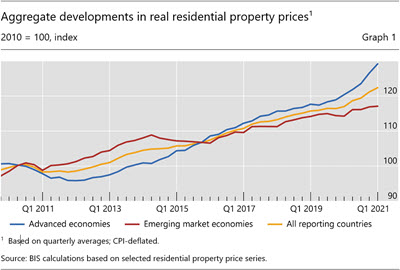
- Global shelter inflation strengthened further in the first quarter of 2021: worldwide real property prices increased by 4.6% year on year, up from 4.1% in the fourth quarter of 2020 and 1.1% a year before.1
- This rise was particularly marked in advanced economies, by 7.3% on average, especially in comparison with the 2.5% registered for emerging market economies.
- In real terms, global house prices now exceed their immediate post-Great Financial Crisis by 22.4% on average.
- The situation in those economies where sub-national data exist suggests that since the start of the Covid-19 pandemic house prices have increased less in major cities compared with other parts of the countries.
Summary of latest developments
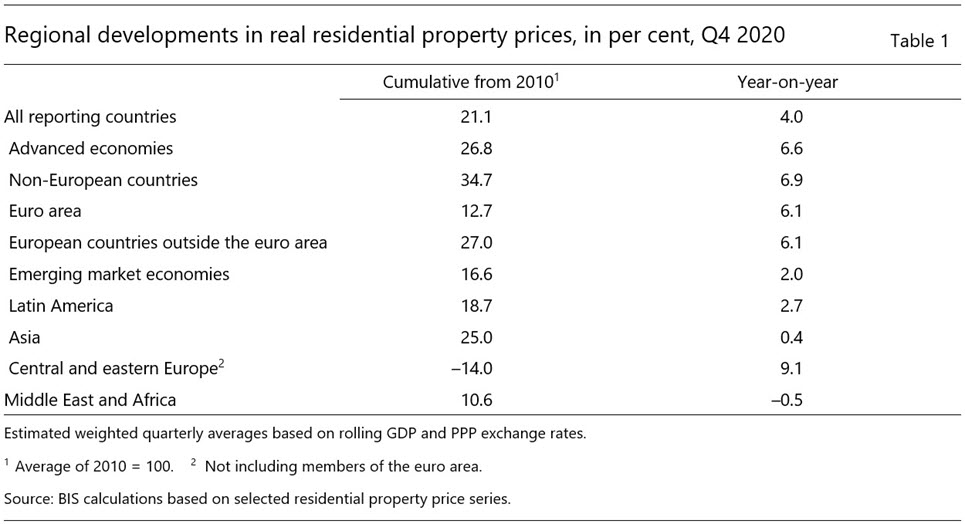
Global real house prices rose by 4.6% year on year in aggregate in the first quarter of 2021, representing the fastest growth rate recorded since the Great Financial Crisis (GFC) of 2007–09. This growth was particularly strong in advanced economies (AEs), 7.3% on average. Prices rose more moderately in emerging market economies (EMEs), by 2.5% on average – with notable differences across regions: they increased by 7.0% in central and eastern Europe, 3.0% in Latin America and 1.5% in emerging Asia, but remained flat in the Middle East and Africa (+0.8%).
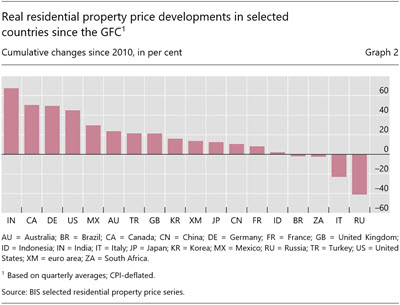
In real terms, global house prices now exceed their immediate post-GFC average by 22.4%, and by 29.2% and 17.1% for AEs and EMEs, respectively (Graph 1 and Table 1). Among the G20 economies, real prices have risen markedly – by more than 40% – over the past decade in India, Canada, Germany, and the United States. At the other end of the scale, they remain well below their post-GFC levels in Italy and Russia, by around 20% and 40%, respectively (Graph 2).
Advanced economies
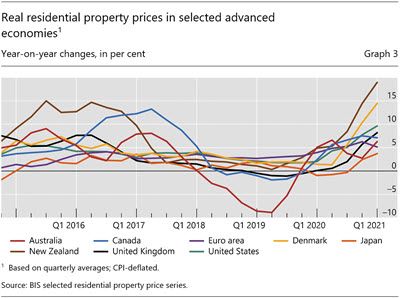
In aggregate for the group of AEs, real residential property prices soared by 7.3% year on year in Q1 2021, compared with 2.3% one year ago. This confirms the significant acceleration observed since the beginning of the Covid-19 pandemic (Graph 1, blue line). Prices grew rapidly in the United States (+10%), the United Kingdom (+8%), Canada (+7%) and Australia (+6%) and less so in Japan (+4%) (Graph 3). Double-digit house price growth was recorded in New Zealand (+19%) and Denmark (+14%).
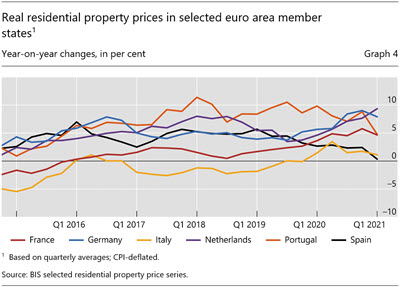
In the euro area, real year-on-year house price inflation was slightly more subdued (+5%), with significant variations among the member states. House prices remained strong in the Netherlands (+9%), Germany (+8%) and France (+5%). But they flattened further in Italy (+1%) and Spain (+0%) (Graph 4).
Emerging market economies
In contrast with AEs, real residential property prices have been growing moderately since the beginning of the pandemic. They rose by 2.5% year on year in the first quarter of 2021, compared with 0.1% one year before.
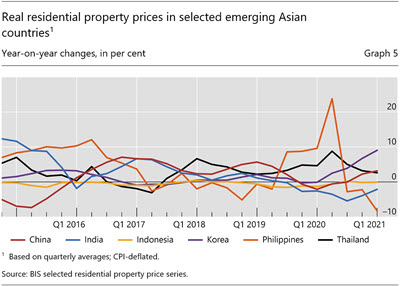
House price inflation remained moderate in emerging Asia (+1.5%), with significant heterogeneity across countries. Prices accelerated in Korea (+9%) and China (+3%), while they remained stable in Indonesia and kept falling in India (–2%) and the Philippines (-8%) (Graph 5).
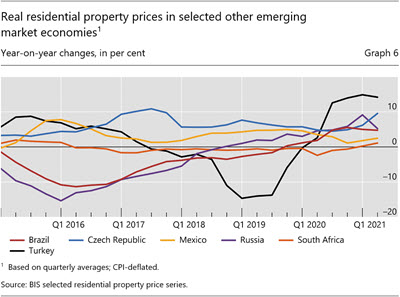
Real house inflation was slightly stronger in Latin America in aggregate (+3.0% year on year), with strong price growth recorded in Brazil (+5%).
Turning to central and eastern Europe, real prices expanded by an average of 7% year on year, led in particular by their surge in Turkey (+14%). House price inflation remained strong in the Czech Republic (+10%) and Russia (+5%) (Graph 6).
1 Real residential property prices refer to nominal residential property price indicators deflated by the consumer price index. Global aggregates are weighted aggregates of selected AEs (Australia, Canada, Denmark, the euro area, Iceland, Japan, New Zealand, Norway, Sweden, Switzerland, the United Kingdom and the United States) and EMEs (Brazil, Bulgaria, Chile, China, Colombia, Croatia, the Czech Republic, Hong Kong SAR, Hungary, India, Indonesia, Israel, Korea, Malaysia, Mexico, Morocco, North Macedonia, Peru, the Philippines, Poland, Romania, Russia, Singapore, South Africa, Thailand, Turkey and the United Arab Emirates), based on PPP exchange rates.