BIS residential property price statistics, Q3 2020
Summary of latest developments
-
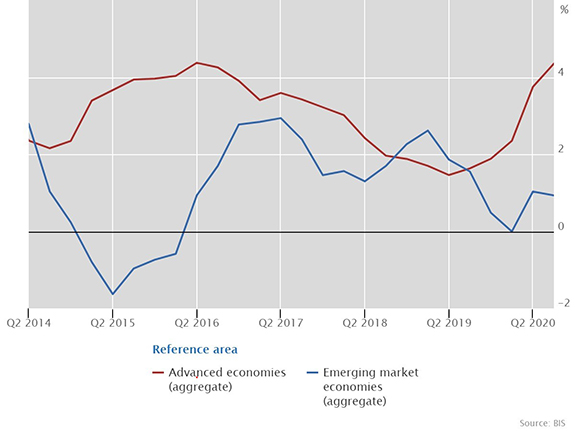
Global real house price inflation accelerated to 2.5% year on year (yoy) in the third quarter of 2020, a period marked by the continued impact of the Covid-19 pandemic and significant fiscal and monetary stimulus. This was primarily due to a significant and relatively widespread expansion in real residential property prices1 in advanced economies (AEs), by 4.4% on average, the fastest yoy growth rate observed since 2016. In contrast, real price growth remained subdued (+0.9% yoy) in emerging market economies (EMEs) (Graph 1), with significant differences between central and eastern Europe (+7%), Latin America (+1%), emerging Asia (0%) and the Middle East and Africa (–2%).
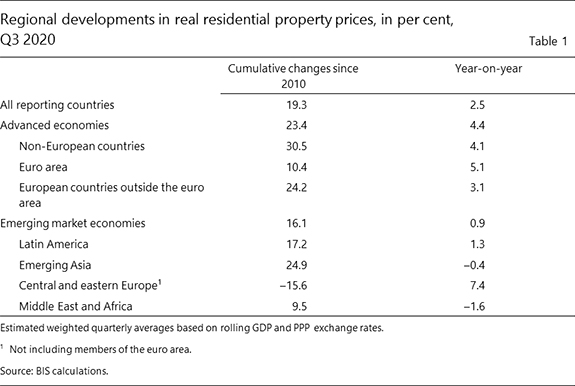
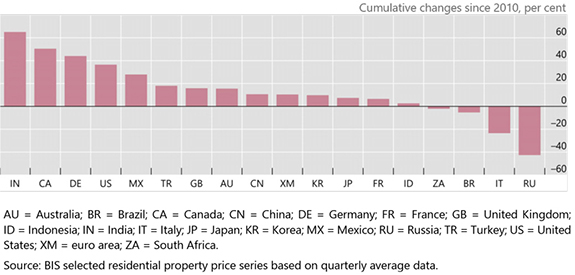
- In real terms, global house prices now exceed by 19% the average level recorded immediately after the Great Financial Crisis (GFC) of 2007–09 – and by 23% and 16% for AEs and EMEs, respectively (Table 1). Among G20 economies, real prices have soared over the past decade in India and, though to a lesser extent, in Canada, Germany, Mexico and the United States. At the other end of the scale, they have remained well below their post-GFC levels in Italy and Russia (Graph 2).
Aggregate developments in real residential property prices
Source: BIS selected residential property price series based on quarterly average data.
Real residential property price developments in selected countries since the GFC
Advanced economies
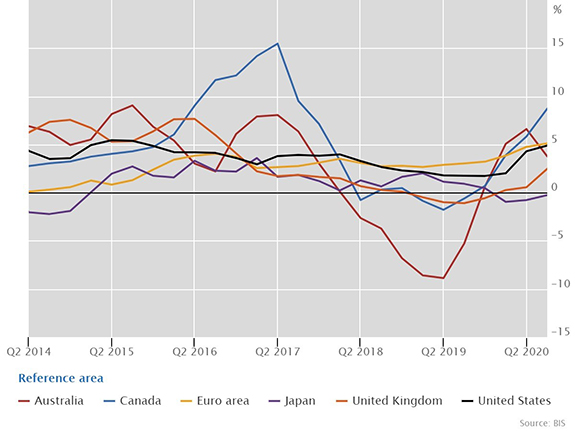
Real residential property prices in advanced economies
Source: BIS selected residential property price series based on quarterly average data.
Real residential property prices in euro area member states
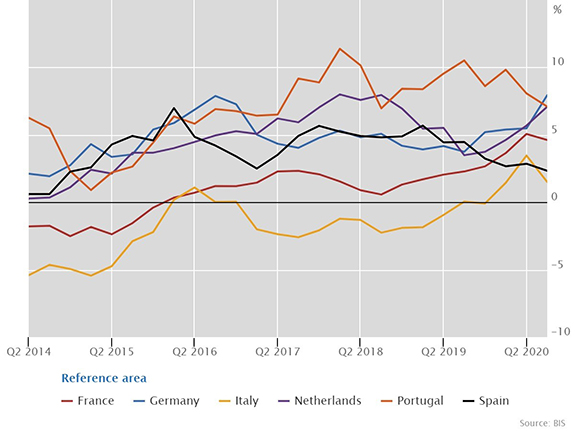
Source: BIS selected residential property price series based on quarterly average data.
In aggregate for the group of AEs, real residential property prices appear to have accelerated since the start of the Covid-19 pandemic in early 2020.2 Their yoy growth rate went up further, to 4.4%, in the third quarter of 2020, compared with less than 2% one year before. Real prices increased markedly in Canada (9%), the euro area, and the United States (both 5%). They grew more moderately in Australia (+4%) and the United Kingdom(+2%) and remained stable in Japan. In the euro area, real house price inflation reached its highest rate since 2005, driven by strong growth in several large members (by 8% in Germany, 7% in the Netherlands and Portugal, and 5% in France); they rose more moderately (+2%) in Italy and Spain.
Emerging market economies
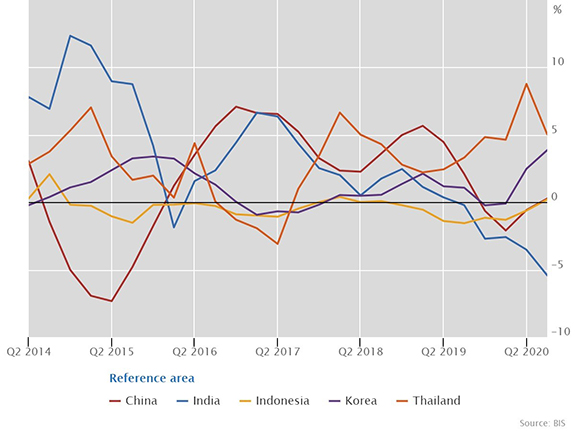
Real residential property prices in emerging Asia
Source: BIS selected residential property price series based on quarterly average data.
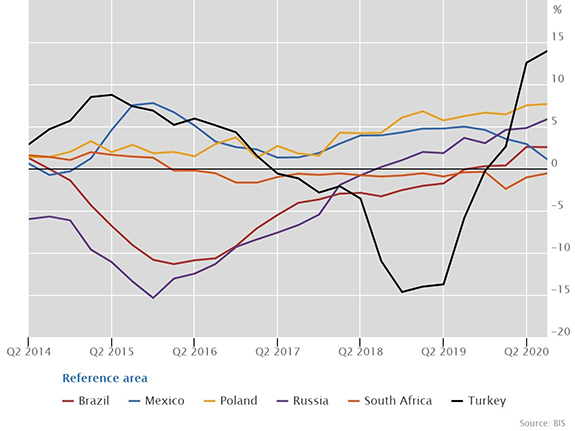
Real residential property prices in other emerging market economies
Source: BIS selected residential property price series based on quarterly average data.
Real residential property prices grew only marginally yoy in EMEs (+0.9%) in the third quarter of 2020. They fell slightly in emerging Asia (–0.4%), driven by a substantial drop in India (–5%).3 Prices remained stable in China and Indonesia and kept rising in Thailand (+5%) and Korea (+4%) (Graph 5).
Real prices were up in Latin America in aggregate (+1.3%), driven by 3% yoy growth in Brazil. Turning to central and eastern Europe, they rose by an average of 7.4% yoy, led in particular by a 14% price surge in Turkey and steady growth in Russia (6%) (Graph 6). The recent price growth in Turkey contrasted markedly with the period of declining prices observed in 2017–19.
1 Real residential property prices refer to nominal residential property price indicators deflated by the consumer price index. Global aggregates are weighted aggregates of selected AEs (Australia, Canada, Denmark, the euro area, Iceland, Japan, New Zealand, Norway, Sweden, Switzerland, the United Kingdom and the United States) and EMEs (Brazil, Bulgaria, Chile, China, Colombia, Croatia, the Czech Republic, Hong Kong SAR, Hungary, India, Indonesia, Israel, Korea, Malaysia, Mexico, Morocco, North Macedonia, Peru, the Philippines, Poland, Romania, Russia, Singapore, South Africa, Thailand, Turkey and the United Arab Emirates), based on PPP exchange rates.
2 Property market developments during the pandemic should be interpreted with caution. Anecdotal evidence suggests that conditions changed markedly, possibly reflecting the impact of lockdowns and social distancing measures on household spending decisions. Yet data on the number of transactions are scarce and difficult to compare across countries. For instance, house sales transactions fell in most of the 13 countries covered by Eurostat during the third quarter of 2020 compared with one year earlier (though less markedly than in the second quarter). In contrast, the number of US new single-family houses sold increased significantly in the same period.
3 The marked real price fall reflects the impact of higher inflation, as nominal house prices increased moderately.