BIS residential property price statistics, Q2 2020
Summary of latest developments
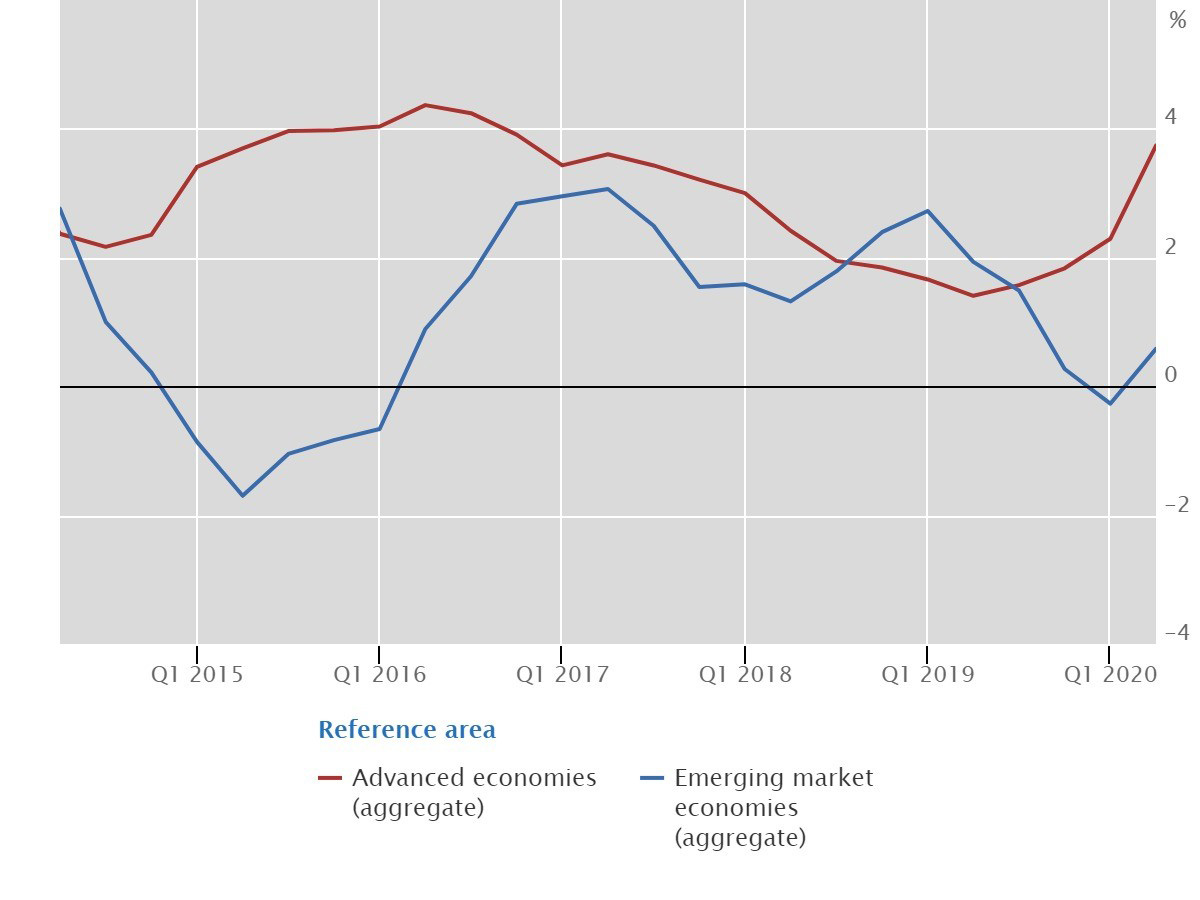
- Global real house price inflation accelerated to 1.9% year on year in the second quarter of 2020, a period marked by Covid-19 containment measures and the launch of significant fiscal and monetary stimulus packages. Real residential property prices1 increased by 3.7% on average in advanced economies (AEs), the fastest year-on-year growth rate since the end of 2016. Real prices rose moderately, by 0.6% year on year, in emerging market economies (EMEs) (Graph 1). Within the G20 economies, Turkey recorded a double-digit growth rate (+13%). Real prices also increased strongly (by 5% or more) in Australia, Canada, the euro area and Russia, but fell in India and South Africa.
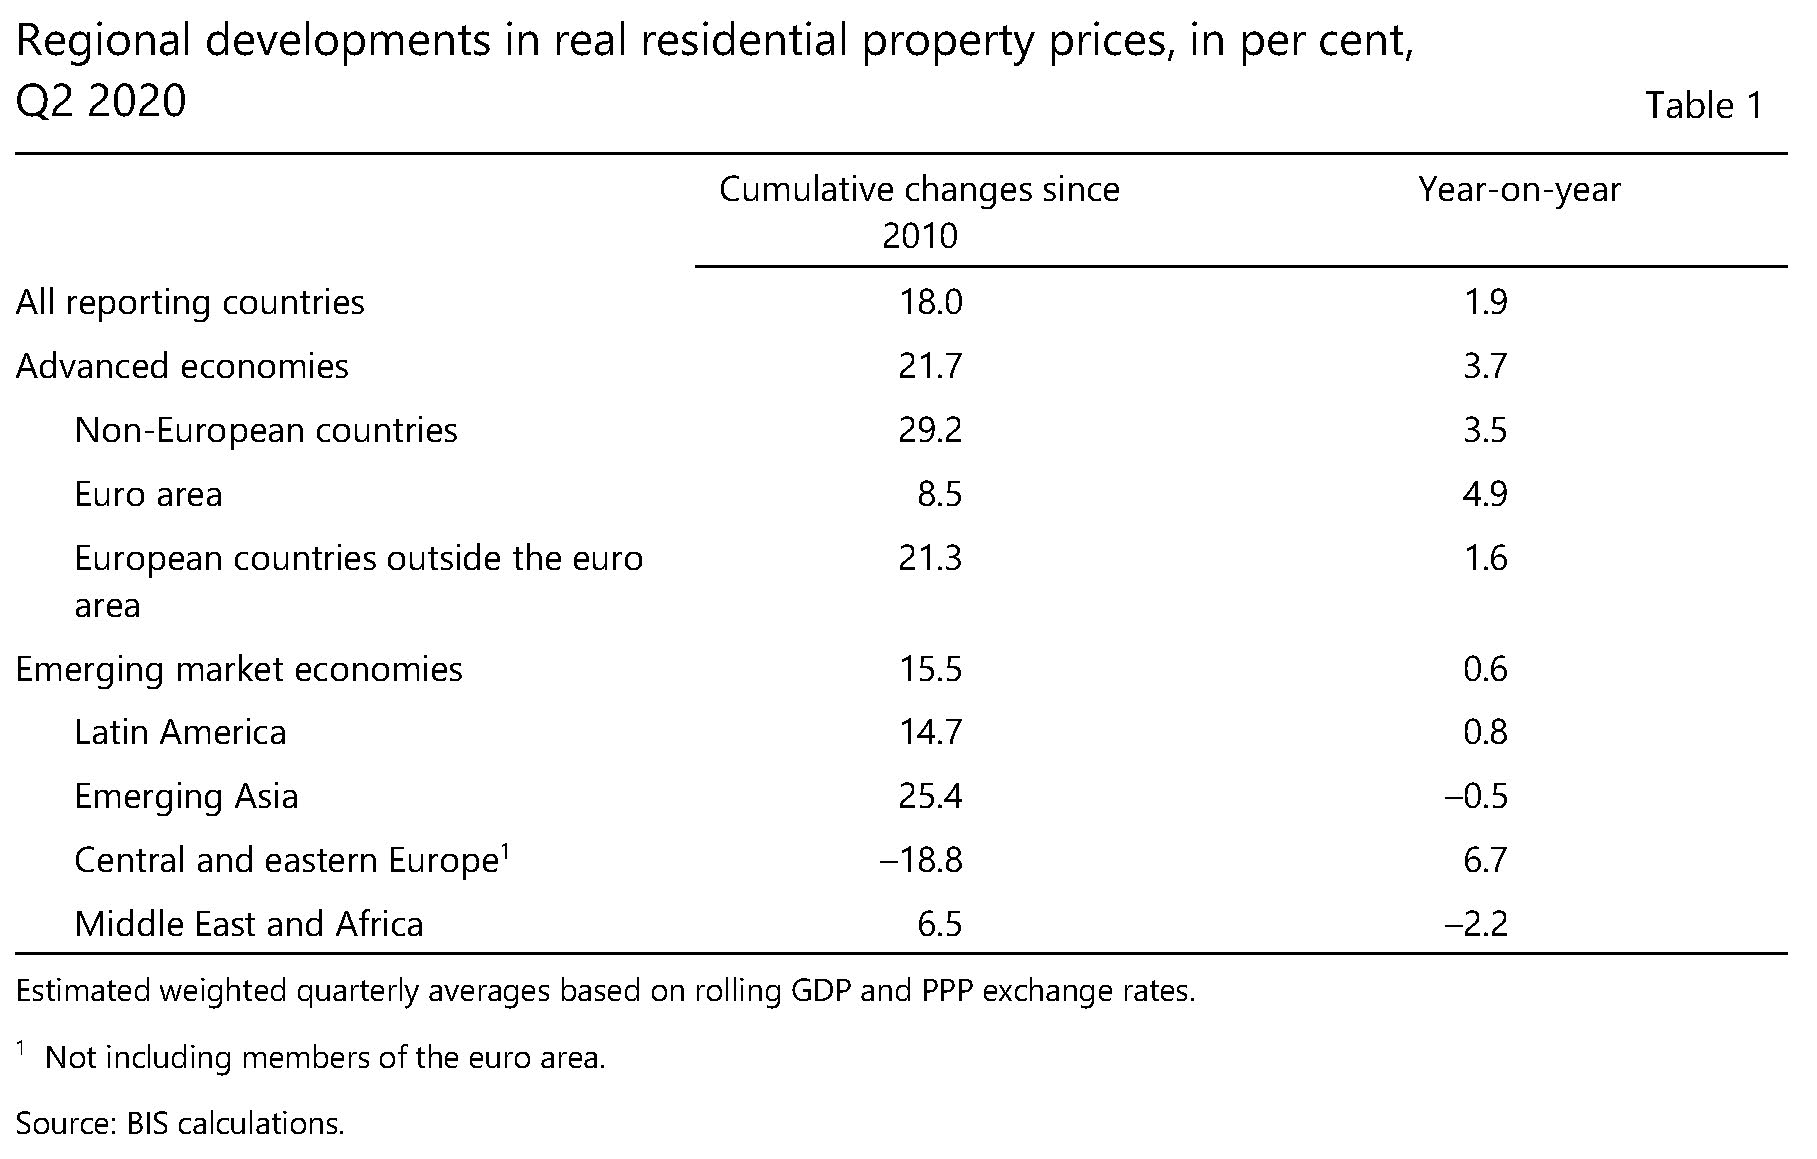
- Global house prices stood 18% above their average level in real terms, as recorded immediately after the 2007-09 Great Financial Crisis (GFC) - compared with 22% and 16% for AEs and EMEs, respectively (Table 1). Among the G20 economies, prices have soared in India and, although to a lesser extent, in Canada, Germany, the United States and Mexico since 2010. At the other end of the scale, they have remained well below their post-GFC levels in Russia and Italy (Graph 2).
Aggregate developments in real residential property prices
Source: BIS selected residential property price series based on quarterly average data.
Real residential property price developments in selected countries since the GFC
Advanced economies
Real residential property prices in advanced economies
Source: BIS selected residential property price series based on quarterly average data.
Real residential property prices in euro area member states
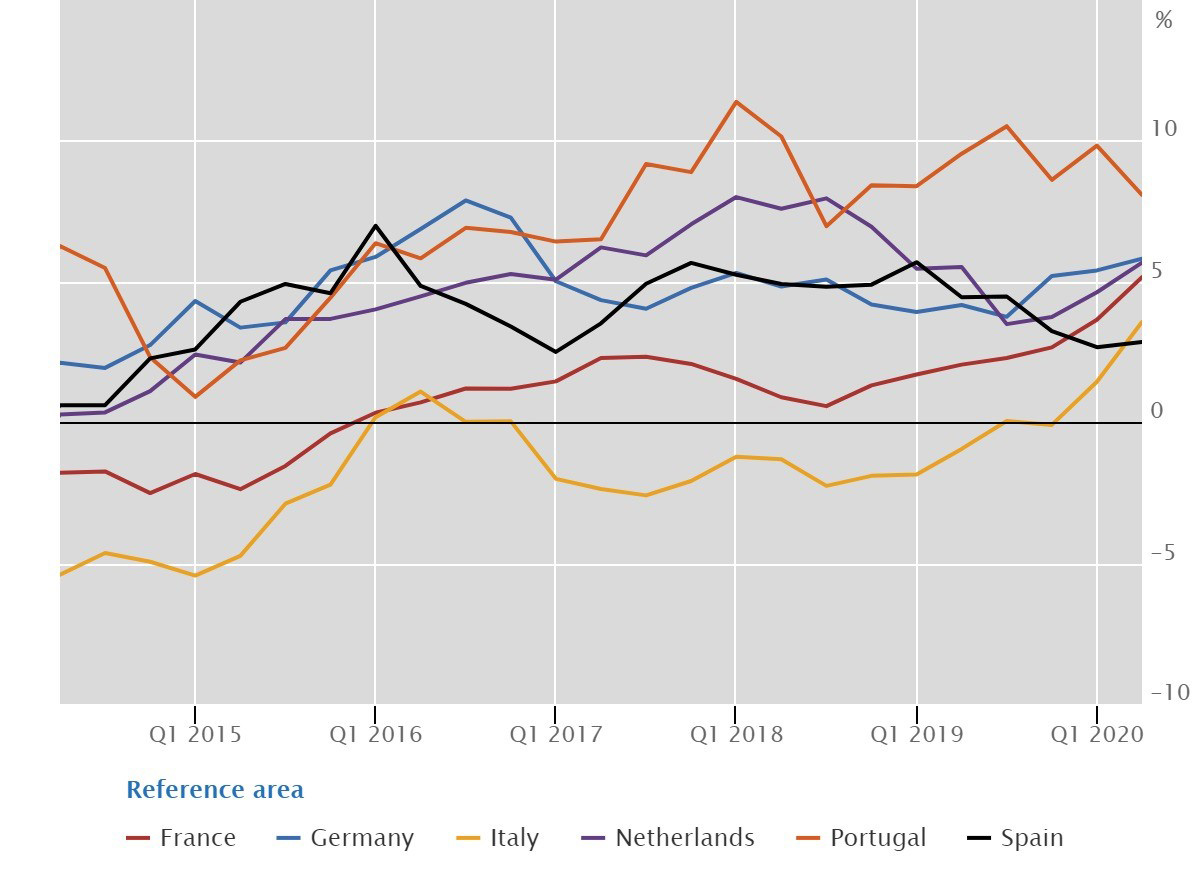
Source: BIS selected residential property price series based on quarterly average data.
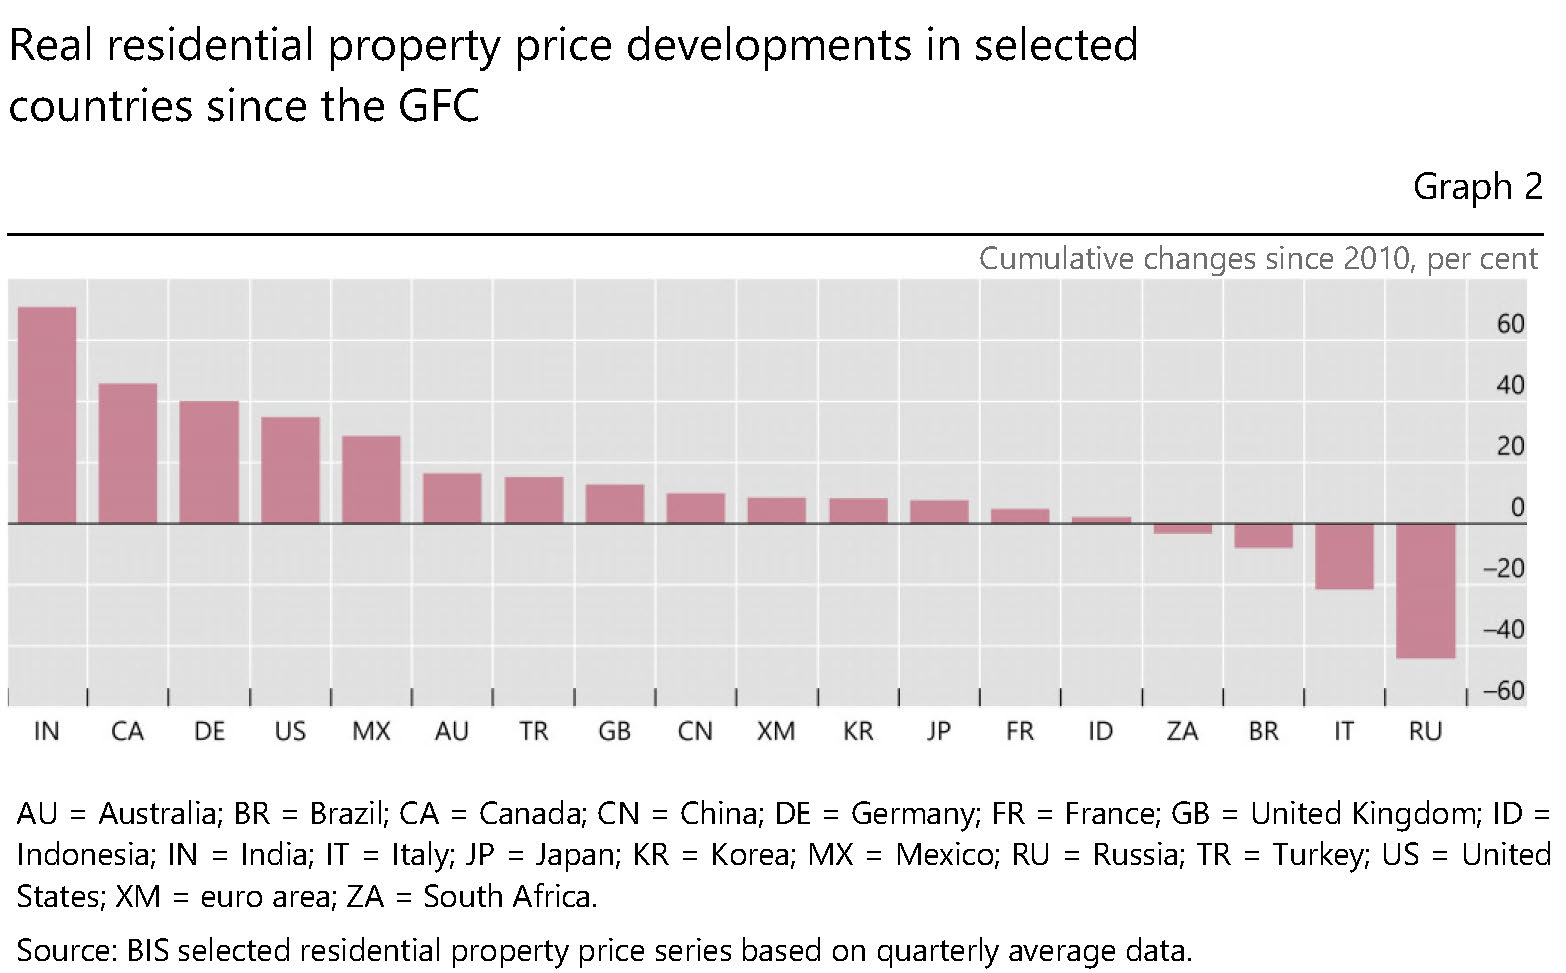
In aggregate for the group of AEs, the year-on-year growth rate of real residential property prices picked up to 3.7% in the second quarter of 2020, against the backdrop of the Covid-19 pandemic.2 Real prices increased markedly in Australia (7%), Canada (6%), the euro area (5%), and the United States (4%). They remained broadly stable in the United Kingdom (+1%) and Japan (-1%). In the euro area, real house price inflation reached its highest rate in 15 years, driven by strong growth in the largest members: 6% in Germany and the Netherlands, 5% in France, 4% in Italy and 3% in Spain. Real prices continued to trend upwards rapidly in Portugal (+8%).
Emerging market economies
Real residential property prices in emerging Asia
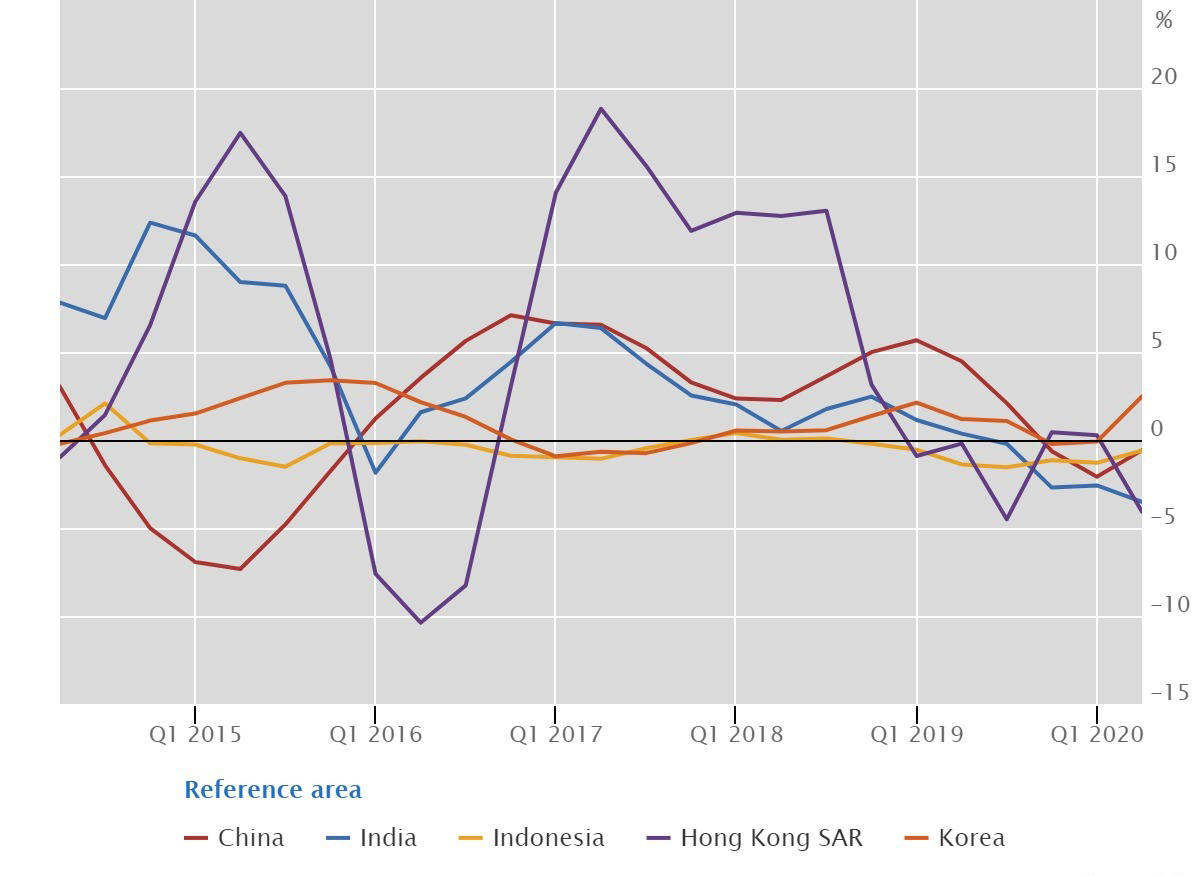
Source: BIS selected residential property price series based on quarterly average data.
Real residential property prices in other emerging market economies
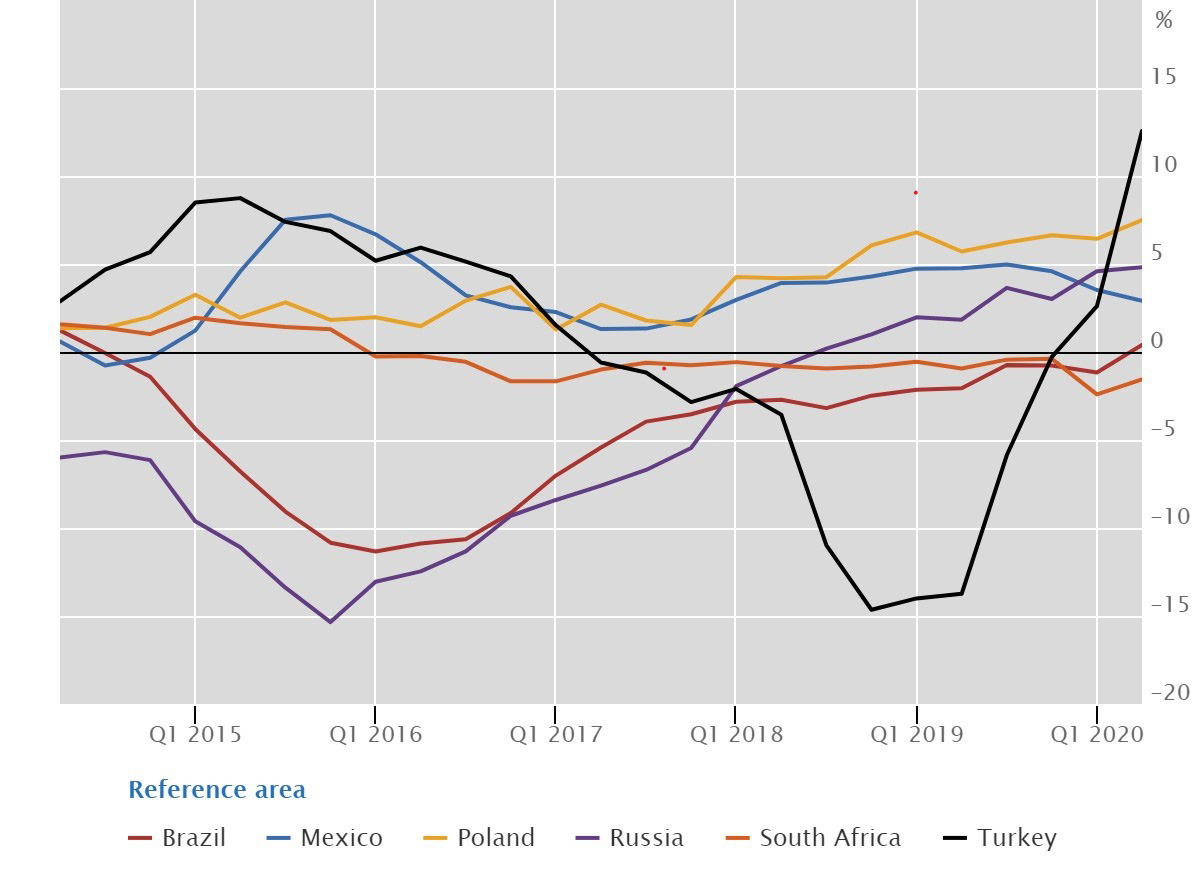
Source: BIS selected residential property price series based on quarterly average data.
Real residential property prices grew moderately from one year earlier in EMEs (+0.6%) in the second quarter of 2020. They fell slightly in emerging Asia (-0.5%), driven by a substantial drop in India (-4%)3 as well as in China and Indonesia to a lesser extent (-1% in both cases), but rose by 2% in Korea (Graph 5).
Real prices were up in Latin America in aggregate (+0.8%), driven by continued positive growth in Mexico (3%), but remained unchanged in Brazil. Turning to central and eastern Europe, aggregate real prices rose by an average of 6.7% year on year, led in particular by a significant acceleration in Turkey (13%, compared with 3% in Q1 2020) and steady growth in Russia (5%) (Graph 6). The recent surge in Turkey contrasted markedly with the period of declining prices in 2017-19.
1 Real residential property prices refer to nominal residential property price indicators deflated by the Consumer Price Index. Global aggregates are weighted aggregates of selected advanced economies (Australia, Canada, Denmark, the euro area, Iceland, Japan, New Zealand, Norway, Sweden, Switzerland, the United Kingdom and the United States) and emerging market economies (Brazil, Bulgaria, Chile, China, Colombia, Croatia, the Czech Republic, Hong Kong SAR, Hungary, India, Indonesia, Israel, Korea, Malaysia, Mexico, Morocco, North Macedonia, Peru, the Philippines, Poland, Romania, Russia, Singapore, South Africa, Thailand, Turkey and the United Arab Emirates), based on PPP exchange rates.
2 Developments seen during the pandemic should be interpreted with caution. Anecdotal evidence suggests that conditions in property markets changed markedly, possibly reflecting the impact of lockdowns and social distancing measures on household spending decisions. Yet data are scarce and difficult to compare across countries. According to Eurostat, covering 11 EU countries plus Norway and the United Kingdom, house sales transactions fell by between 15 and 50% in most countries during the second quarter of 2020 compared with one year earlier, but there were notable exceptions (one country saw a 20% increase in transactions). In the United States, the number of new single-family houses sold increased moderately in the same period.
3 The marked real price fall reflected the impact of higher inflation as nominal house prices kept increasing.