BIS residential property price statistics, Q1 2020
Summary of latest developments
- Global real house price inflation was continuing to slow even before the outbreak of the Covid-19 pandemic, with prices rising by just 0.7% year on year in the first quarter of 2020. Year-on-year growth in real residential property prices1 accelerated to 2.0% in the advanced economies (AEs), while prices stagnated (-0.2%) in the emerging market economies (EMEs). Within the G20 economies, Australia, Germany, Russia, France and Mexico saw the strongest annual real house price inflation (around 4-5% in each country) in Q1 2020, while real prices continued to fall in China and India.
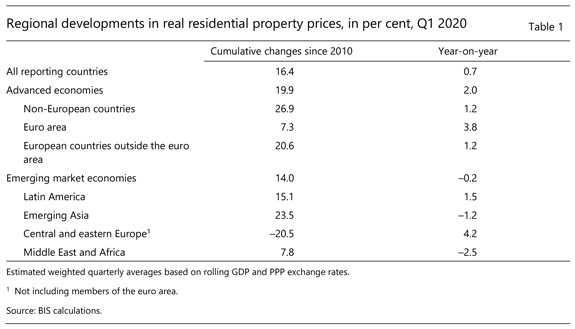
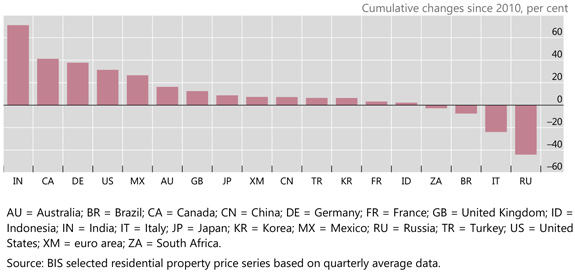
- Global real house prices were 16% above their levels immediately after the Great Financial Crisis in real terms (Graph 1) - by 20% in AEs and 14% in EMEs. The increase since 2010 has been particularly pronounced in non-European advanced economies and emerging Asia. In contrast, real prices are still significantly below their post-crisis levels in central and eastern Europe (Table 1). Among the G20 economies, prices have surged the most in India and, to a lesser extent, in Canada, Germany, the United States and Mexico. At the other end of the scale, they have remained largely below their 2010 level in Russia and Italy (Graph 2).
-
Aggregate developments in real residential property prices
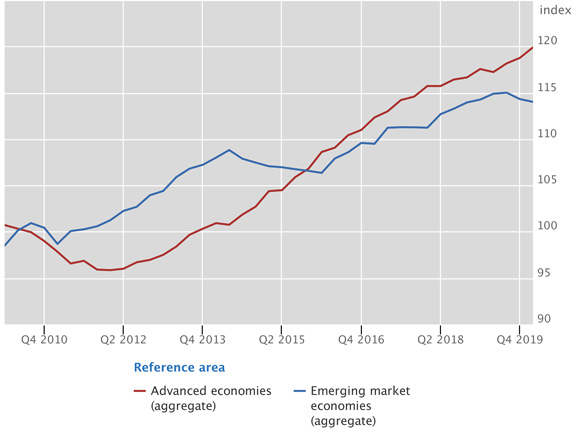
Graph 1: 2010=100
Source: BIS residential property price statistics.
Real residential property price developments in selected countries since the GFC
Advanced economies
Real residential property prices in advanced economies
Graph 3: Year-on-year changes
Source: BIS selected residential property price series based on quarterly average data.
Real residential property prices in euro area member states
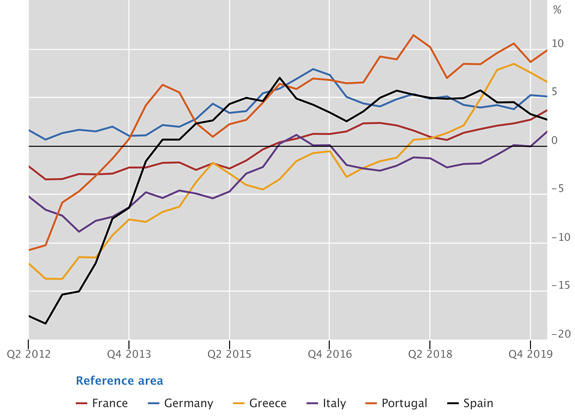
Graph 4: Year-on-year changes
Source: BIS selected residential property price series based on quarterly average data.
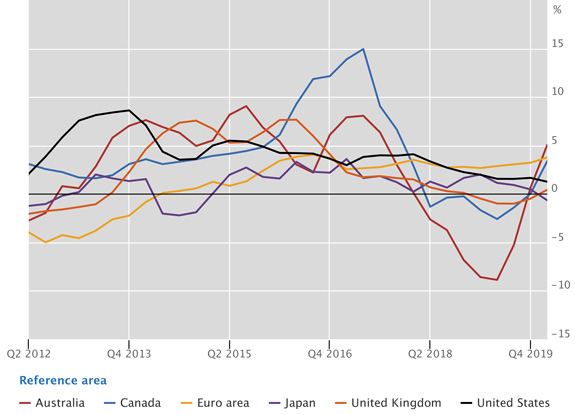
In aggregate for the group of AEs, the year-on-year growth rate of real residential property prices picked up to 2% in the first quarter of 2020, even though the Covid-19 pandemic reached most countries in the final weeks of the quarter. Real prices rose markedly in Australia (5%), the euro area (4%), and Canada (3%). They remained broadly stable in Japan (-1%), the United Kingdom (0%) and the United States (+1%). Within the euro area, real house prices surged in Portugal and Greece (10% and 7%, respectively), and also increased noticeably in Germany (+5%), France (+4%) and Spain (+3%); but they remained almost flat in Italy (+1%) (Graph 4).
Emerging market economies
Real residential property prices in emerging Asia
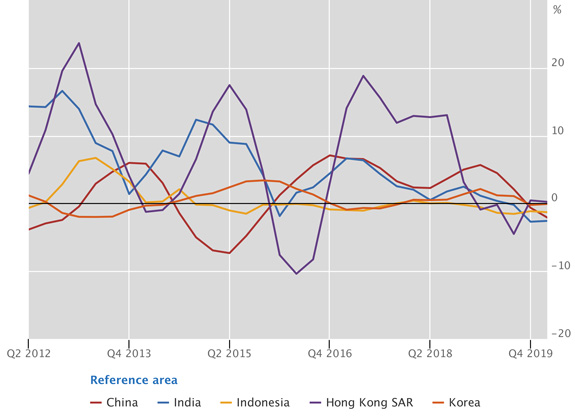
Graph 5: Year-on-year changes
Source: BIS selected residential property price series based on quarterly average data.
Real residential property prices in other emerging market economies
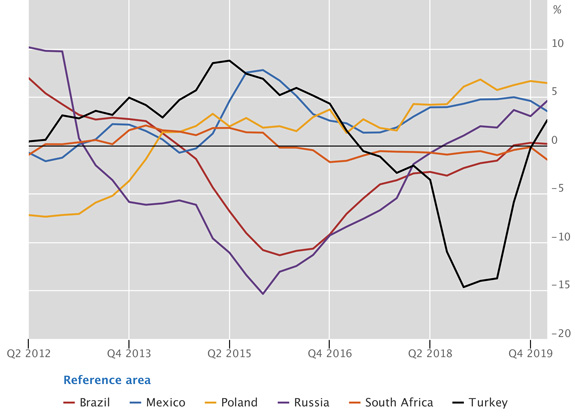
Graph 6: Year-on-year changes
Source: BIS selected residential property price series based on quarterly average data.
Real residential property prices remained unchanged from one year earlier in EMEs (-0.2%) in the first quarter of 2020. They were down in emerging Asia (-1.4%), driven by a fall of 3% in India and 2% in China.2 Among the other Asian economies, real prices were flat in Korea and continued to decline in Indonesia from one year earlier (-1%). (Graph 5).
Real prices were up in Latin America in aggregate (+1.5%), driven by a marked increase of 4% in Mexico; they remained unchanged in Brazil.
Turning to central and eastern Europe, aggregate real prices rose by an average of 4.2% year on year, led by growth of 5-6% in Russia and various medium-sized economies such as the Czech Republic, Poland and Romania. In Turkey, prices rose for the first time after an extended period of decline (Graph 6).
1 Real residential property prices refer to nominal residential property price indicators deflated by the Consumer Price Index. Global aggregates are weighted aggregates of selected advanced economies (Australia, Canada, Denmark, the euro area, Iceland, Japan, New Zealand, Norway, Sweden, Switzerland, the United Kingdom and the United States) and emerging market economies (Brazil, Bulgaria, Chile, China, Colombia, Croatia, the Czech Republic, Hong Kong SAR, Hungary, India, Indonesia, Israel, Korea, Malaysia, Mexico, Morocco, North Macedonia, Peru, Philippines, Poland, Romania, Russia, Singapore, South Africa, Thailand, Turkey and the United Arab Emirates), based on PPP exchange rates.
2 The real price fall was attributable to accelerating inflation in both countries as nominal house prices kept increasing.