BIS residential property price statistics, Q4 2019
1. Summary of latest developments
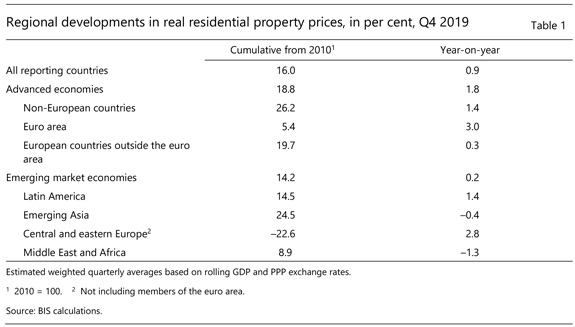
- Global house price inflation had already lost significant momentum before the Covid-19 pandemic broke out. Year-on-year growth in real residential property prices1 for major advanced economies (AEs) and emerging market economies (EMEs) slowed down to 0.9% in aggregate during the last quarter of 2019, the lowest rate since 2015. Real prices all but stagnated in EMEs, rising by a mere 0.2% year on year. In AEs, they continued to rise at a moderate pace (+1.8%), which was significantly below the rates seen in 2014-18. Within the G20 economies, Germany, Mexico, Russia and France saw the strongest annual real house price inflation in Q4 2019, while only India recorded a marked decline.
Aggregate developments in real residential property prices
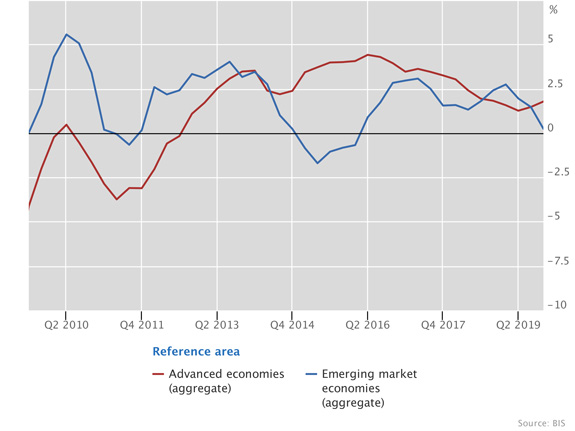
Graph 1: Year-on-year changes (interactive graph).
Source: BIS residential property price statistics.
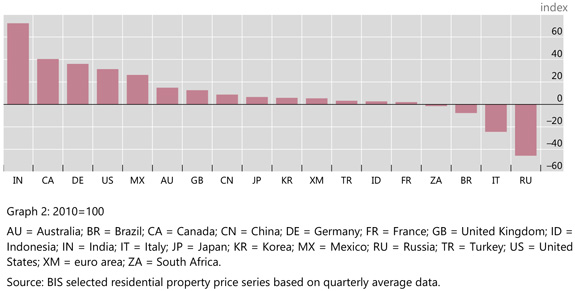
- Despite their recent slowdown, global house prices have reached historically high levels since the aftermath of the 2007-09 Great Financial Crisis (GFC). In Q4 2019, they were fully 16% above their immediate post-GFC levels (19% in AEs and 14% in EMEs) in real terms. This increase has been particularly pronounced in non-European advanced economies and emerging Asia. In contrast, real prices are still largely below their post-crisis levels in central and eastern Europe. Among the G20 economies, prices have surged the most in India and, to a lesser extent, in Canada, Germany, the United States and Mexico. At the other end of the scale, they have declined markedly since 2010 in Russia and Italy.
Real residential property price developments in selected countries since the GFC
2. Advanced economies
Real residential property prices in advanced economies
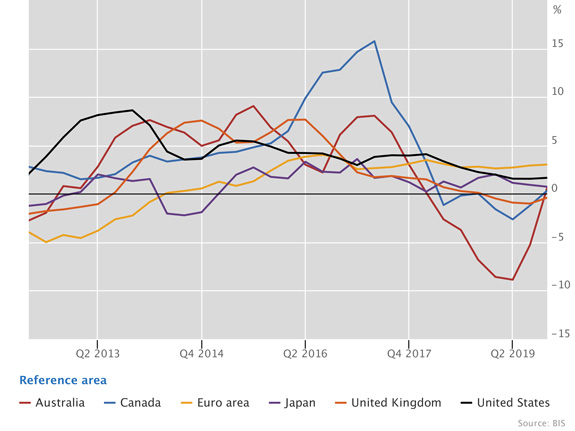
Graph 3: Year-on-year changes (interactive graph)
Source: BIS selected residential property price series based on quarterly average data.
Real residential property prices in euro area member states

Graph 4: Year-on-year changes (interactive graph)
Source: BIS selected residential property price series based on quarterly average data.
In aggregate for the group of AEs, the year-on-year growth rate of real residential property prices strengthened to 1.8% in the last quarter of 2019. Real prices rose the most in the euro area (3%), followed by the United States (2%) and Japan (1%). Prices rose also in Australia, for the first time after two years of significant declines, and they remained stable in Canada and in the United Kingdom.
Within the euro area, house price inflation was significant in Portugal and Greece (9% and 7%, respectively), and relatively strong in Germany, France and Spain (around 3-4%). Prices remained flat in Italy (Graph 4).
3. Emerging market economies
Real residential property prices in emerging Asia
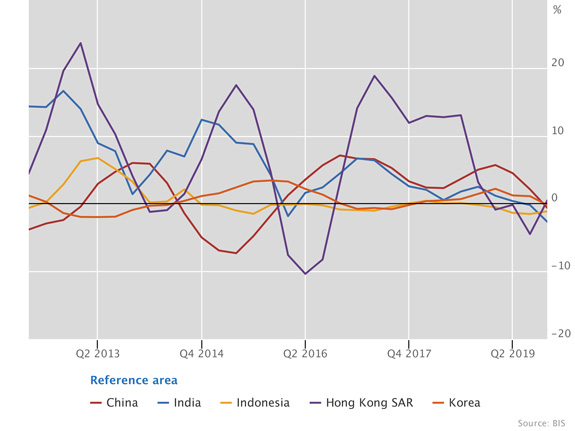
Graph 5: Year-on-year changes (interactive graph)
Source: BIS selected residential property price series based on quarterly average data.
Real residential property prices in other emerging market economies
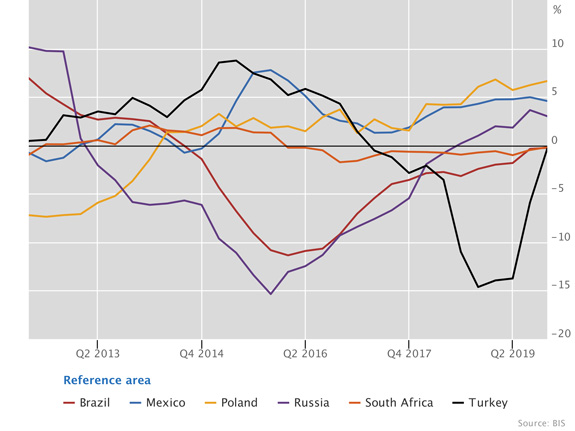
Graph 6: Year-on-year changes (interactive graph)
Source: BIS selected residential property price series based on quarterly average data.
Real residential property prices growth slowed in EMEs, from 1.4% in Q3 2019 to 0.2% year on year in the last quarter of 2019. This was driven by developments in emerging Asia (-0.4%), where real prices fell by 3% in India and by 1% in China2. Among the other Asian economies, prices were flat in Korea and continued to fall in Indonesia. (Graph 5).
Real prices were up in Latin America in aggregate (+1.4%), driven by a marked increase of 5% in Mexico; they remained unchanged in Brazil.
Turning to central and eastern Europe, aggregate real prices rose by 2.8% on average, led by the recovery in Russia (+3%) and strong growth (5-7%) in medium-sized economies such as the Czech Republic, Hungary and Poland. In Turkey, prices stabilised after falling almost 20% between mid-2016 and 2019. (Graph 6).
1 Real residential property prices refer to nominal residential property price indicators deflated by the Consumer Price Index. Global aggregates are weighted aggregates of selected advanced economies (Australia, Canada, Denmark, the euro area, Iceland, Japan, New Zealand, Norway, Sweden, Switzerland, the United Kingdom and the United States) and emerging market economies (Brazil, Bulgaria, Chile, China, Colombia, Croatia, the Czech Republic, Hong Kong SAR, Hungary, India, Indonesia, Israel, Korea, Malaysia, Mexico, Morocco, North Macedonia, Peru, Philippines, Poland, Romania, Russia, Singapore, South Africa, Thailand, Turkey and the United Arab Emirates), based on PPP exchange rates.
2 The real price fall was attributable to accelerating inflation in both countries as nominal house prices kept increasing.