BIS global liquidity indicators at end-June 2019
- US dollar credit to non-bank borrowers outside the United States grew by 4% year on year at end-June 2019, to reach $11.9 trillion.
- Foreign currency credit denominated in euros and Japanese yen continued to expand at a faster pace than that in US dollars, growing at annual rates of 9% and 8%, respectively.
- US dollar credit to emerging market and developing economies (EMDEs) grew at an annual rate of 2% (to reach $3.7 trillion), though growth varied substantially across regions.
Foreign currency euro and yen credit continued to expand rapidly
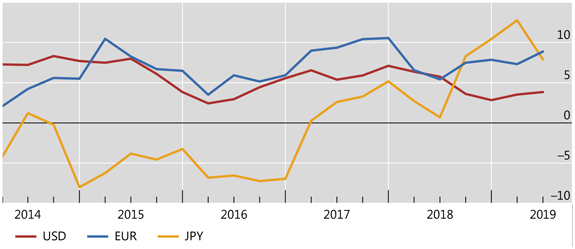
Graph 1: Annual growth of foreign currency-denominated credit to non-resident non-banks (interactive graph), in per cent.
Source: BIS global liquidity indicators (Table E2.1, E2.2 and E2.3).
US dollar credit to non-bank borrowers outside the United States grew by 4% year on year (Graph 1, red line) to reach $11.9 trillion at end-June 2019. This represents a slight acceleration relative to the 3% annual growth rate observed at end-2018.
The growth rates of the two main components of foreign currency US dollar credit, bank loans and debt securities, continued to move in opposite directions. For most of the post-Great Financial Crisis period, growth in US dollar-denominated debt securities was higher than that of bank loans. However, recently the trend has reversed: the annual growth rate of US dollar bank loans outpaced that of securities for a second quarter in a row (5% for loans versus 3% for debt securities at end June-2019).
Euro-denominated credit to borrowers outside the euro area grew by 9% year on year (Graph 1, blue line), pushing the outstanding stock to €3.4 trillion (equivalent to $3.8 trillion) at end-June 2019. Meanwhile, the annual growth rate of yen-denominated credit outside Japan fell slightly, but remained relatively high at 8% (yellow line). This took the outstanding stock to ¥49.4 trillion (equivalent to $0.5 trillion).
US dollar credit to EMDEs diverged across regions
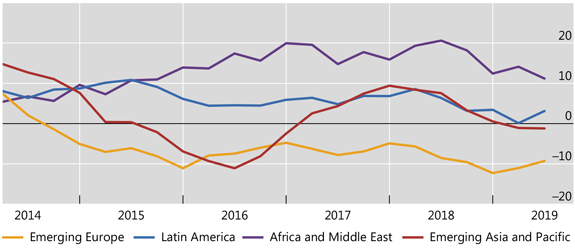
Graph 2: Annual percentage change of US dollar credit to EMDE regions (interactive graph).
Source: BIS global liquidity indicators (Table E2.1).
The annual growth rate of US dollar credit to residents of EMDEs (2% as of end-June 2019) remained considerably lower than its recent (end-March 2018) peak of 8%. US dollar credit to Africa and the Middle East continued to expand at a rapid annual pace (11%; Graph 2, purple line), reaching an outstanding stock of $0.9 trillion at end-June 2019. Meanwhile, US dollar credit to Latin America expanded by 3% year on year (blue line) to reach $1.0 trillion. Within the region, dollar credit to borrowers in Mexico and Chile grew at annual rates of 9% and 8%, respectively. This more than offset the contractions of US dollar credit to Argentina (-4%) and Brazil (-1%).
US dollar credit to borrowers in emerging Europe (Graph 2, yellow line) shrank by 9% year on year (to $0.4 trillion), extending the contraction that started in 2014. The latest annual decline was led by a 14% drop in lending to borrowers in Russia. Credit to Asia-Pacific (red line) also contracted, albeit at a slower annual rate (-1%), and stood at $1.4 trillion at end-June 2019. This was mainly driven by credit to non-bank borrowers in China, which declined at an annual rate of 6% at end-June 2019 (compared with +8% at end-2017).