Box: Oil and debt (February 2015)
(the full study is available in the March 2015 BIS Quarterly Review)
Since mid-2014, after remaining relatively stable for four years at close to $100, the price of crude oil has dropped by roughly 50% in US dollar terms.1
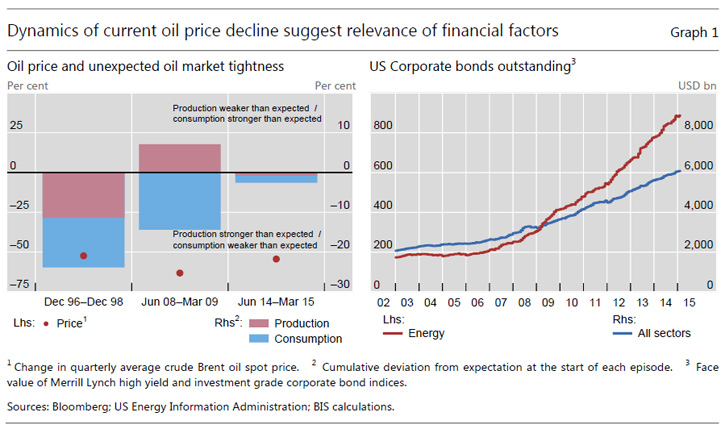
Changes in production and consumption seem to fall short of a fully satisfactory explanation of the abrupt collapse in oil prices. The last two episodes of comparable oil price declines (1996 and 2008) were associated with sizeable reductions of oil consumption and, in 1996, with a significant expansion of production. This seems to be in stark contrast to developments since mid-2014, during which time oil production has been close to prior expectations and oil consumption has been only a little weaker than forecast (Graph 1, left-hand panel). Rather, the steepness of the price decline and very large day-to-day price changes are reminiscent of a financial asset. As with other financial assets, movements in the price of oil are driven by changes in expectations about future market conditions. In this respect, the recent OPEC decision not to cut production has been key to the fall in the oil price.
However, other factors could have exacerbated the fall in oil prices. One important new element is the substantial increase in debt borne by the oil sector in recent years. The greater willingness of investors to lend against oil reserves and revenue has enabled oil firms to borrow large amounts in a period when debt levels have increased more broadly. Issuance by energy firms of both investment grade and high-yield bonds has far outpaced the already substantial overall issuance of debt securities (Graph 1, right-hand panel).
The greater debt burden of the oil sector may have influenced the recent dynamics of the oil market by exposing producers to solvency and liquidity risks. Lower prices tend to reduce the value of oil assets that back the debt. Indeed, spreads on energy high-yield bonds widened from a low of330 basis points in June 2014 to over 800 basis points in January; spreads on total high-yield debt have also widened, but not nearly as much. Against this background of high debt, a fall in the price of oil weakens the balance sheets of producers and tightens credit conditions, potentially exacerbating the price drop as a result of sales of oil assets (for example, more production is sold forward). Second, in flow terms, a lower price of oil reduces cash flows and increases the risk of liquidity shortfalls in which firms are unable to meet interest payments. Debt service requirements may induce continued physical production of oil to maintain cash flows, delaying the reduction in supply in the market. An additional factor that may amplify the oil price decline is that many oil firms located outside the United States have nevertheless borrowed in US dollars. As the left-hand panel of Graph 2 shows, oil firms in emerging market economies (EMEs) have seen the steepest increases in debt. If a stronger dollar were to be accompanied by more stringent financial conditions, then EME oil firms, which have increased borrowing significantly, could be particularly adversely affected.
Ample market liquidity had facilitated hedging through oil derivatives markets in the years before the recent price collapse. Selling futures or buying put options are ways for oil producers to hedge their exposure to highly volatile oil revenues. The short side of the market has been dominated historically by "merchants", ie agents engaged in the production or processing of oil. Since 2010, oil producers have increasingly relied on swap dealers as counterparties for their hedging transactions. In turn, swap dealers have laid off their exposures on the futures market as suggested by the trend increase in the CFTC short futures positions of swap dealers over the 2009-13 period (Graph 2, righthand panel).
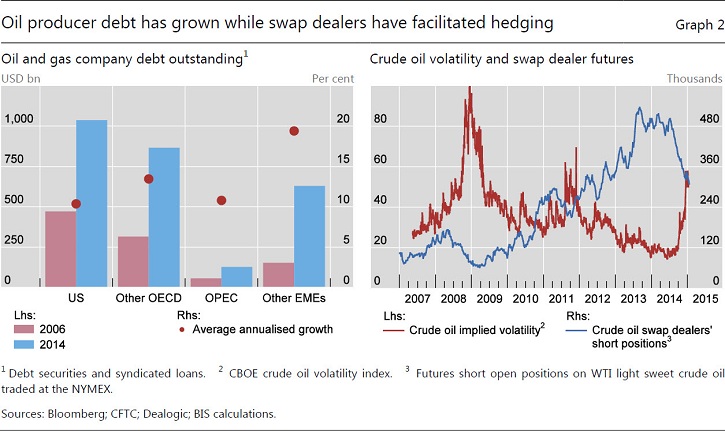
However, at times of heightened volatility and balance sheet strain for leveraged entities, swap dealers may become less willing to sell protection to oil producers. The co-movement in the dealers' positions and bouts of volatility suggests that dealers may have behaved procyclically - cutting back positions whenever financial conditions become more turbulent. In Graph 2, three such episodes can be seen: the onset of the Great Recession in 2008, the euro area crisis combined with the war in Libya in 2011, and the recent price slump. In response to greater reluctance by dealers to take the other side of sales, producers wishing to hedge their falling revenues may have turned to the derivatives markets directly, without going through an intermediary. This shift in the liquidity of hedging markets could have played a role in recent price dynamics.
Taken together, the interaction of oil prices and the debt and balance sheet capacity of intermediaries introduce a new element into the discussion of oil market developments. The build-up of debt in the oil sector is a reminder that high debt levels can induce significant macro-financial interactions. Such interactions need to be understood better in order fully to appreciate the macroeconomic impact of falling oil prices.
1 This box contains initial findings of a BIS analysis of the oil-debt nexus. The full study is forthcoming in the March, 2015 issue of the BIS Quarterly Review.
23.02.2015: Please note that both graphs have been updated. Graph 1: typographical error corrected. Graph 2: error in calculating syndicated loan volumes corrected.