This website requires javascript for proper use
Annual Economic Report 2022 - underlying data behind the graphs
Full data set
(zip)
Chapter I: Old challenges, new shocks -
read the chapter
Data set
Chapter I data set
(xlsx)
Images
Link in document
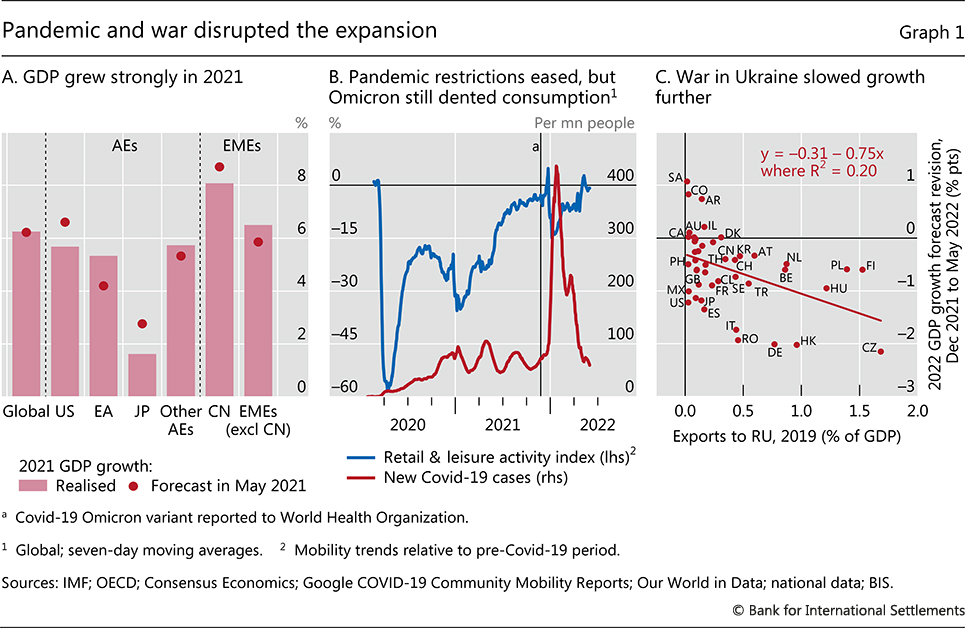
Graph 1
Pandemic and war disrupted the expansion
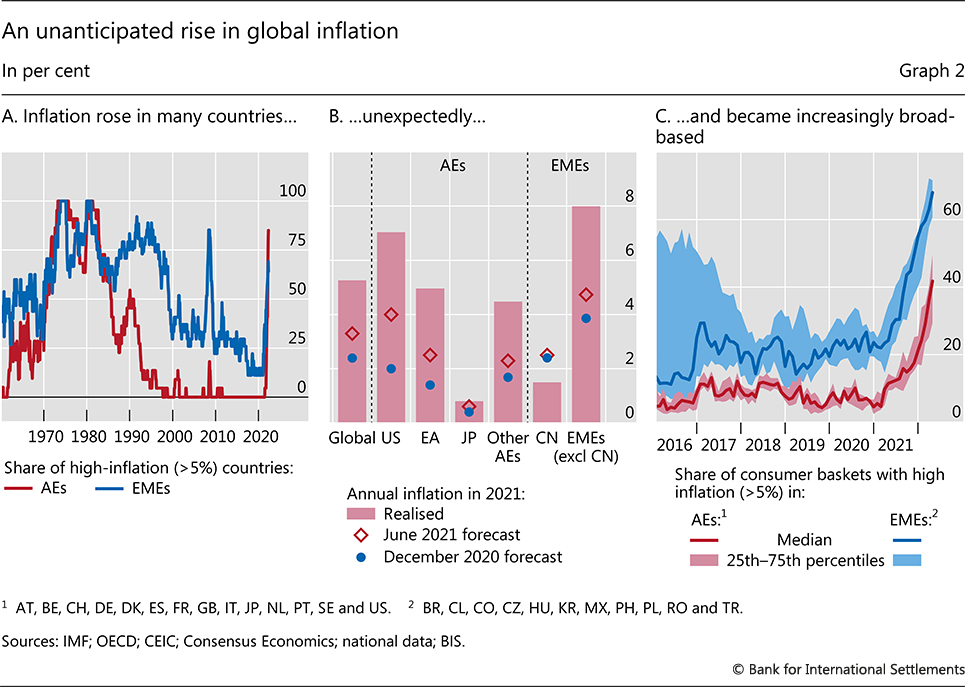
Graph 2
An unanticipated rise in global inflation
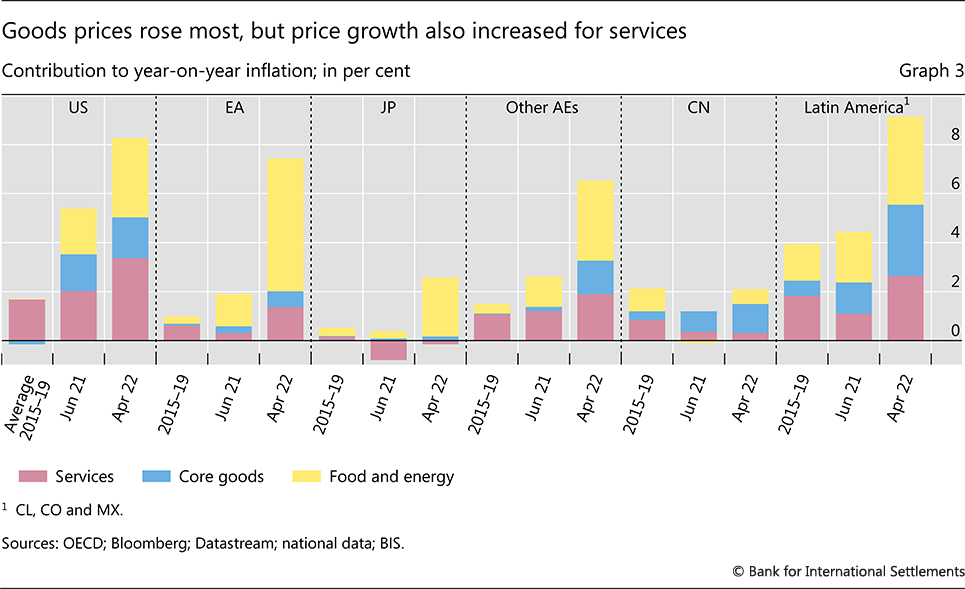
Graph 3
Goods prices rose most, but price growth also increased for services
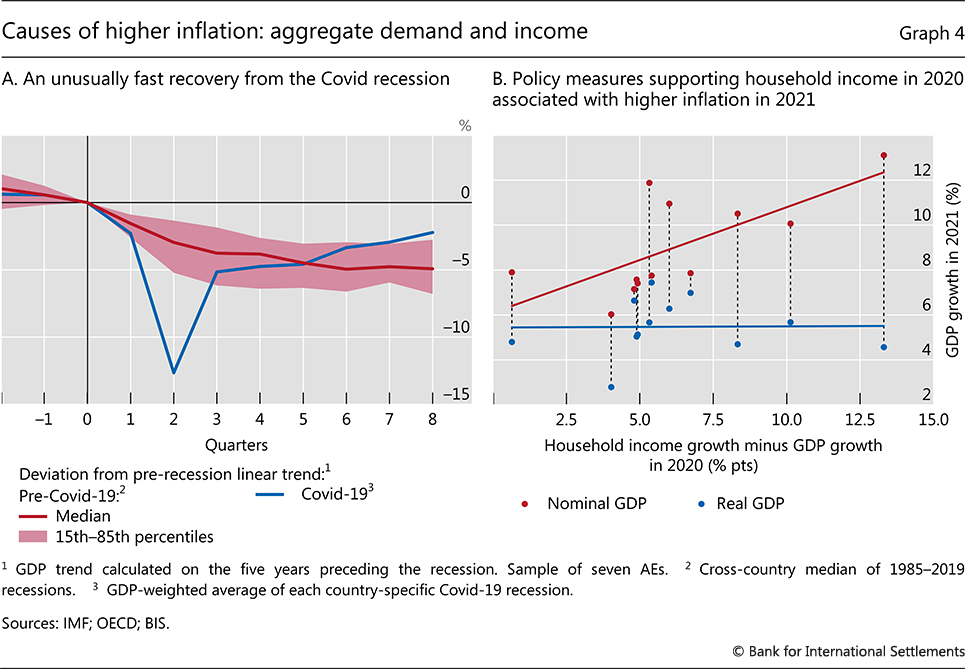
Graph 4
Causes of higher inflation: aggregate demand and income
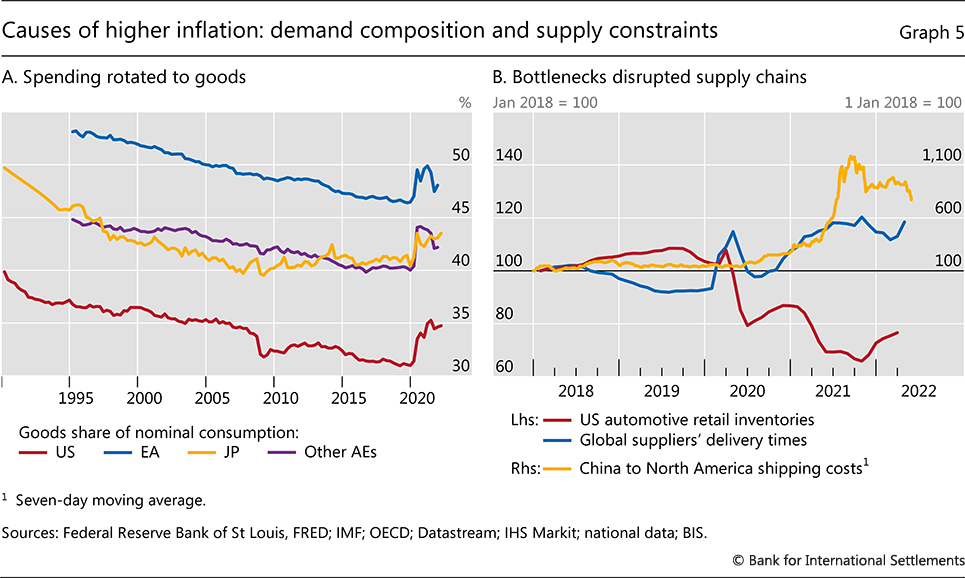
Graph 5
Causes of higher inflation: demand composition and supply constraints
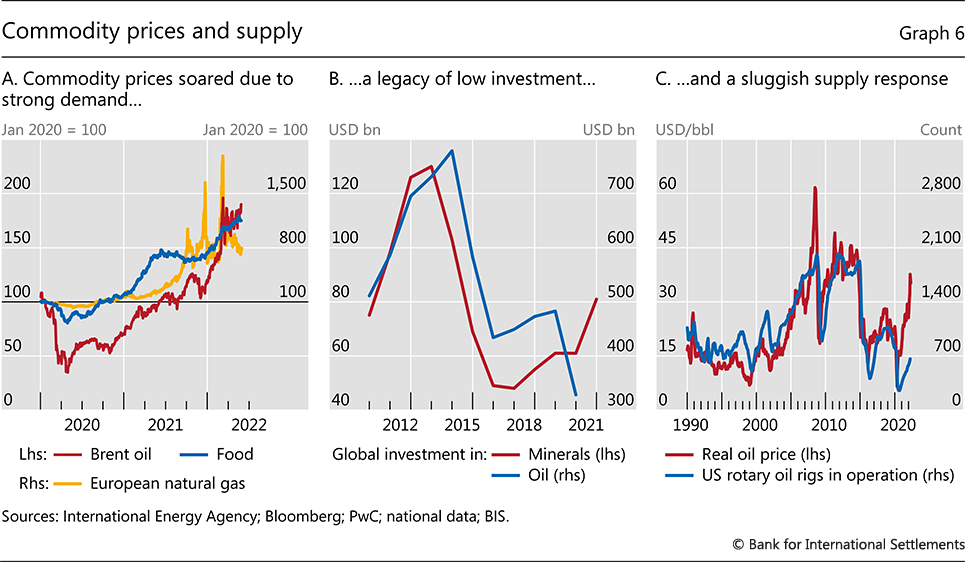
Graph 6
Commodity prices and supply
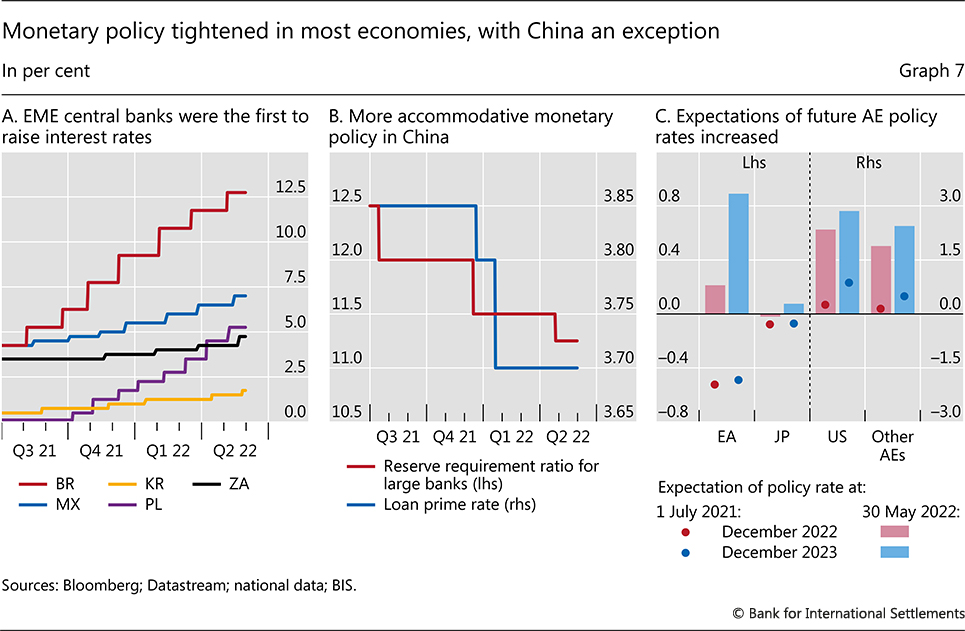
Graph 7
Monetary policy tightened in most economies, with China an exception
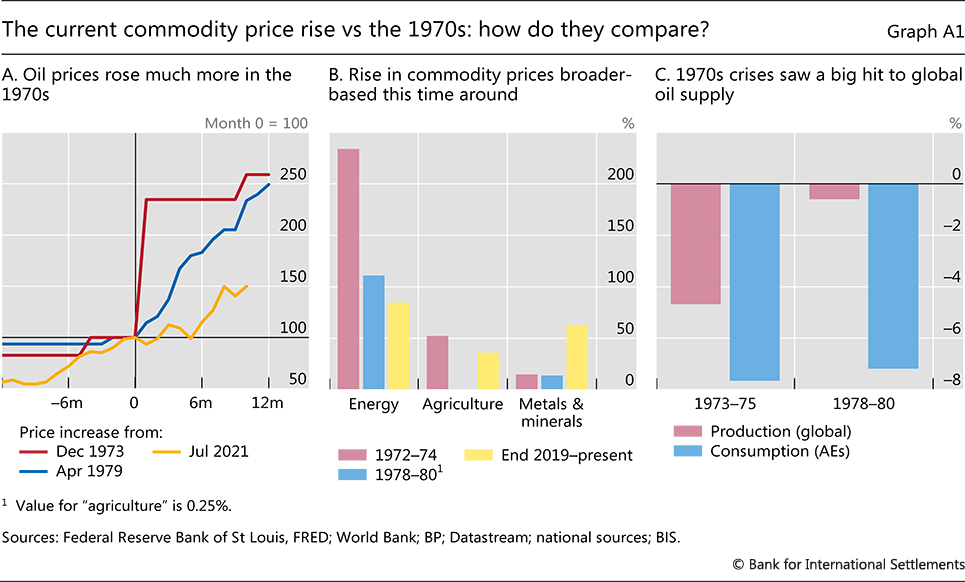
Graph A1
The current commodity price rise vs the 1970s: how do they compare?
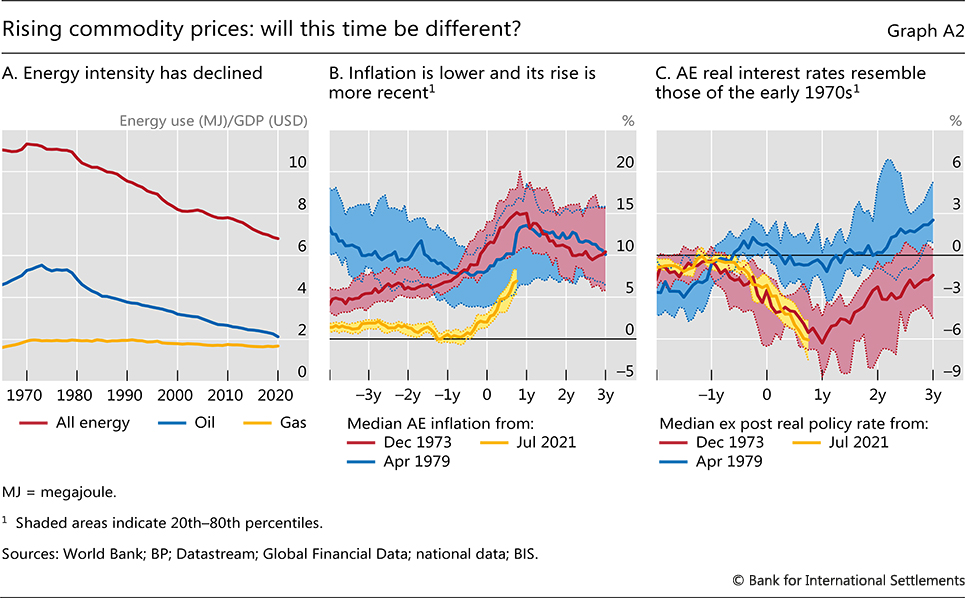
Graph A2
Rising commodity prices: will this time be different?
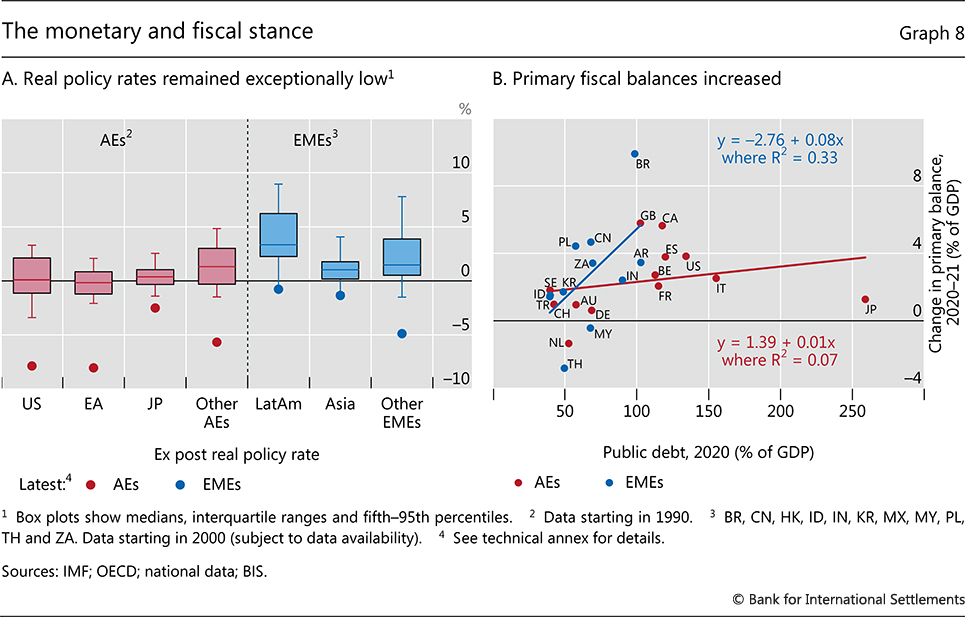
Graph 8
The monetary and fiscal stance
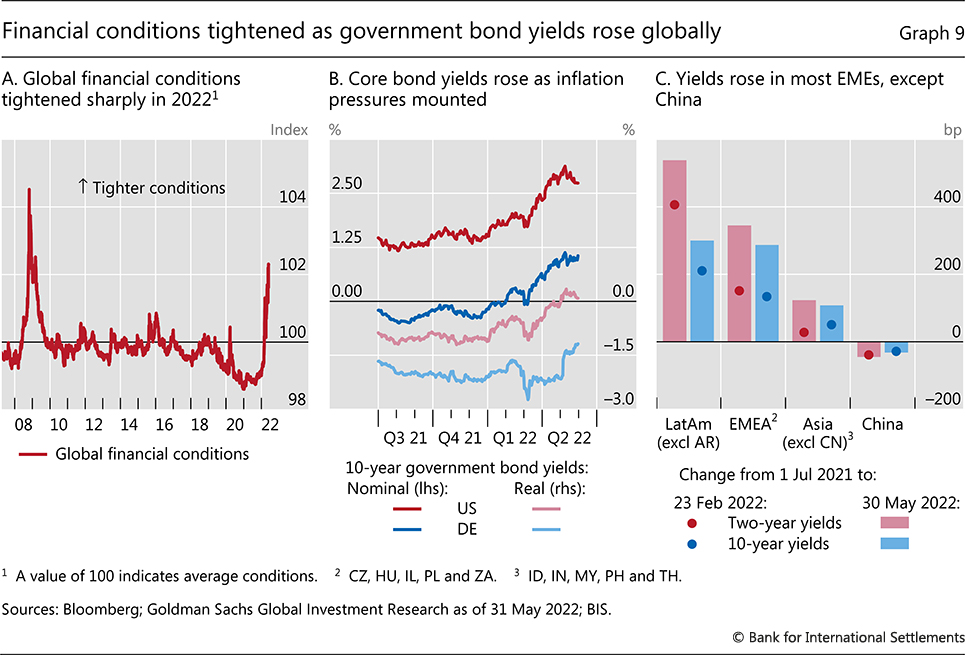
Graph 9
Financial conditions tightened as government bond yields rose globally
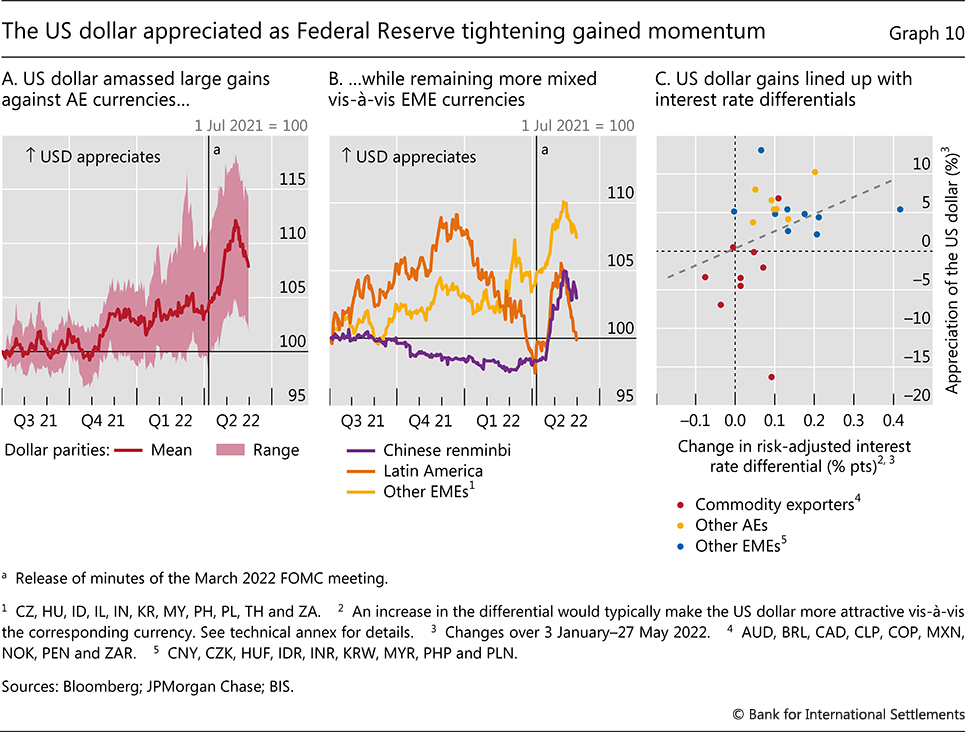
Graph 10
The US dollar appreciated as Federal Reserve tightening gained momentum
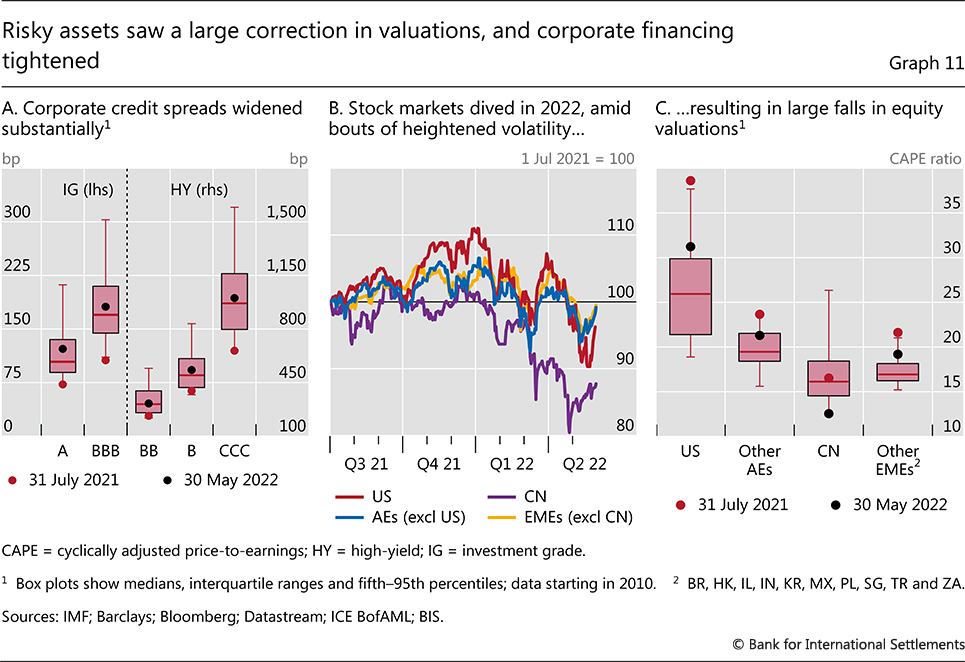
Graph 11
Risky assets saw a large correction in valuations, and corporate financing tightened
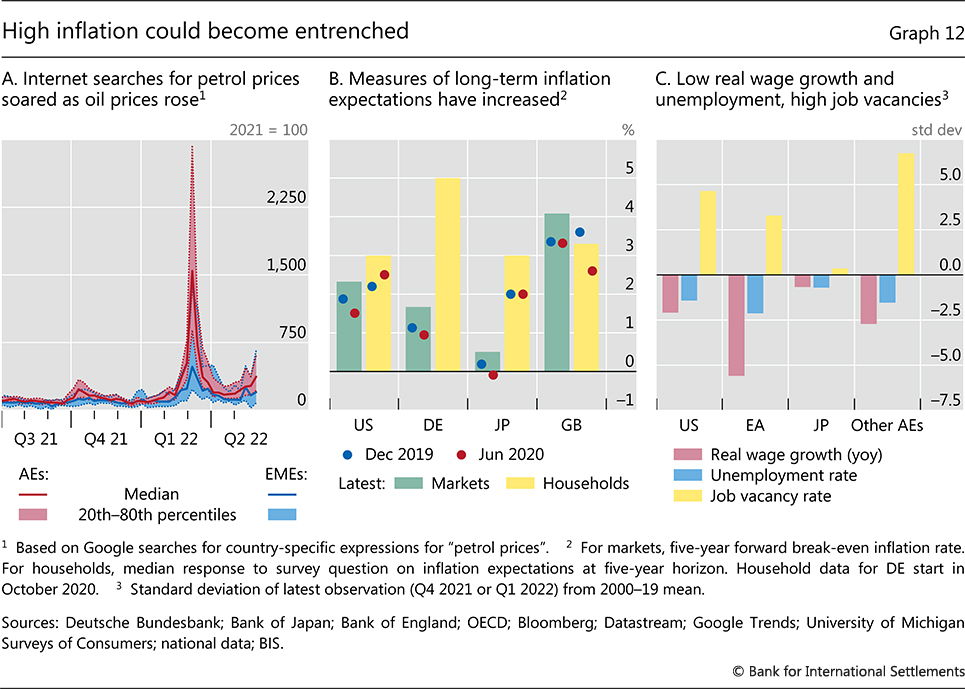
Graph 12
High inflation could become entrenched
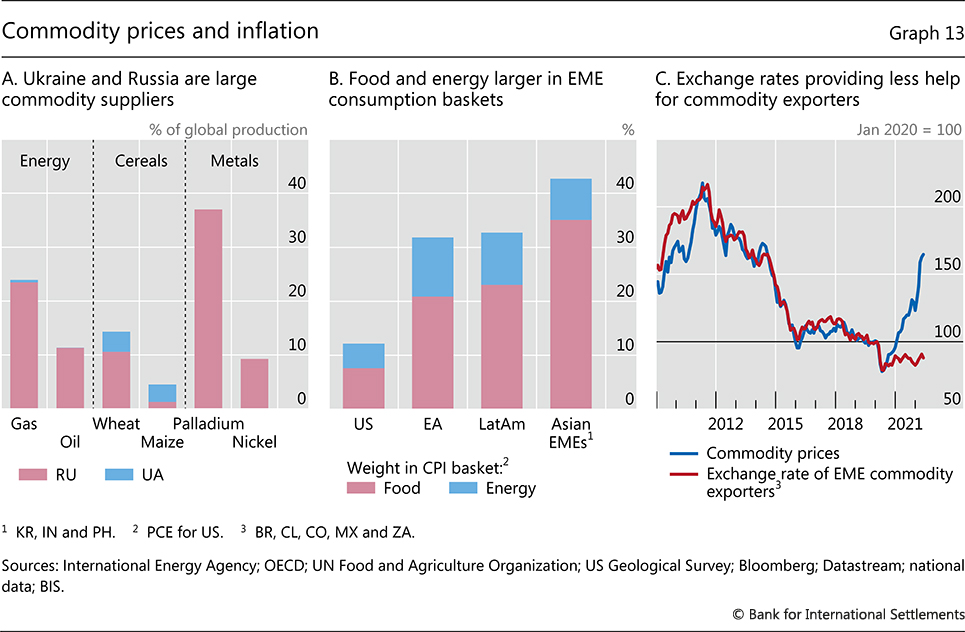
Graph 13
Commodity prices and inflation
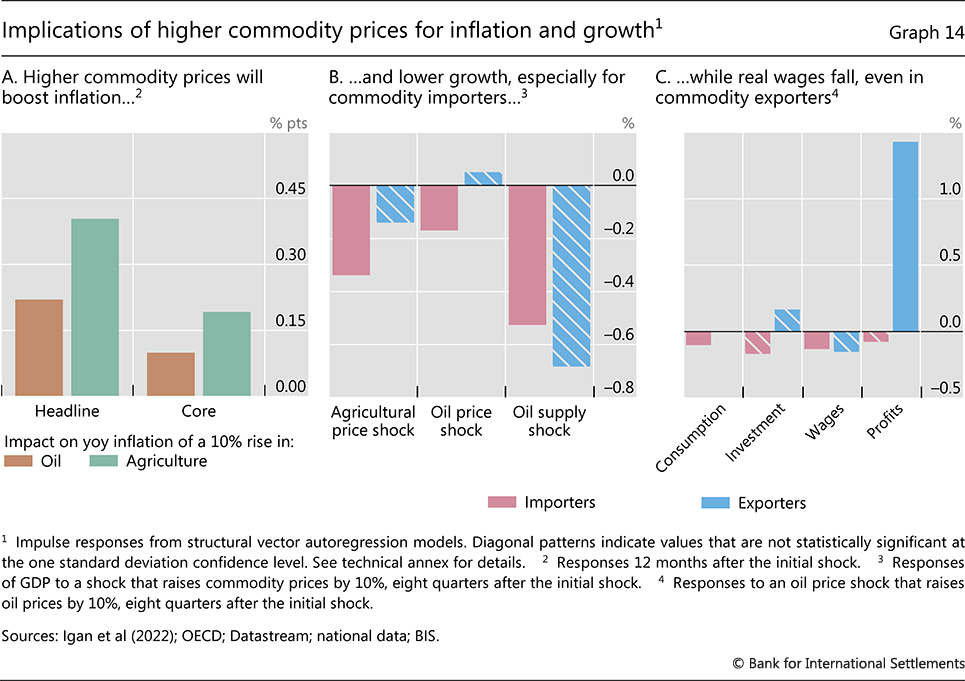
Graph 14
Implications of higher commodity prices for inflation and growth
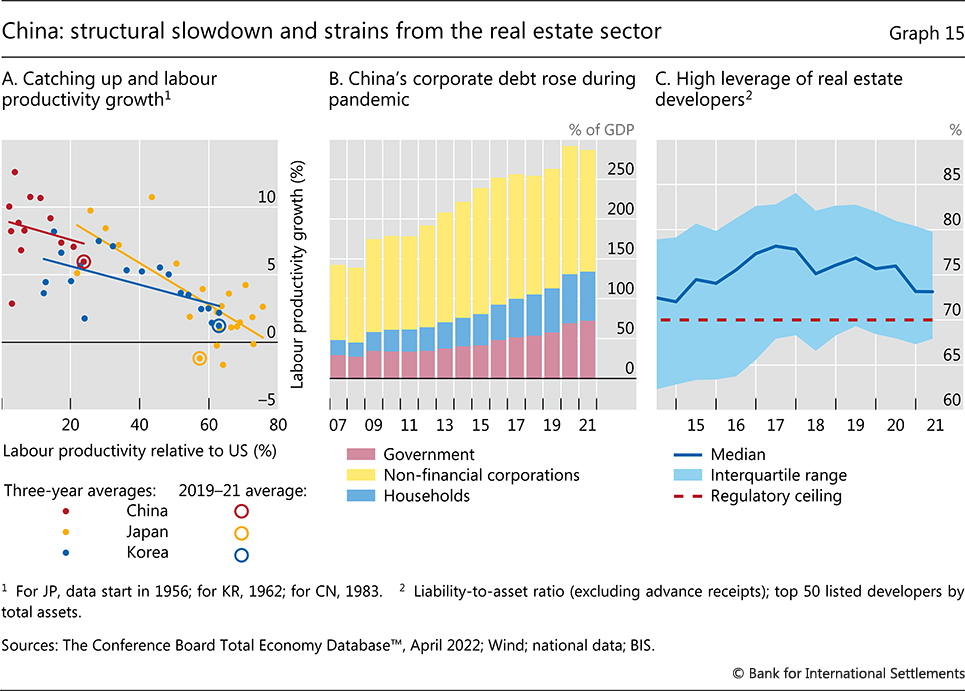
Graph 15
China: structural slowdown and strains from the real estate sector
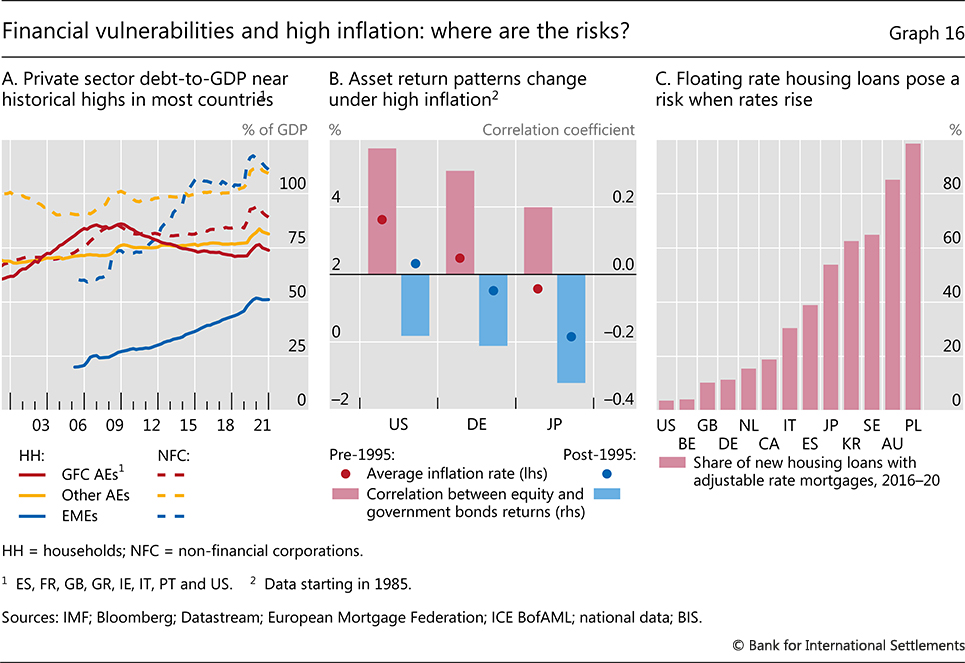
Graph 16
Financial vulnerabilities and high inflation: where are the risks?
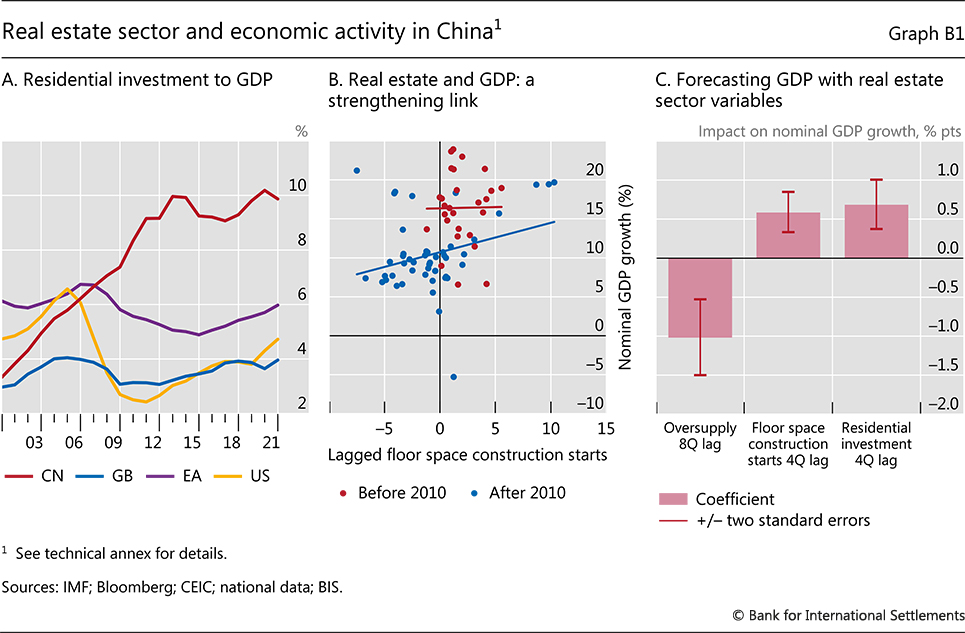
Graph B1
Real estate sector and economic activity in China
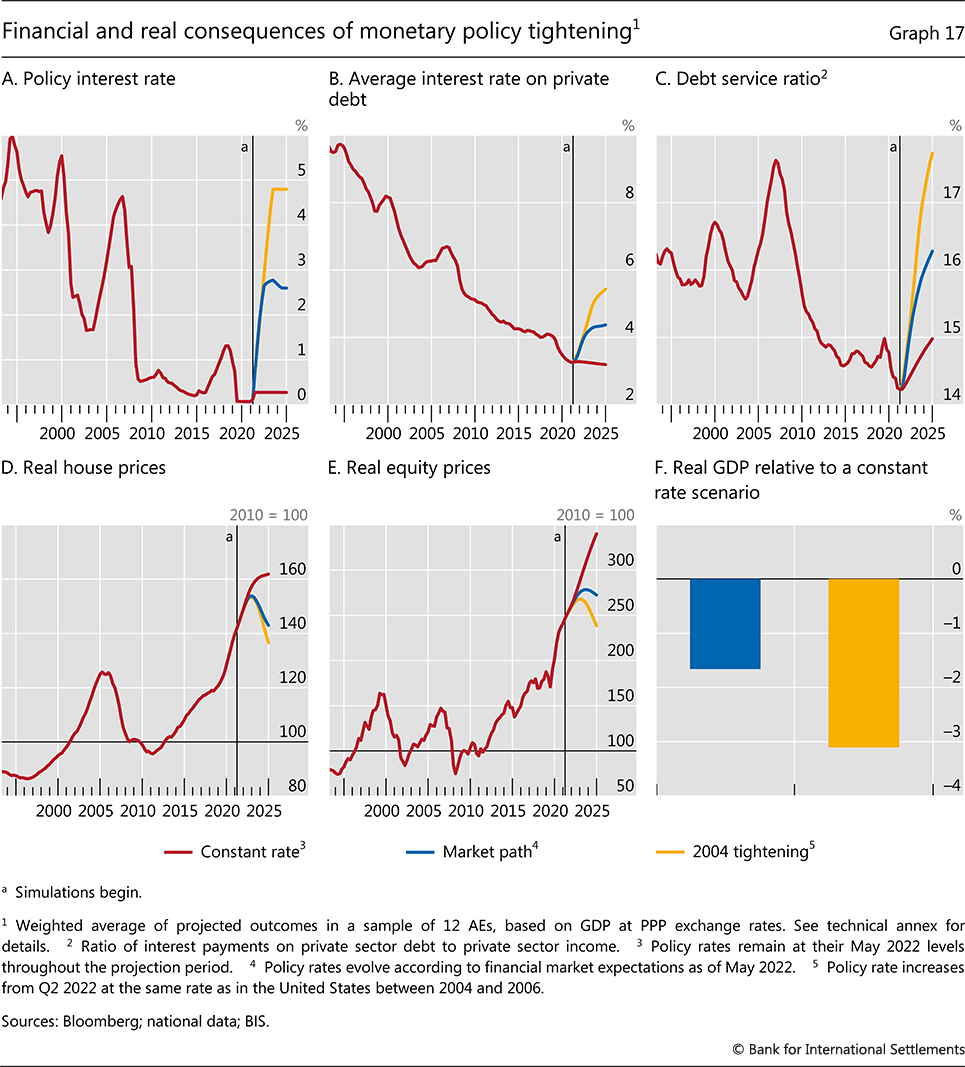
Graph 17
Financial and real consequences of monetary policy tightening
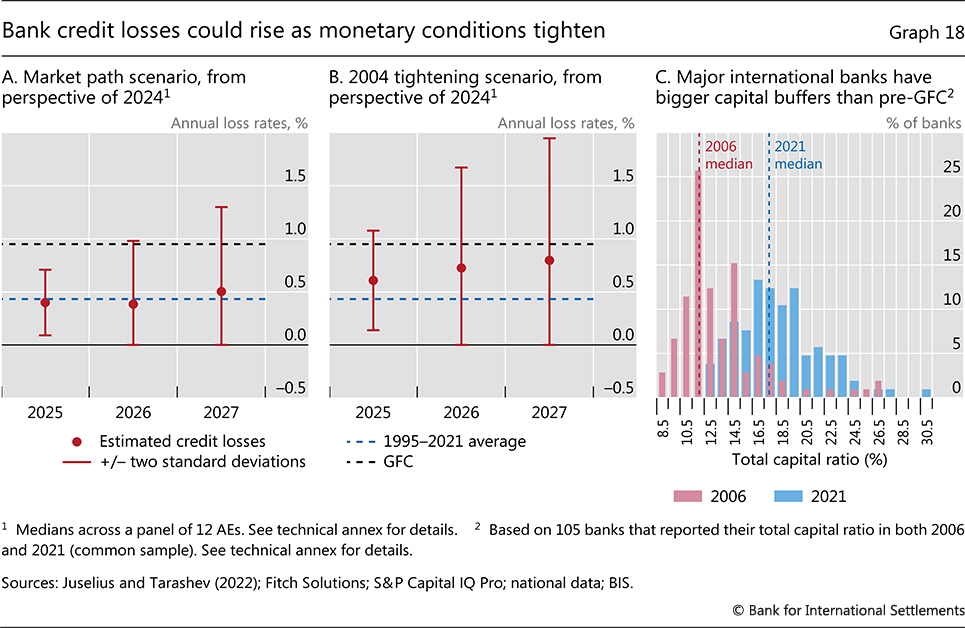
Graph 18
Bank credit losses could rise as monetary conditions tighten
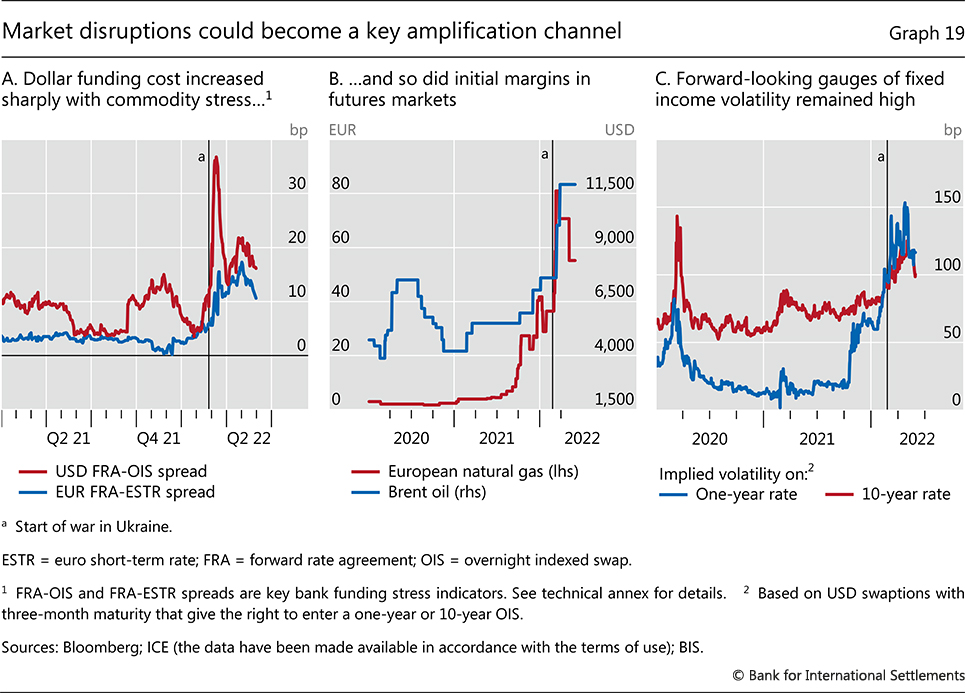
Graph 19
Market disruptions could become a key amplification channel
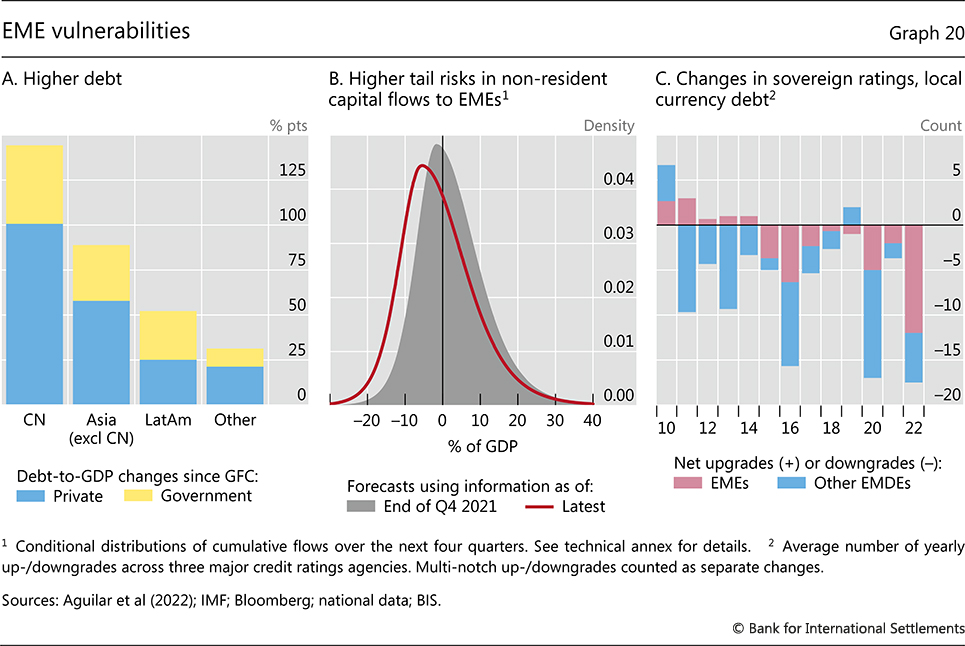
Graph 20
EME vulnerabilities
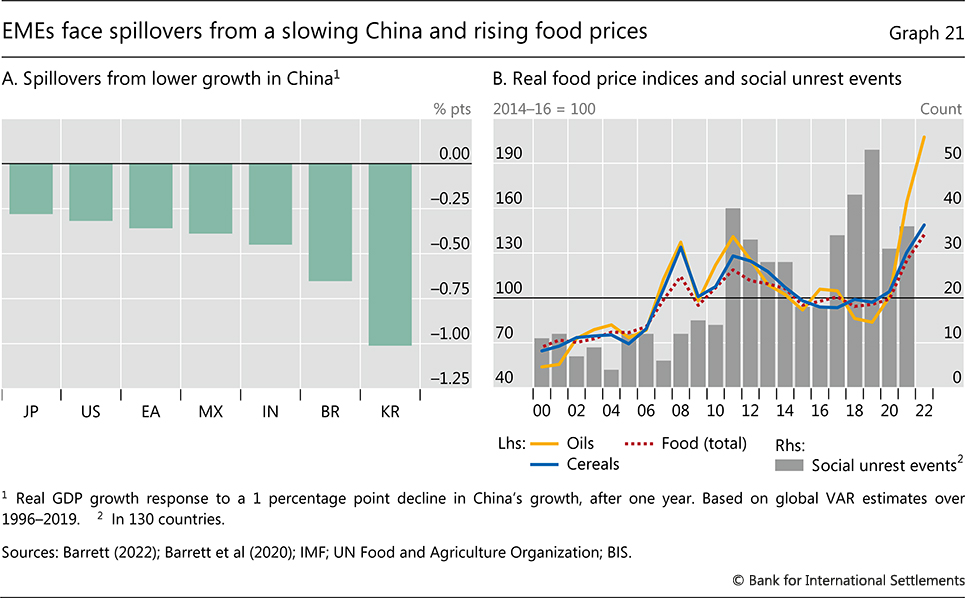
Graph 21
EMEs face spillovers from a slowing China and rising food prices
Table C1
Hard and soft landings
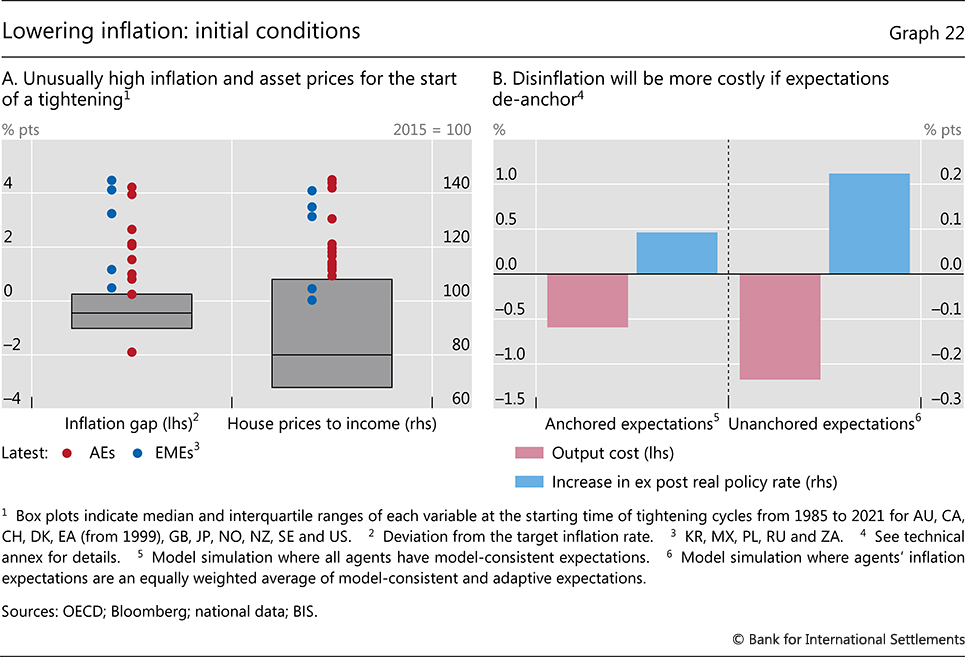
Graph 22
Lowering inflation: initial conditions
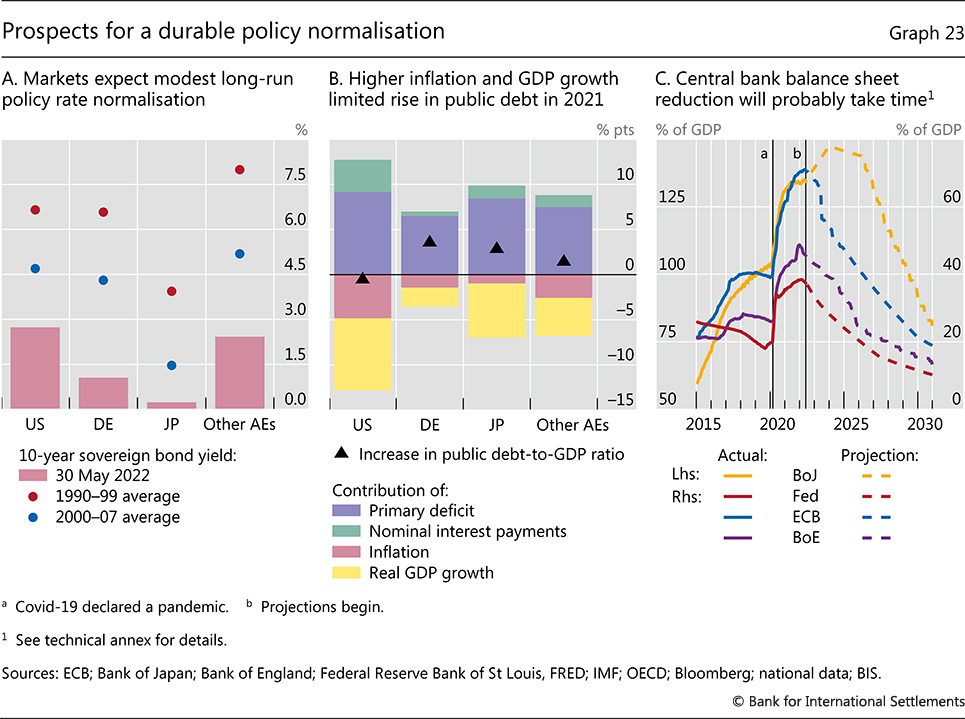
Graph 23
Prospects for a durable policy normalisation
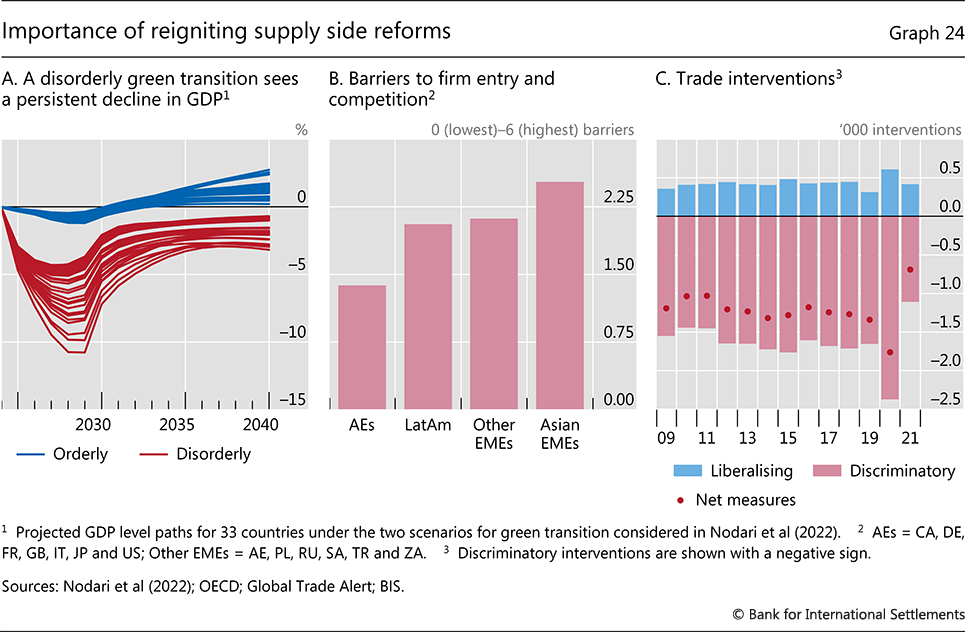
Graph 24
Importance of reigniting supply side reforms
Chapter II: Inflation: a look under the hood -
read the chapter
Data set
Chapter II data set
(xlsx)
Images
Link in document
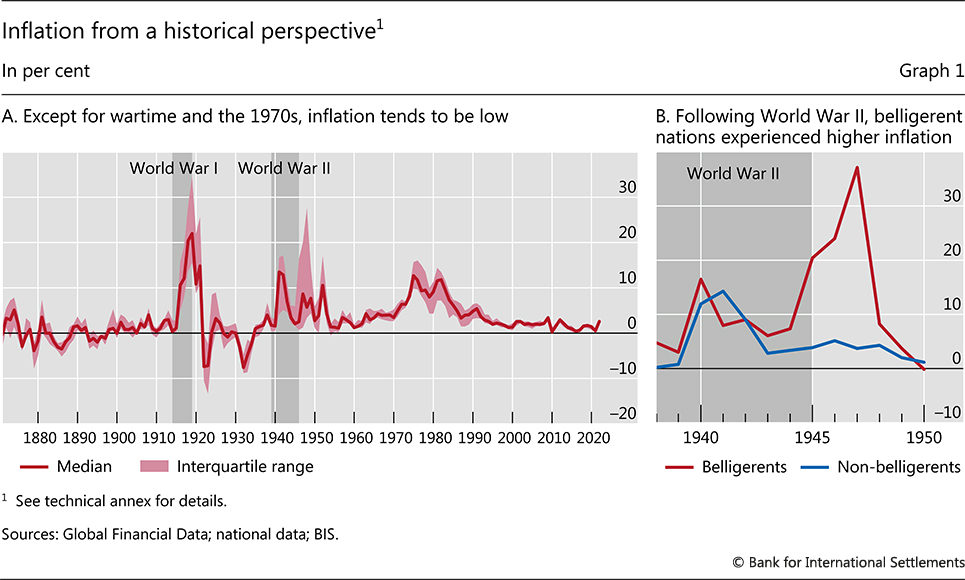
Graph 1
Inflation from a historical perspective
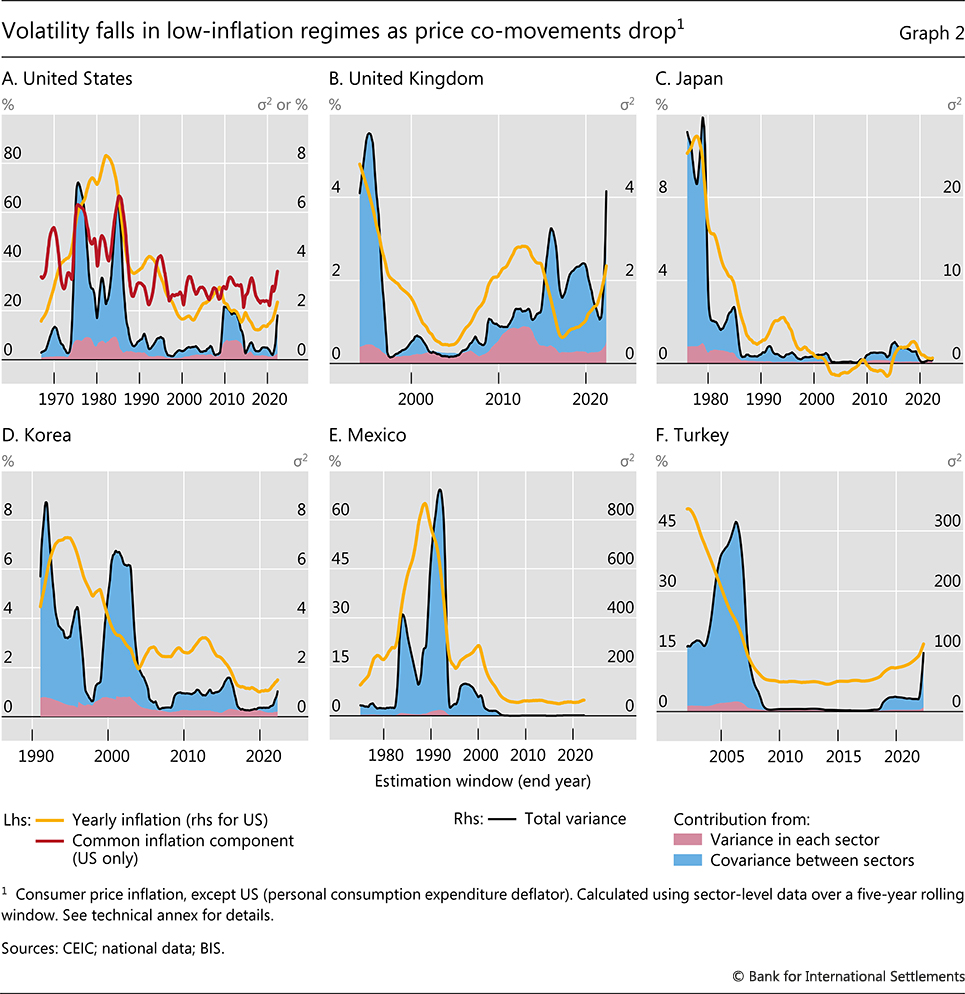
Graph 2
Volatility falls in low-inflation regimes as price co-movements drop
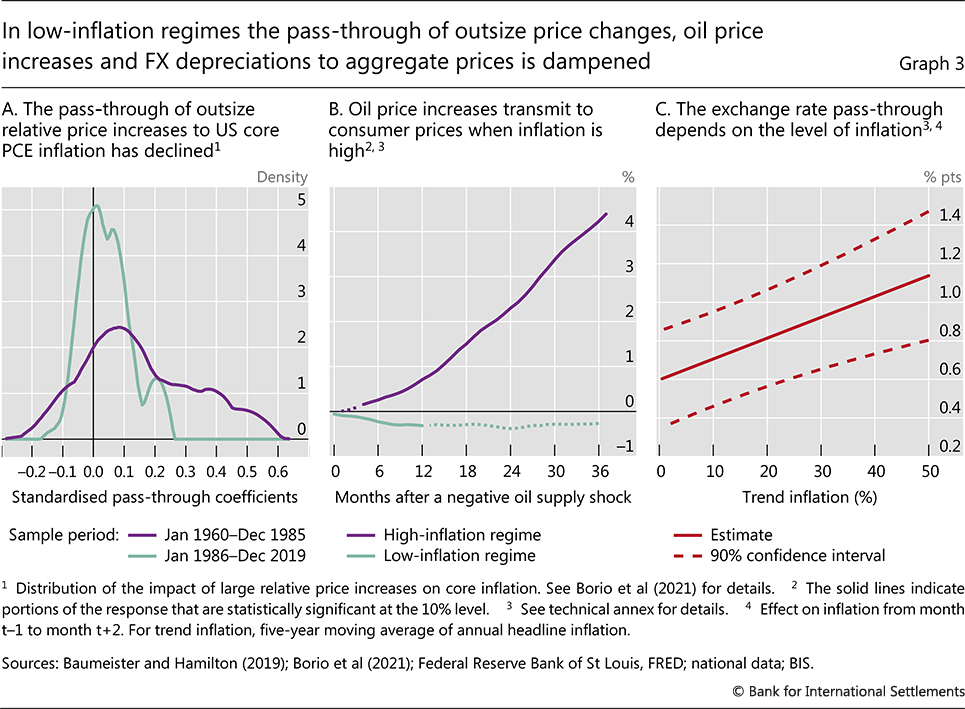
Graph 3
In low-inflation regimes the pass-through of outsize price changes, oil price increases and FX depreciations to aggregate prices is dampened
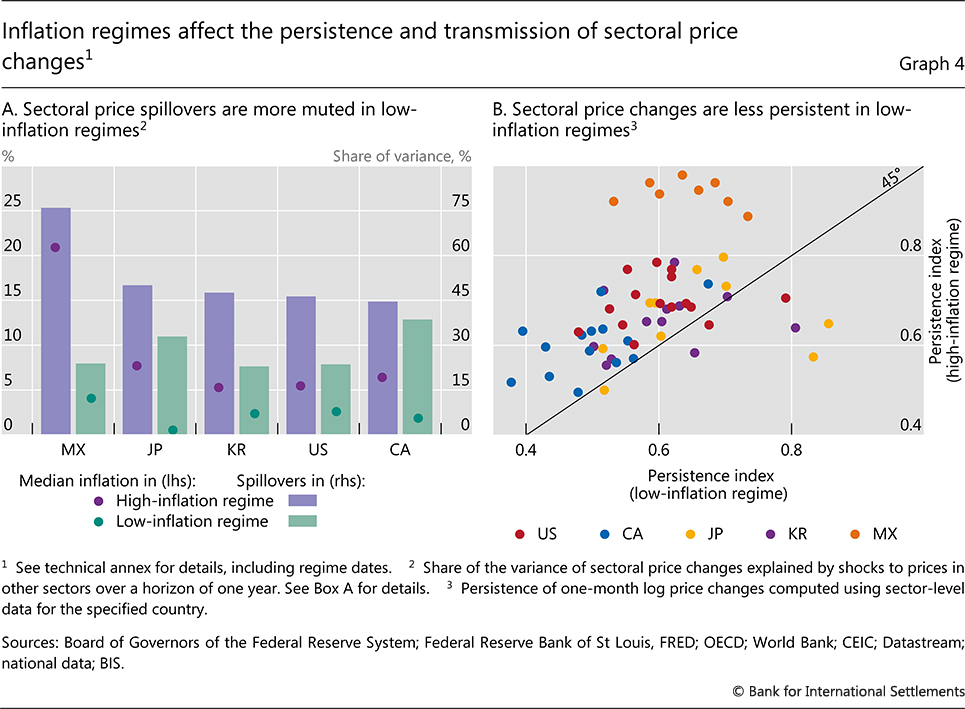
Graph 4
Inflation regimes affect the persistence and transmission of sectoral price changes
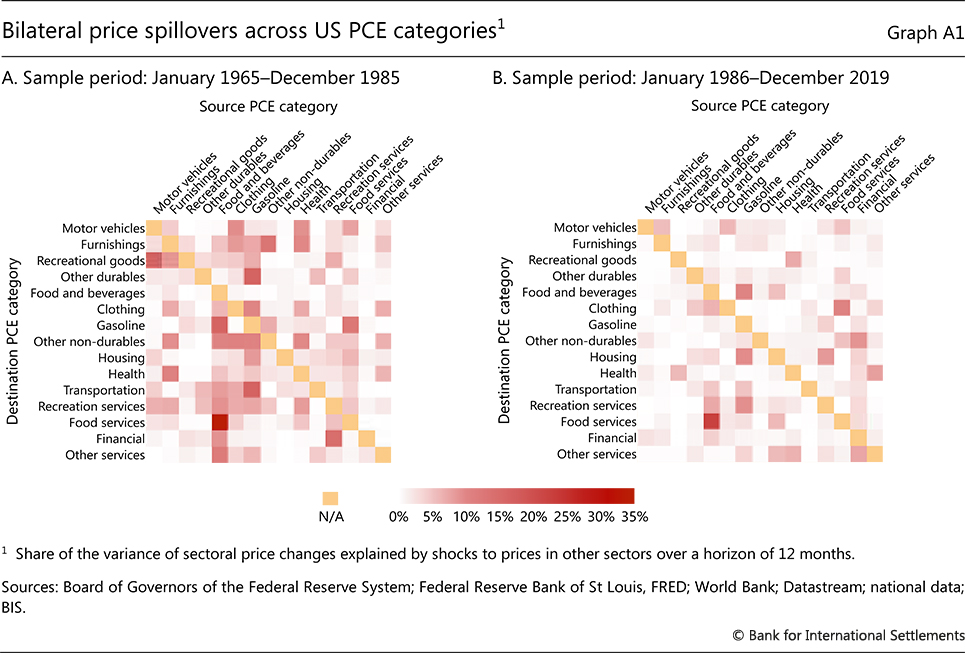
Graph A1
Bilateral price spillovers across US PCE categories
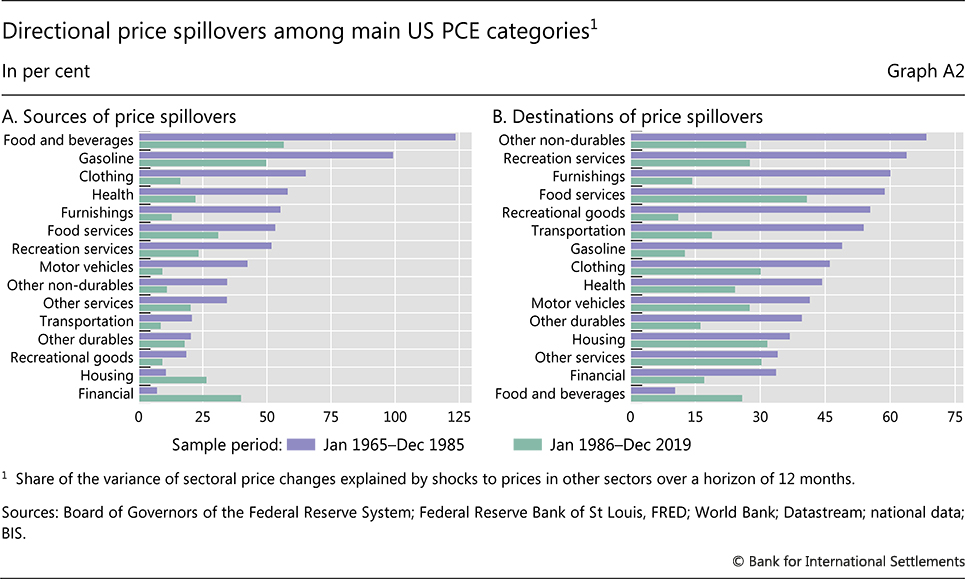
Graph A2
Directional price spillovers among main US PCE categories
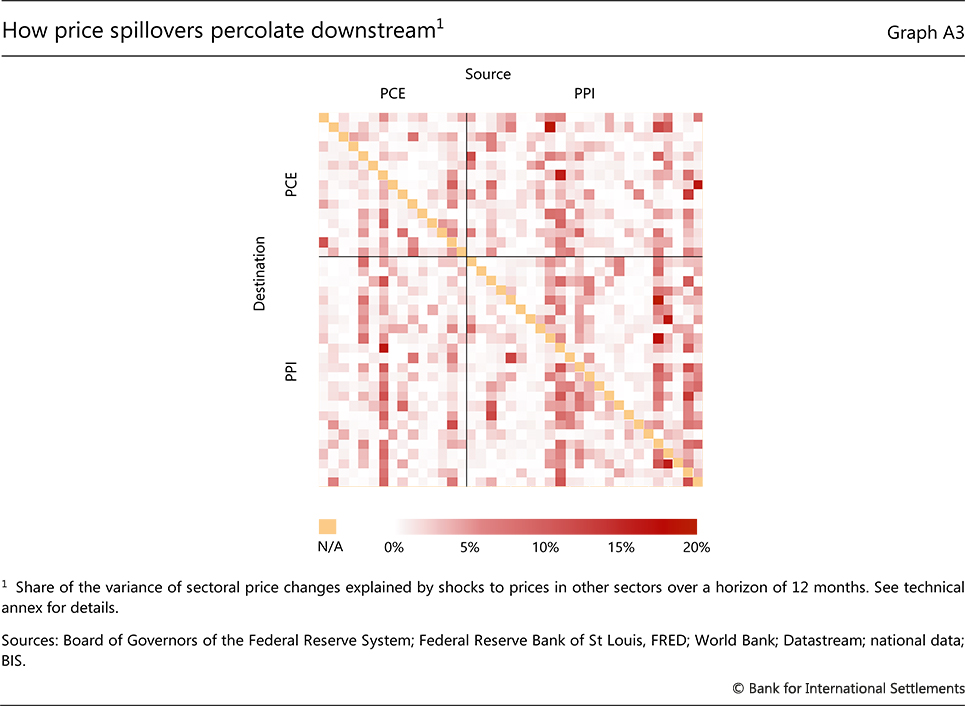
Graph A3
How price spillovers percolate downstream
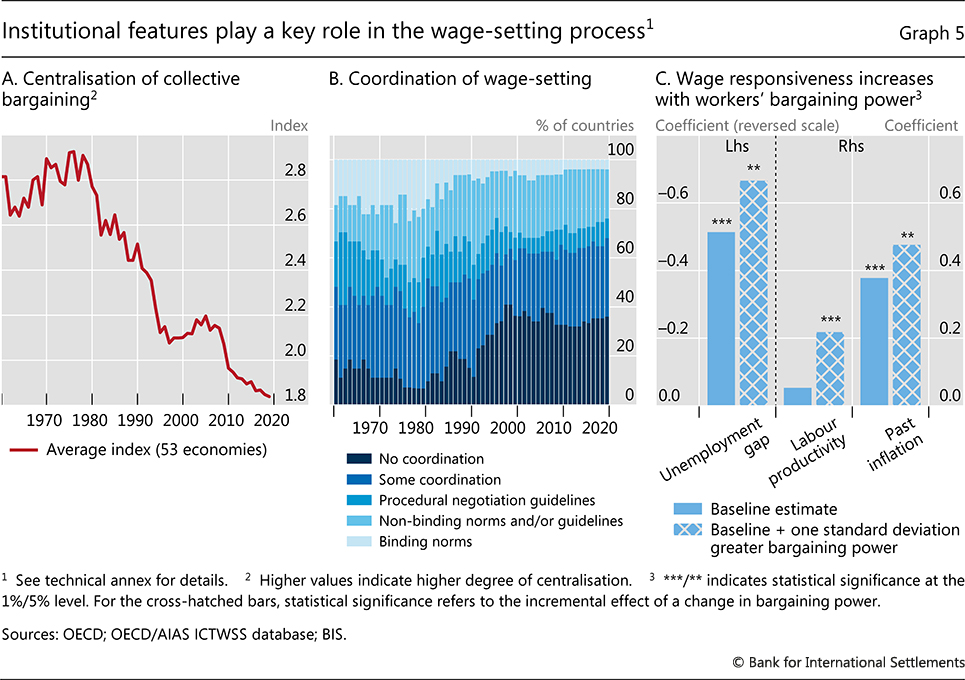
Graph 5
Institutional features play a key role in the wage-setting process
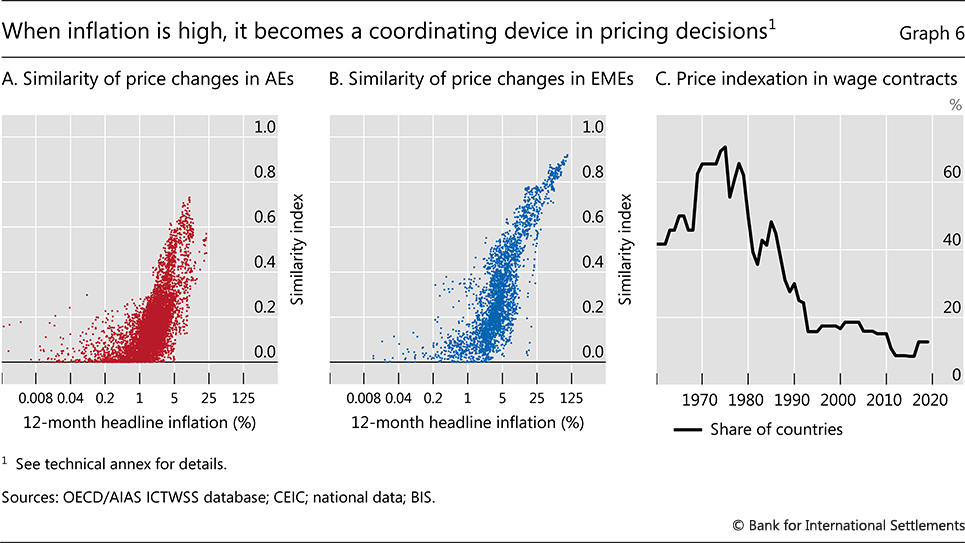
Graph 6
When inflation is high, it becomes a coordinating device in pricing decisions
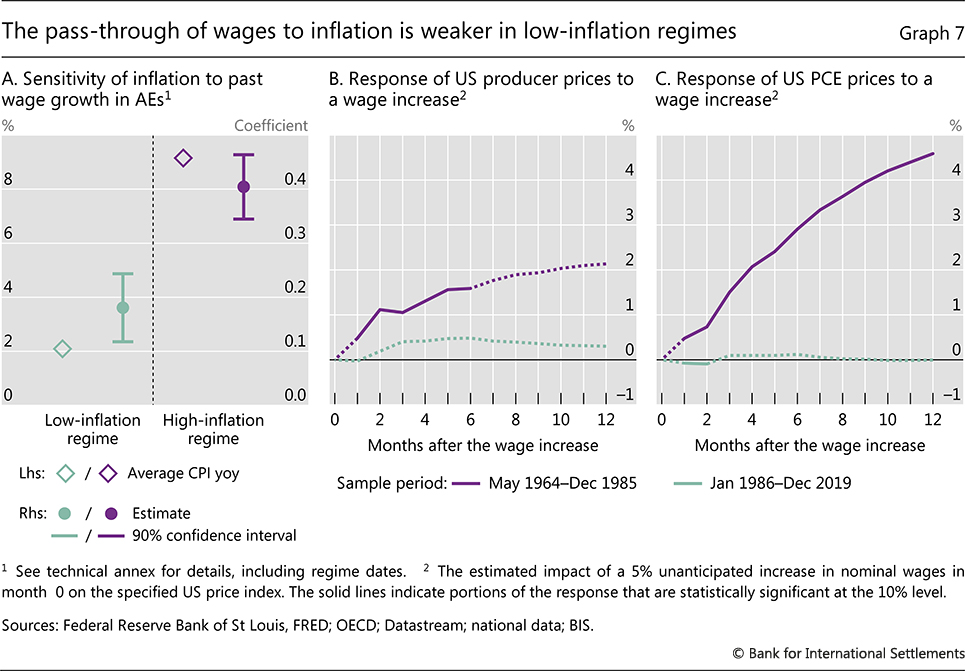
Graph 7
The pass-through of wages to inflation is weaker in low-inflation regimes
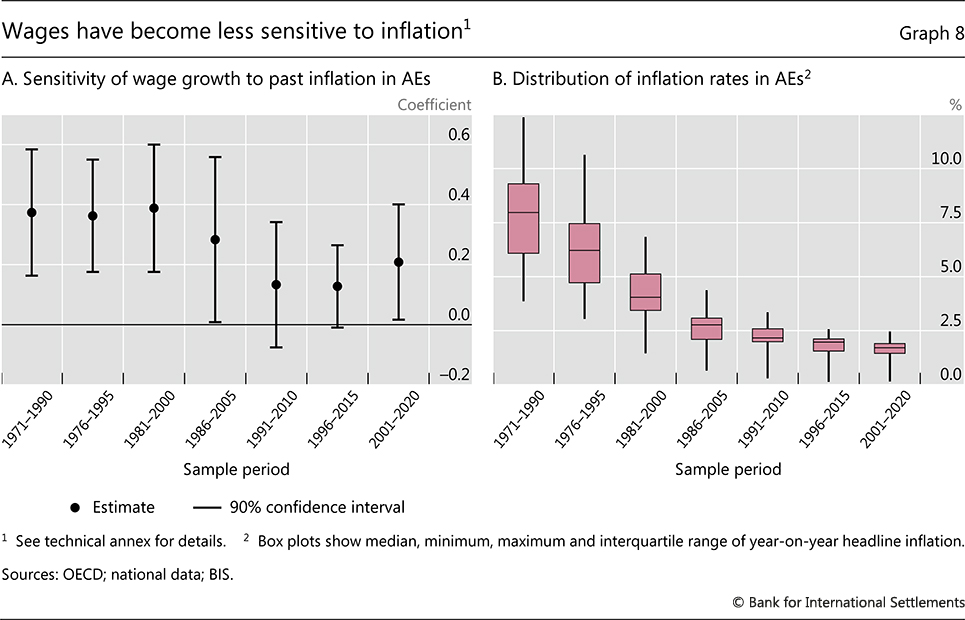
Graph 8
Wages have become less sensitive to inflation
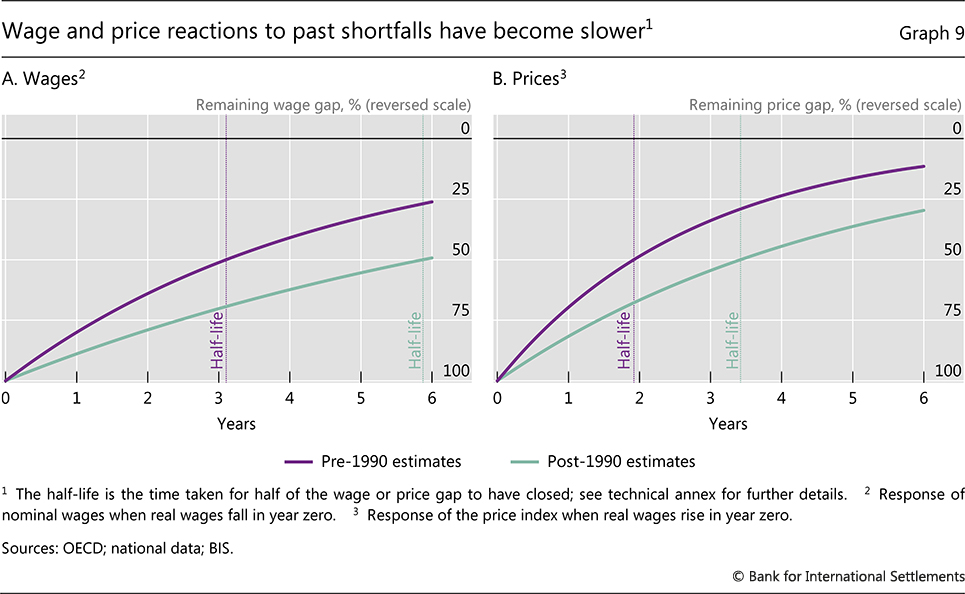
Graph 9
Wage and price reactions to past shortfalls have become slower
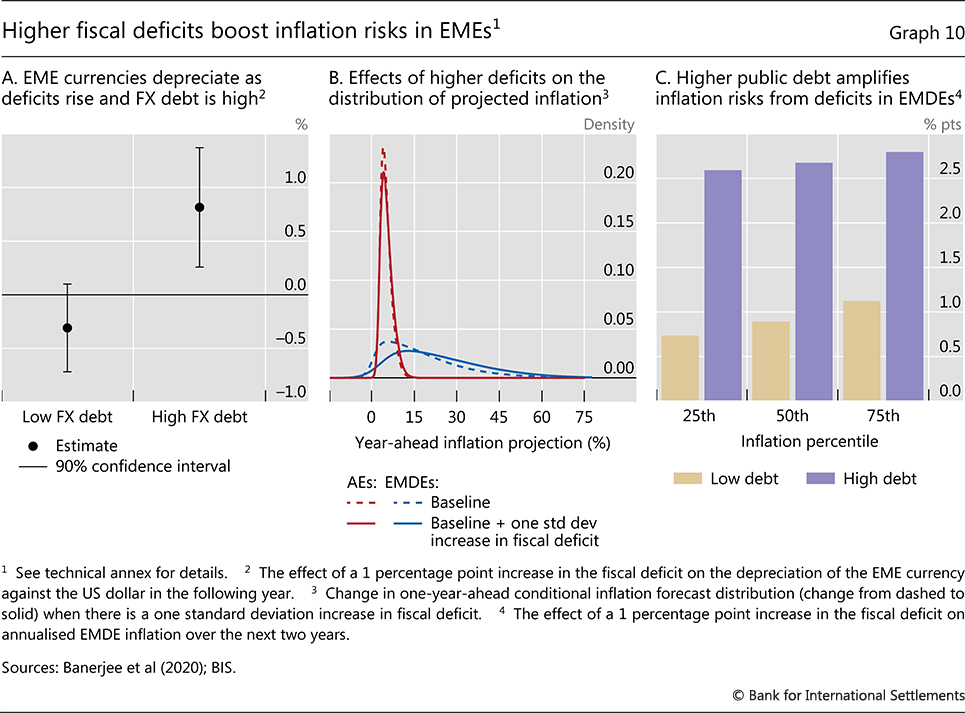
Graph 10
Higher fiscal deficits boost inflation risks in EMEs
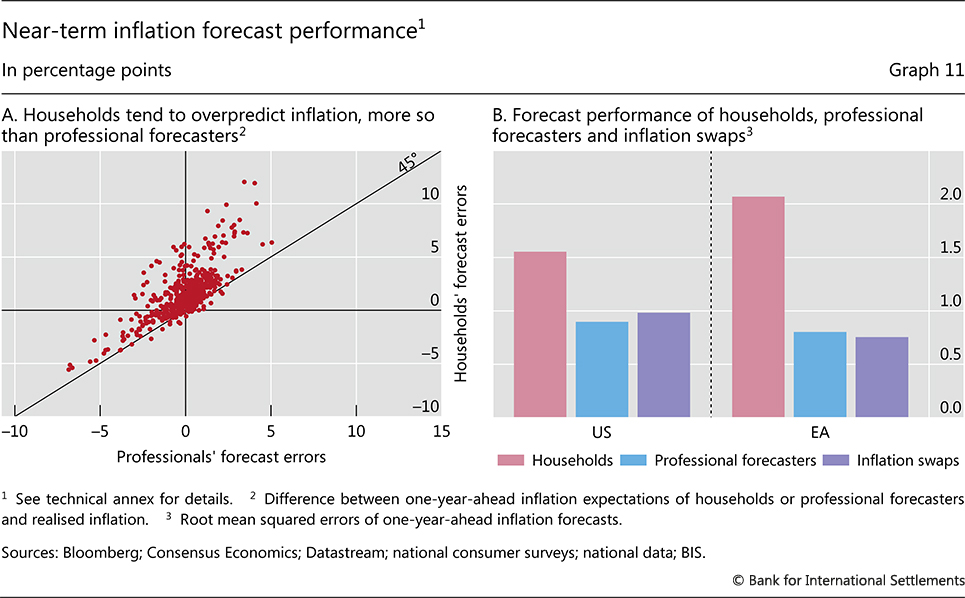
Graph 11
Near-term inflation forecast performance
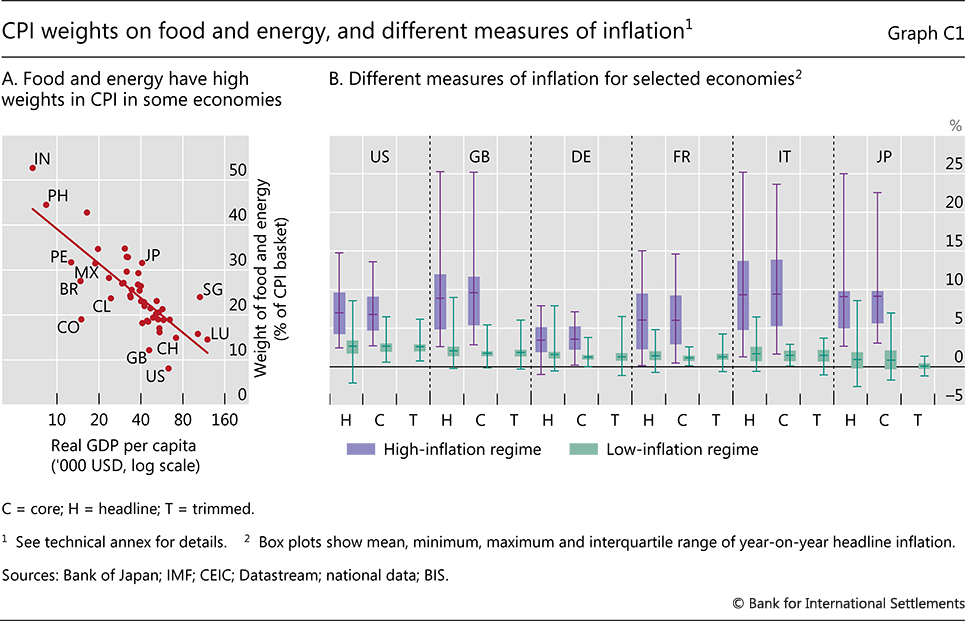
Graph C1
CPI weights on food and energy, and different measures of inflation
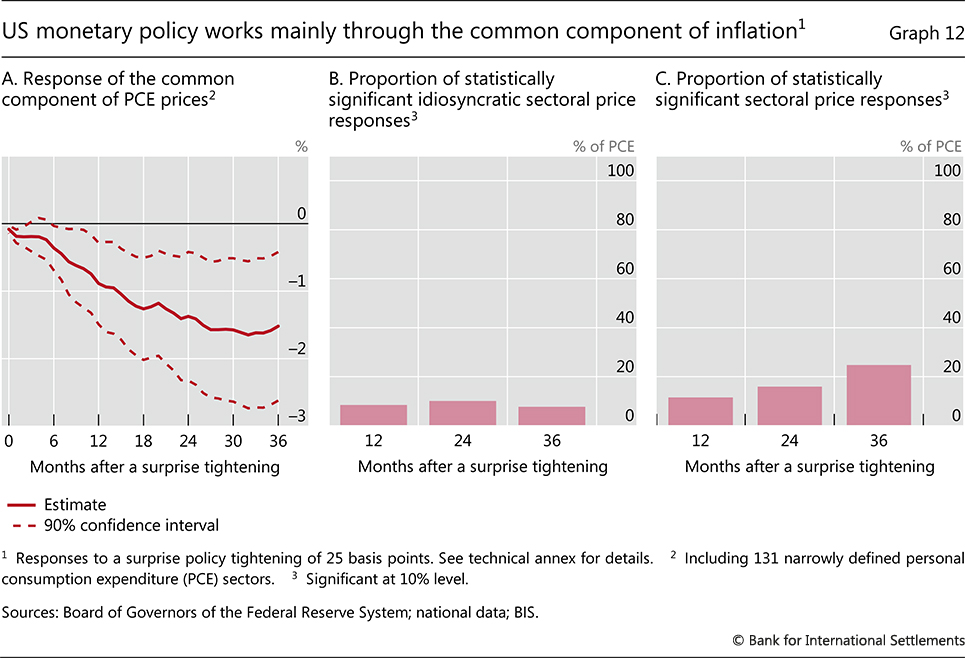
Graph 12
US monetary policy works mainly through the common component of inflation
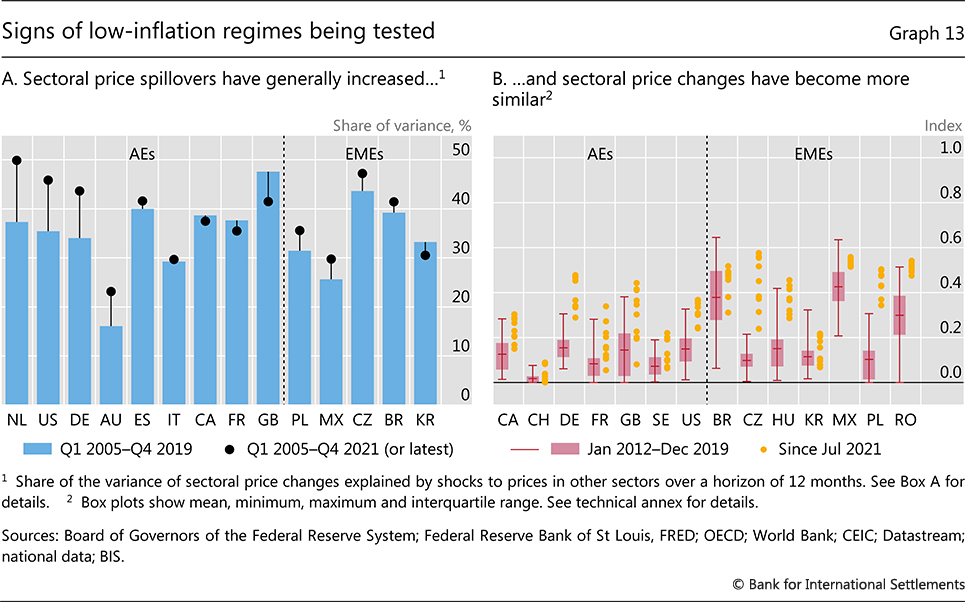
Graph 13
Signs of low-inflation regimes being tested
Chapter III: The future monetary system -
read the chapter
Data set
Chapter III data set
(xlsx)
Images
Link in document
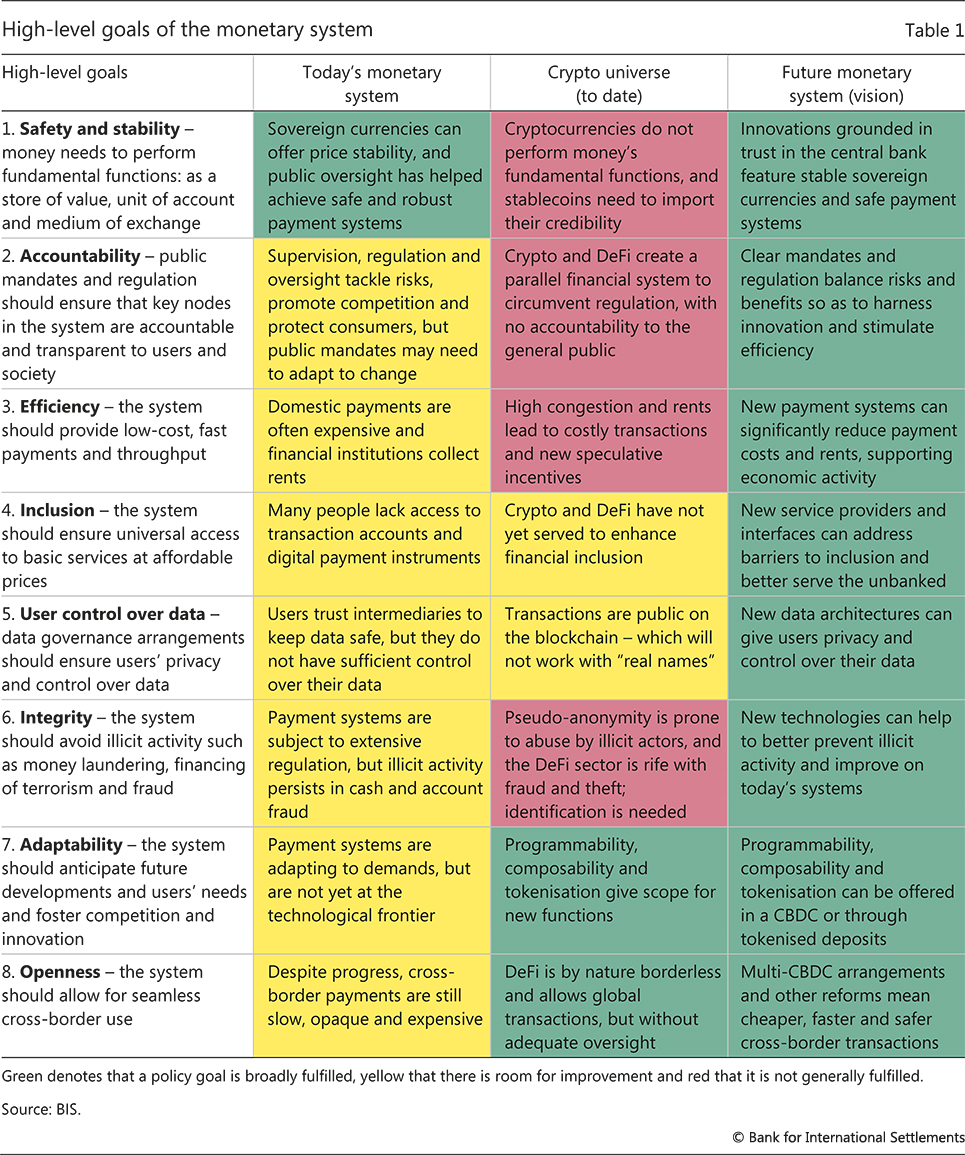
Table 1
High-level goals of the monetary system
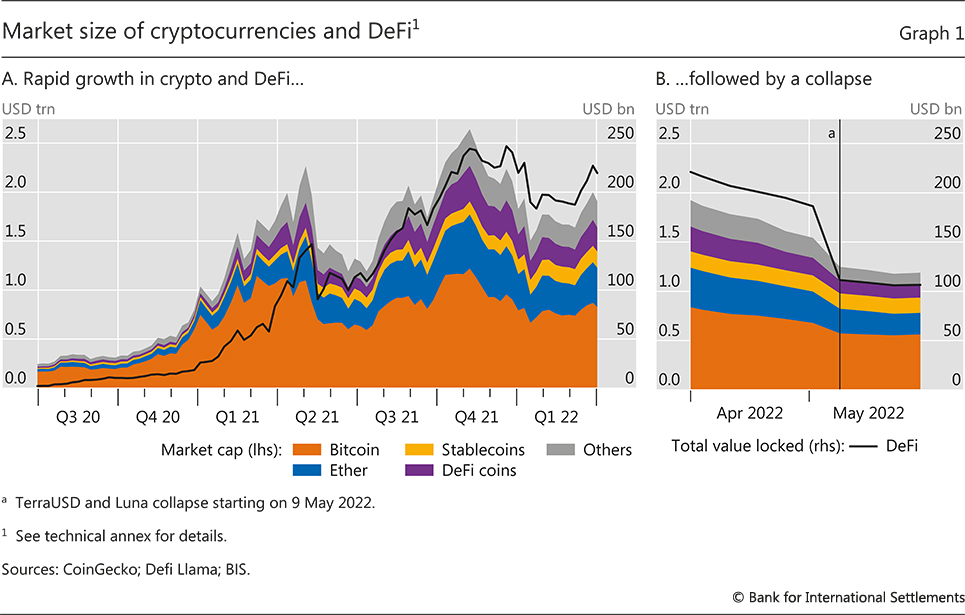
Graph 1
Market size of cryptocurrencies and DeFi
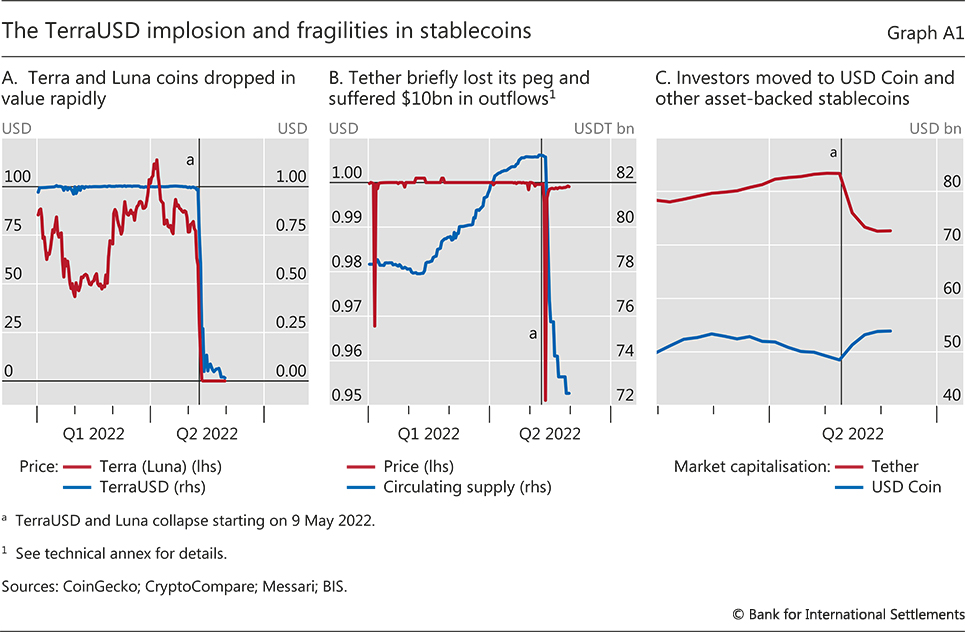
Graph A1
The TerraUSD implosion and fragilities in stablecoins
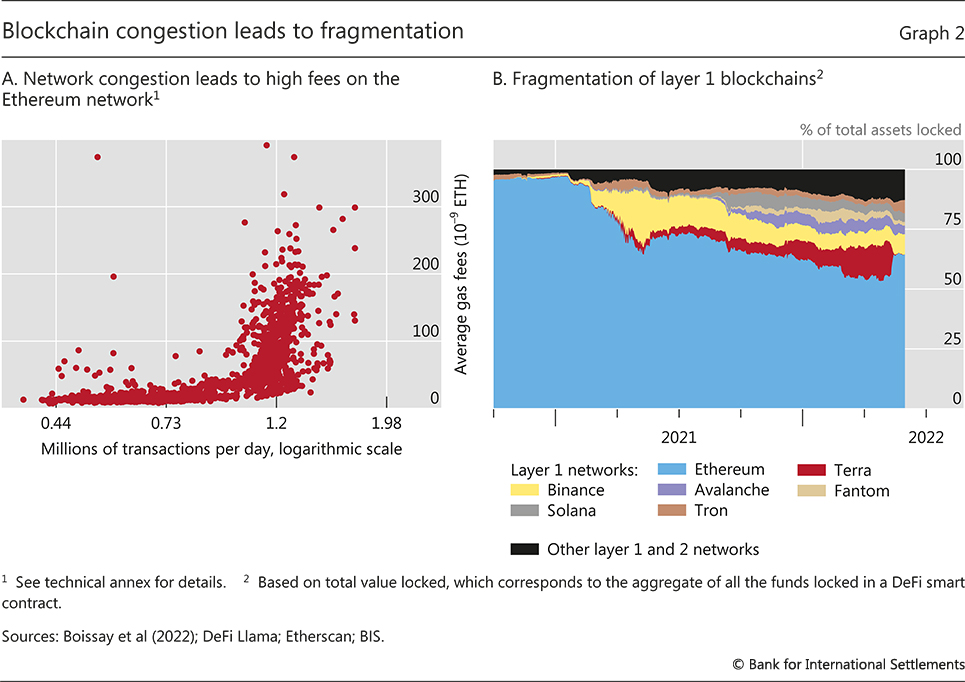
Graph 2
Blockchain congestion leads to fragmentation
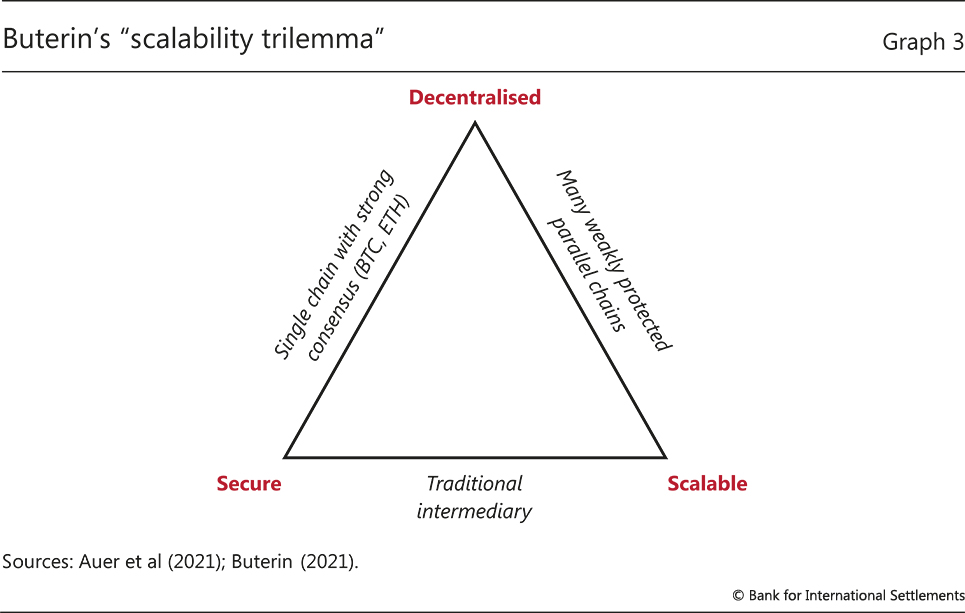
Graph 3
Buterin's "scalablity trilemma"
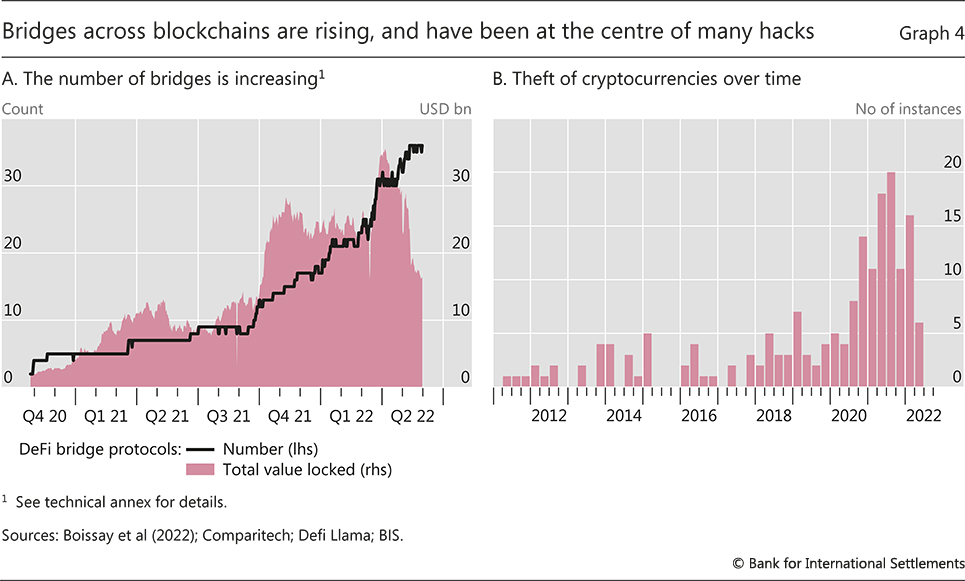
Graph 4
Bridges across blockchains are rising, and have been at the centre of many hacks
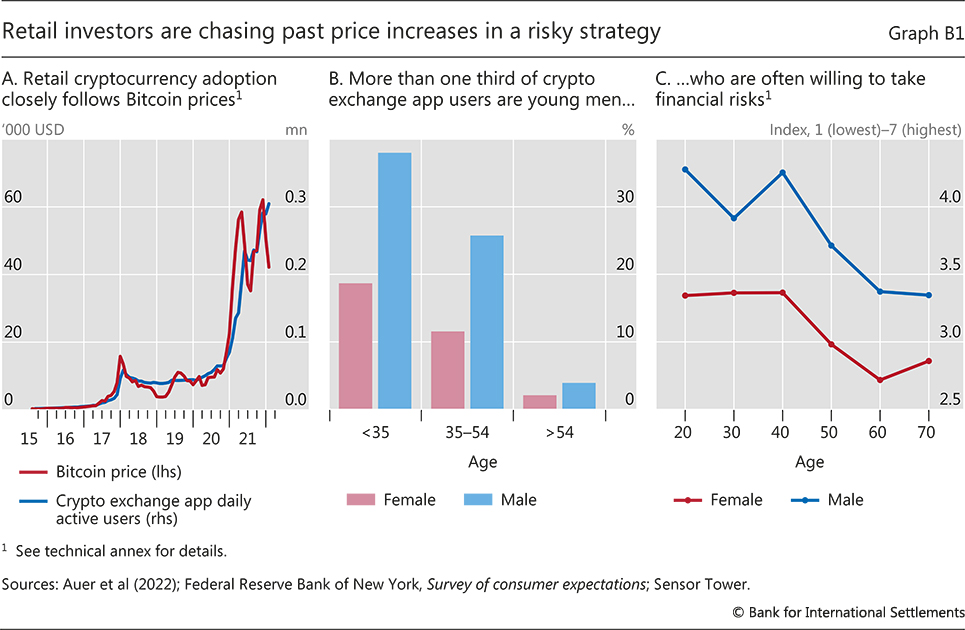
Graph B1
Retail investors are chasing past price increases in a risky strategy
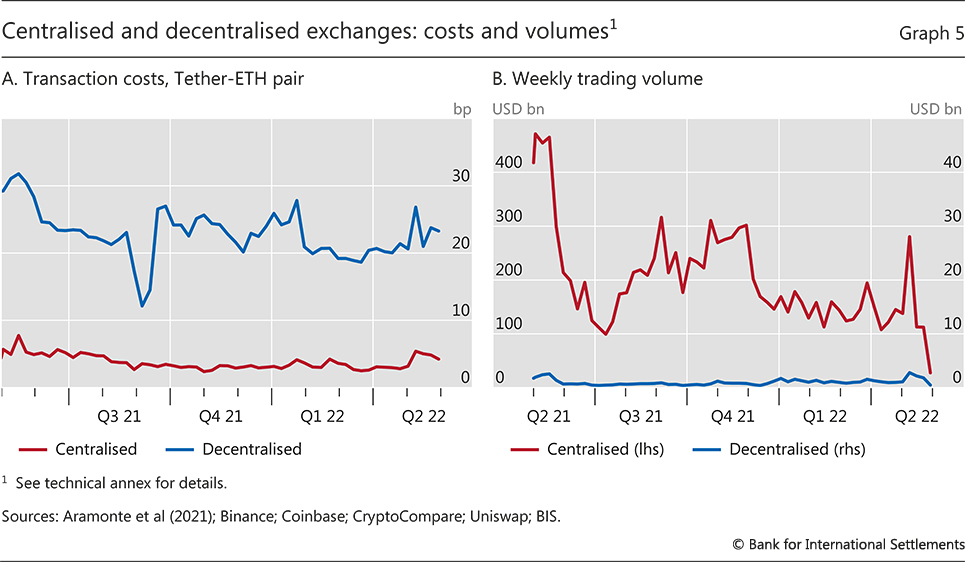
Graph 5
Centralised and decentralised exchanges: costs and volumes
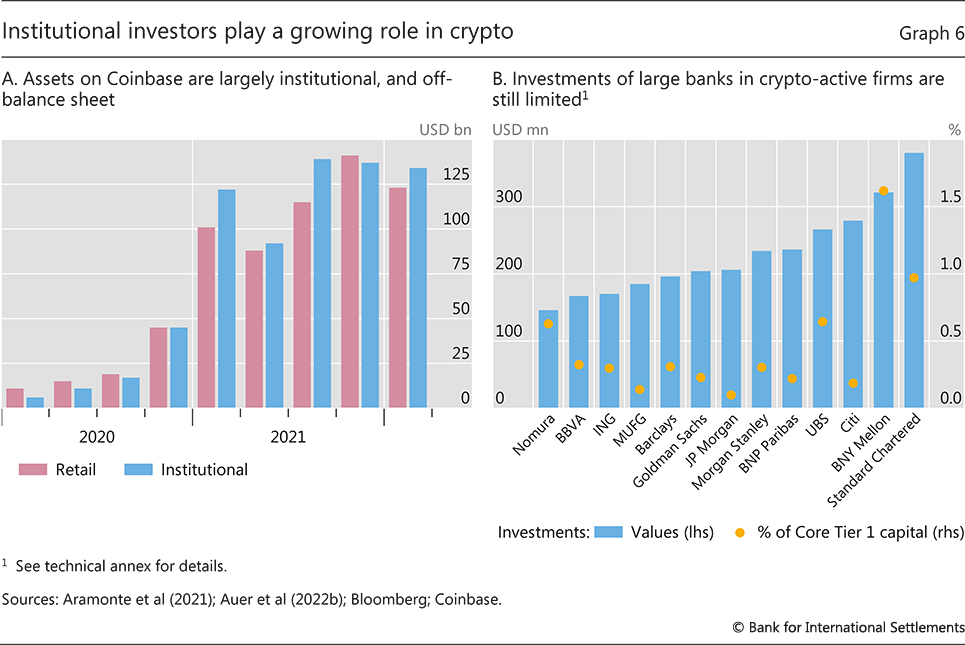
Graph 6
Institutional investors play a growing role in crypto
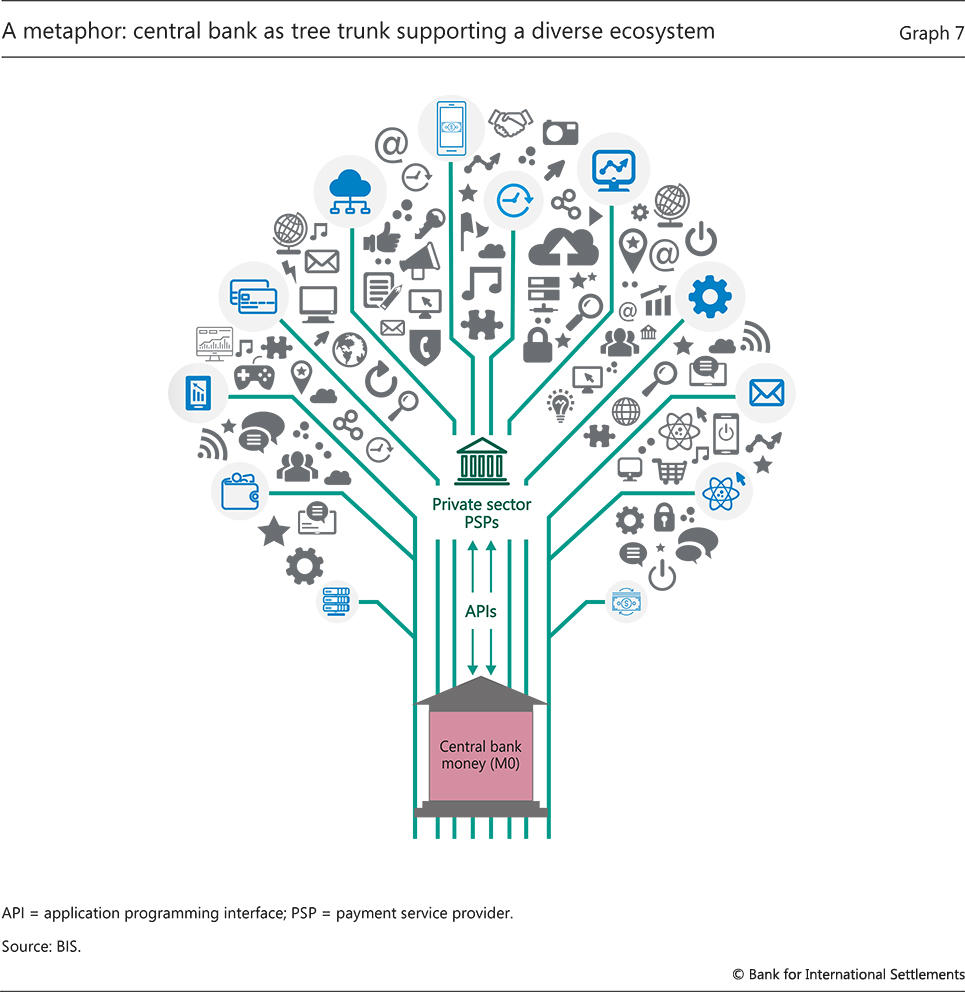
Graph 7
A metaphor: central bank as tree trunk supporting a diverse ecosystem
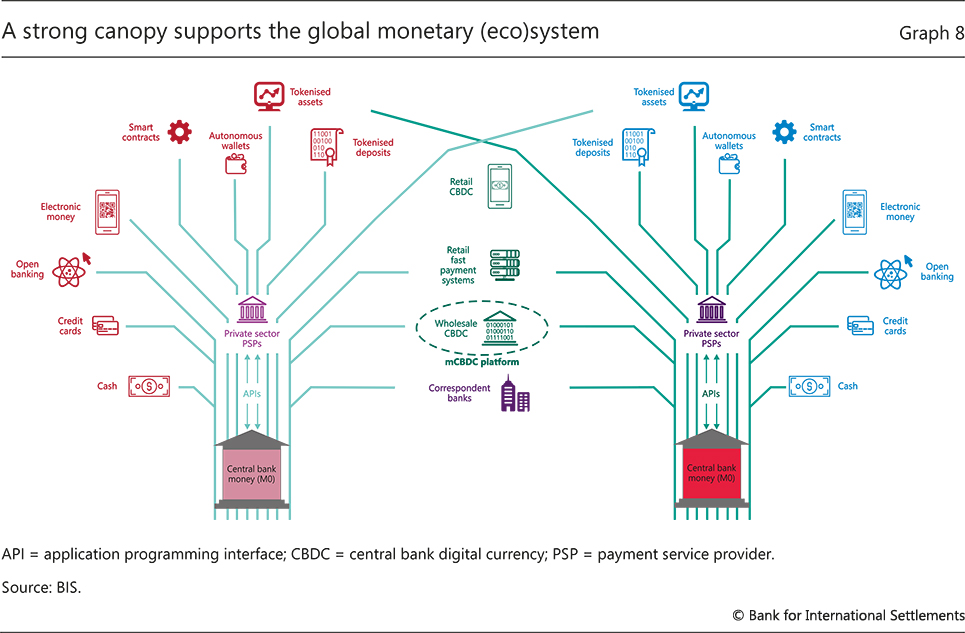
Graph 8
A strong canopy supports the global monetary (eco)system
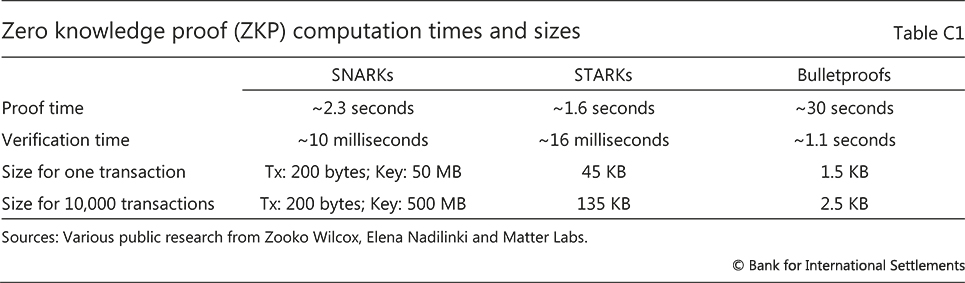
Table C1
Zero knowledge proof (ZKP) computation times and sizes
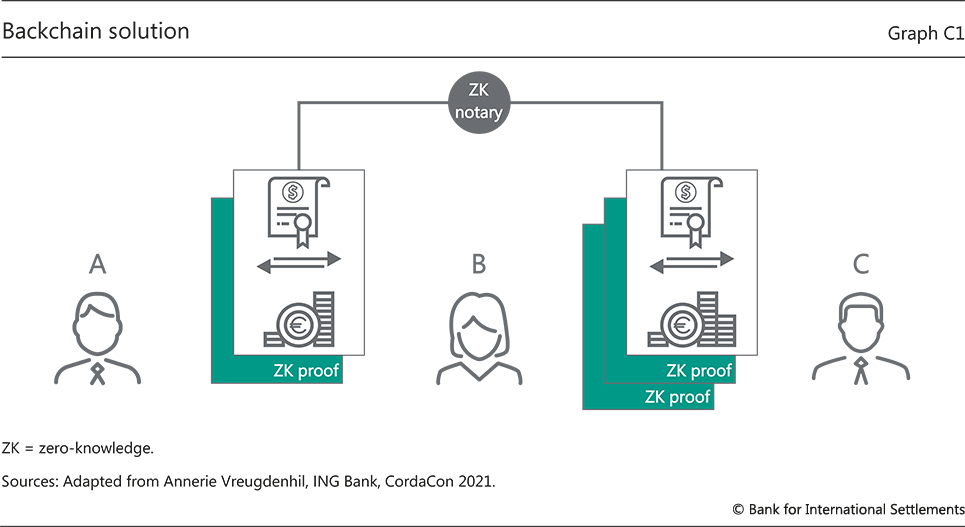
Graph C1
Backchain solution
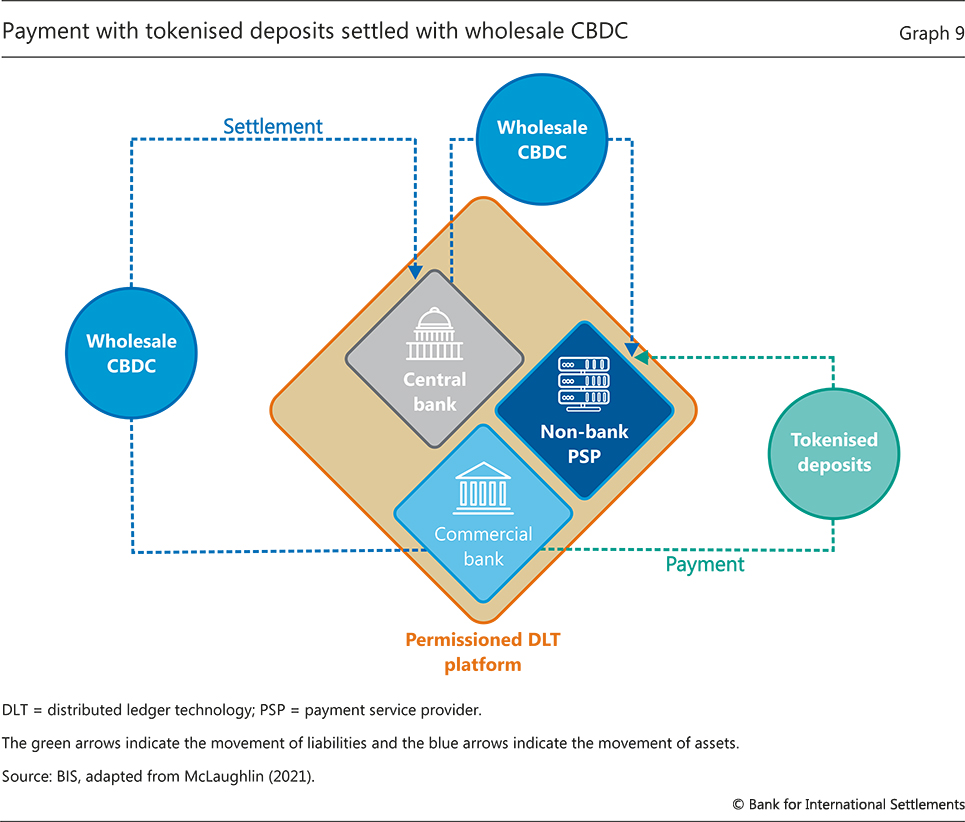
Graph 9
Payment with tokenised deposits settled with wholesale CBDC
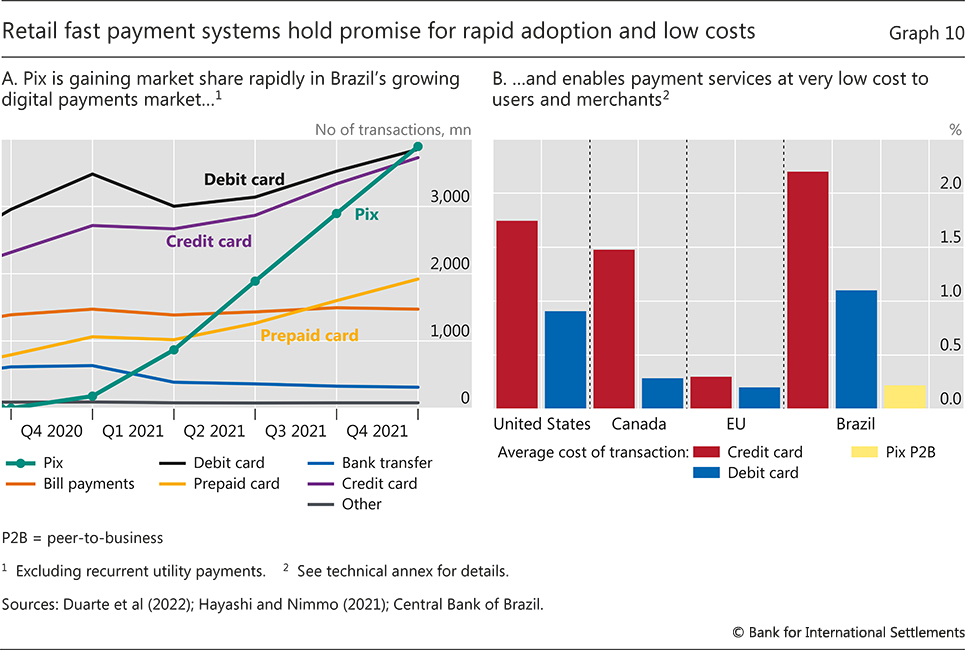
Graph 10
Retail fast payment systems hold promise for rapid adoption and low costs
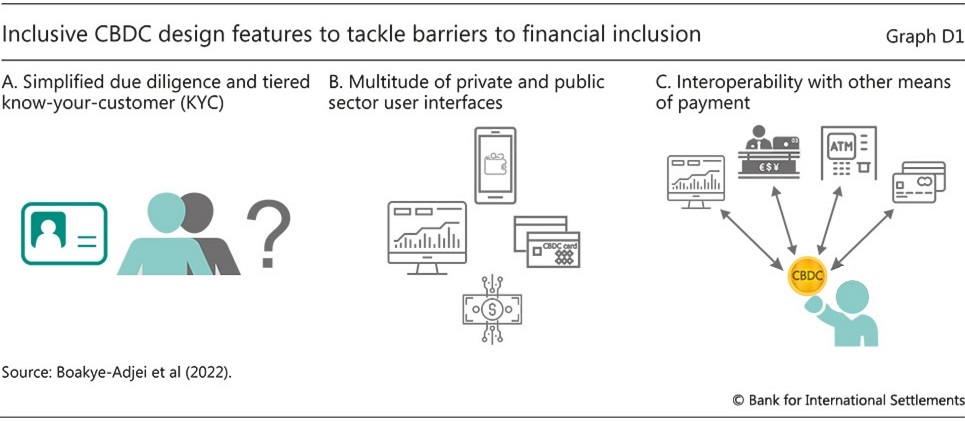
Graph D1
Inclusive CBDC design features to tackle barriers to financial inclusion
Related information
Annual
Economic Report 2022
Top
Share this page