Annual Economic Report 2018 - Statistics associated with the graphs
Series description is to be found in the corresponding graph, that is linked in the right side column.
Download all statistics (zipped XLSX, 1.300 MB).
Graphs |
||
| Editorial: data behind the graph (xlsx) | ||
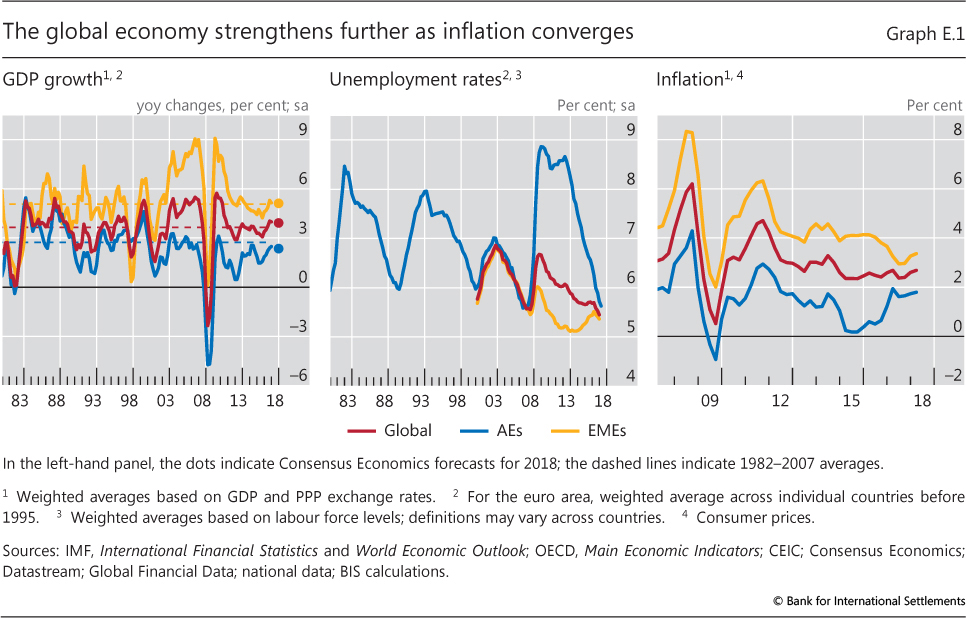
| E.1 | The global economy strengthens further as inflation converges | p x |
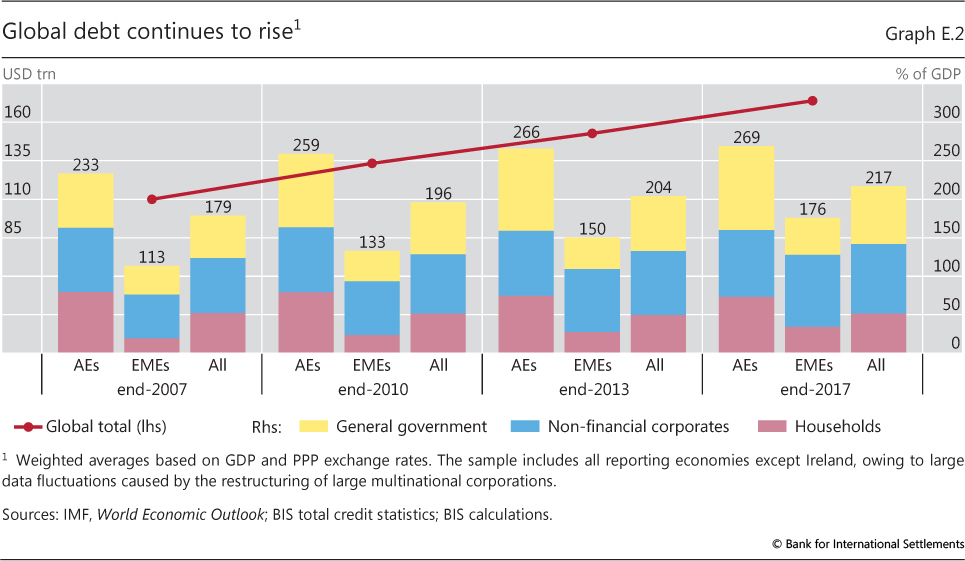
| E.2 | Global debt continues to rise | p xi |
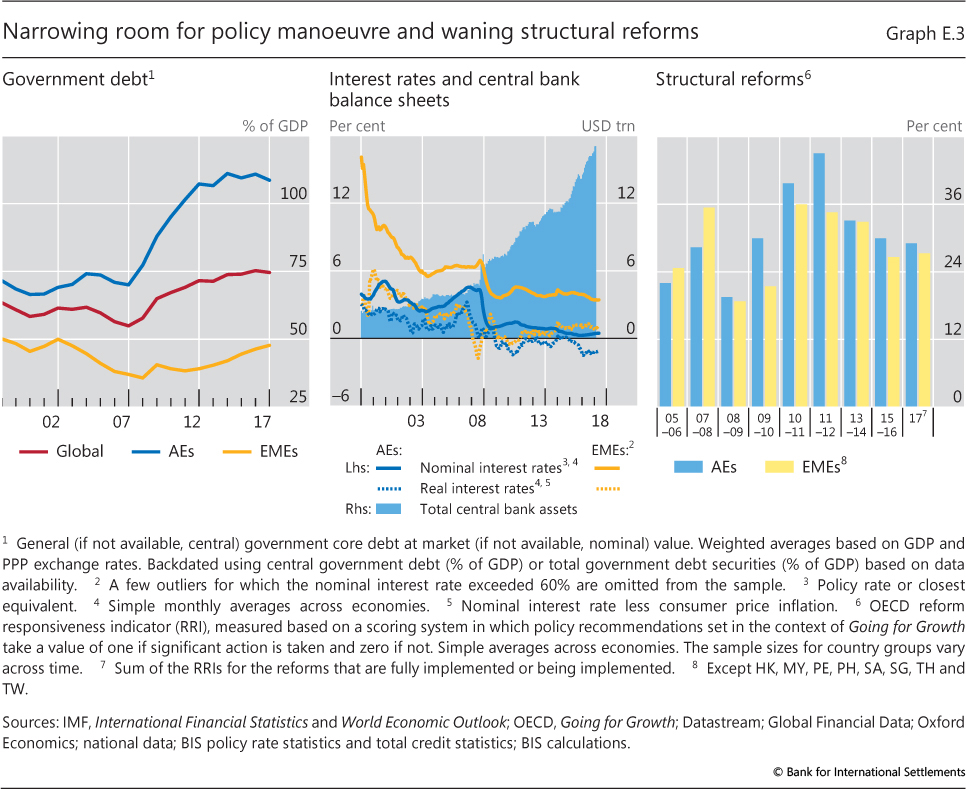
| E.3 | Narrowing room for policy manoeuvre and waning structural reforms | p xiv |
| Chapter I: data behind the graph (xlsx) | ||
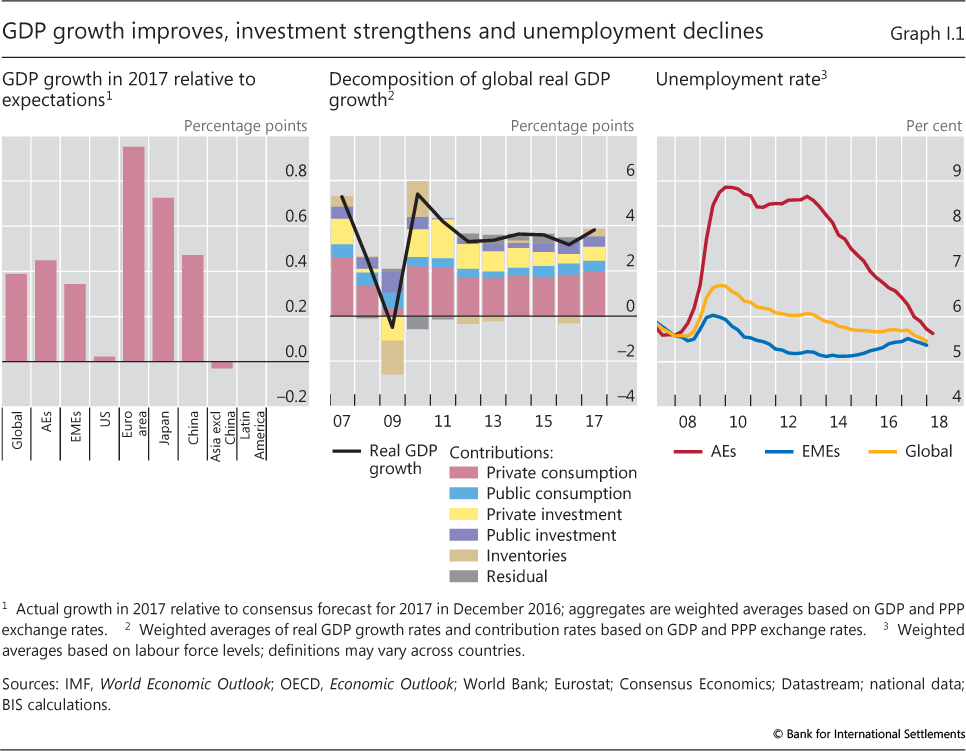
| I.1 | GDP growth improves, investment strengthens and unemployment declines | p 2 |
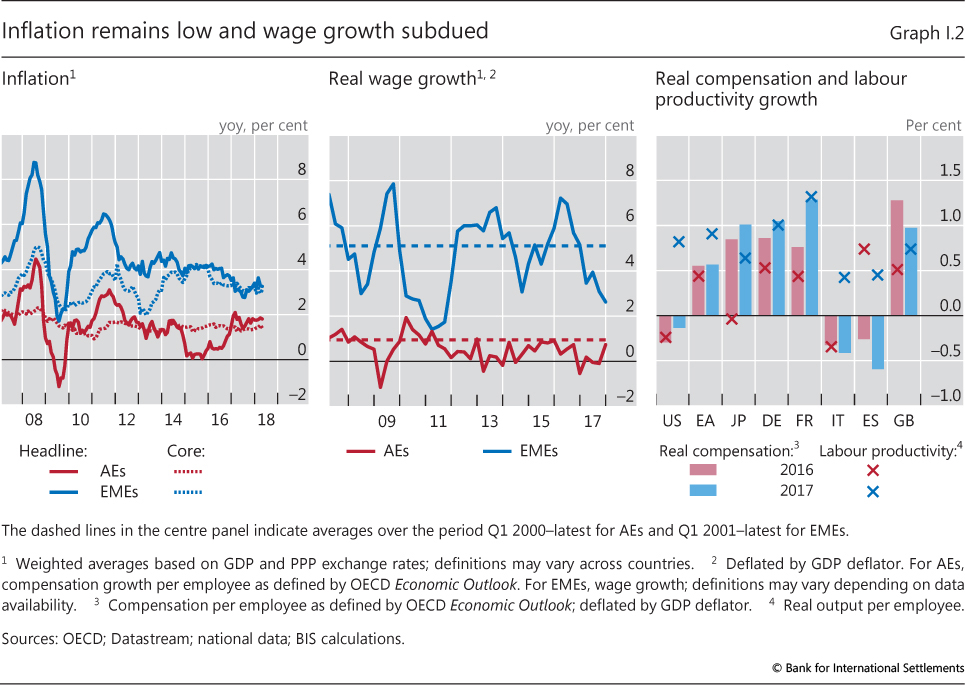
| I.2 | Inflation remains low and wage growth subdued | p 3 |
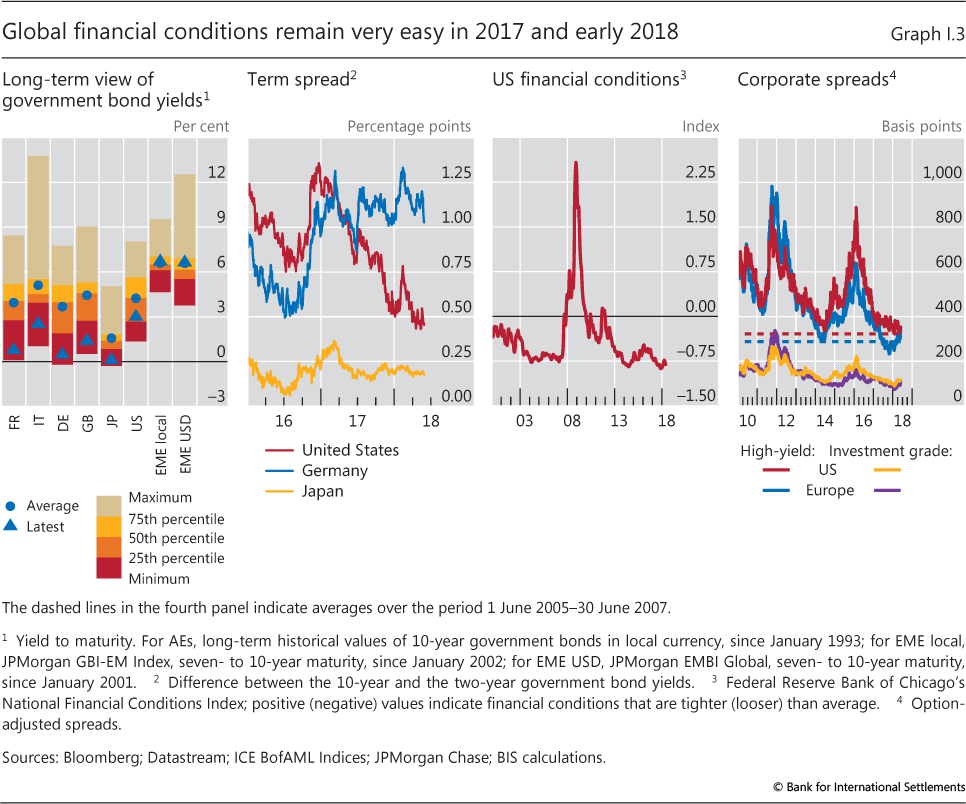
| I.3 | Global financial conditions remain very easy in 2018 and early 2018 | p 5 |
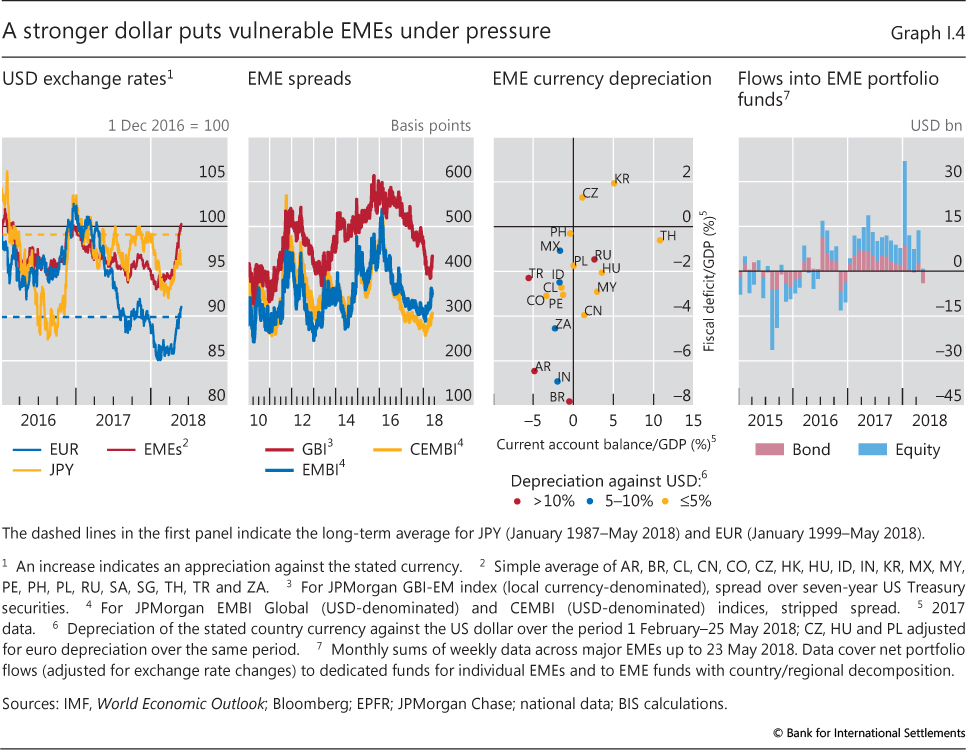
| I.4 | A stronger dollar puts vulnerable EMEs under pressure | p 6 |
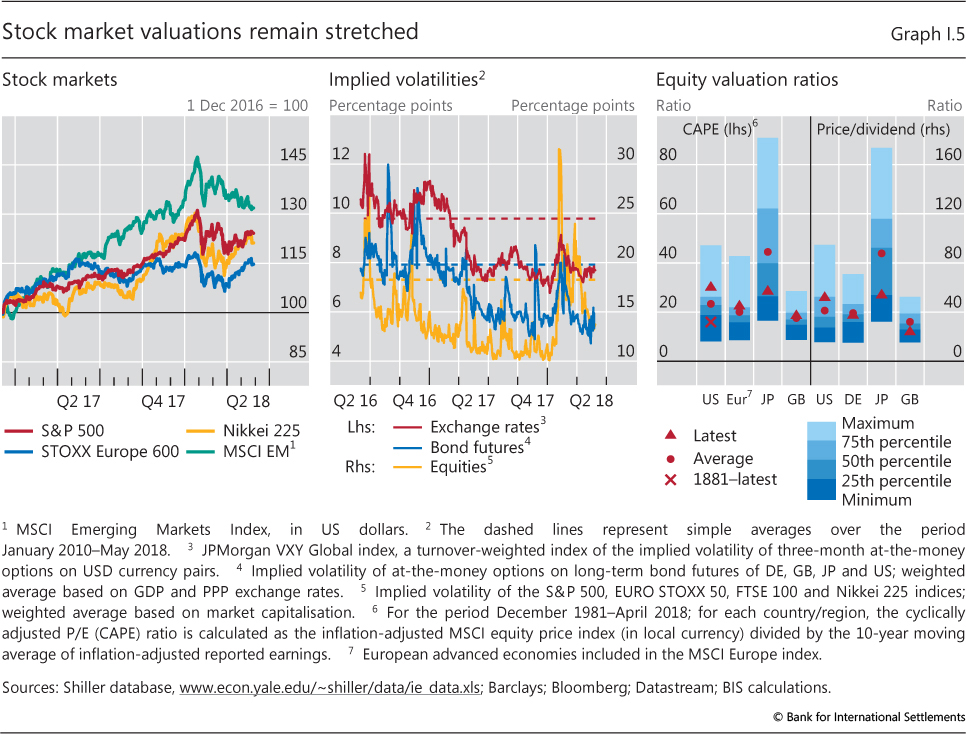
| I.5 | Stock market valuations remain stretched | p 7 |
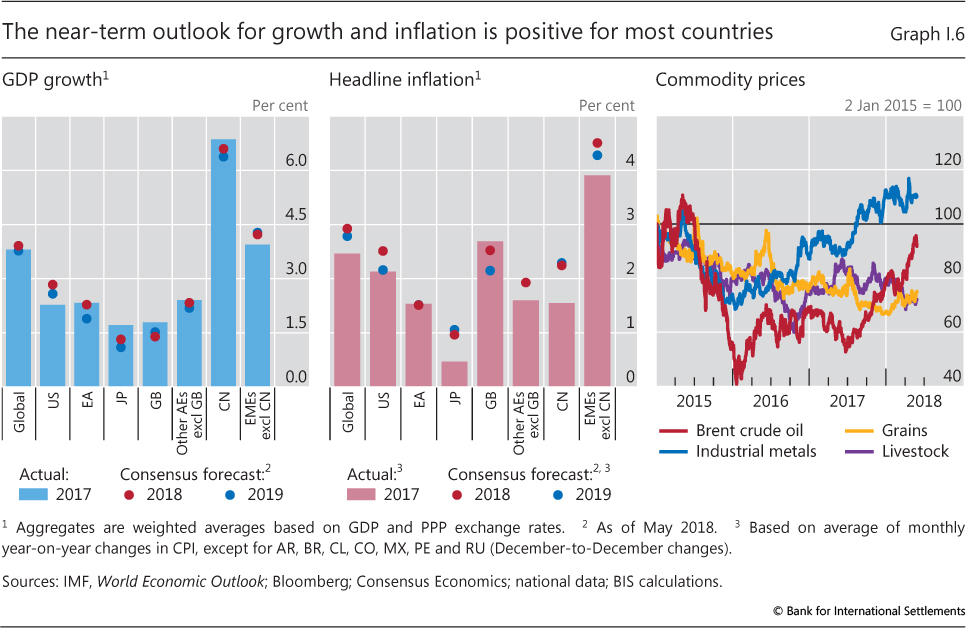
| I.6 | The near-term outlook for growth and inflation is positive for most countries | p 8 |
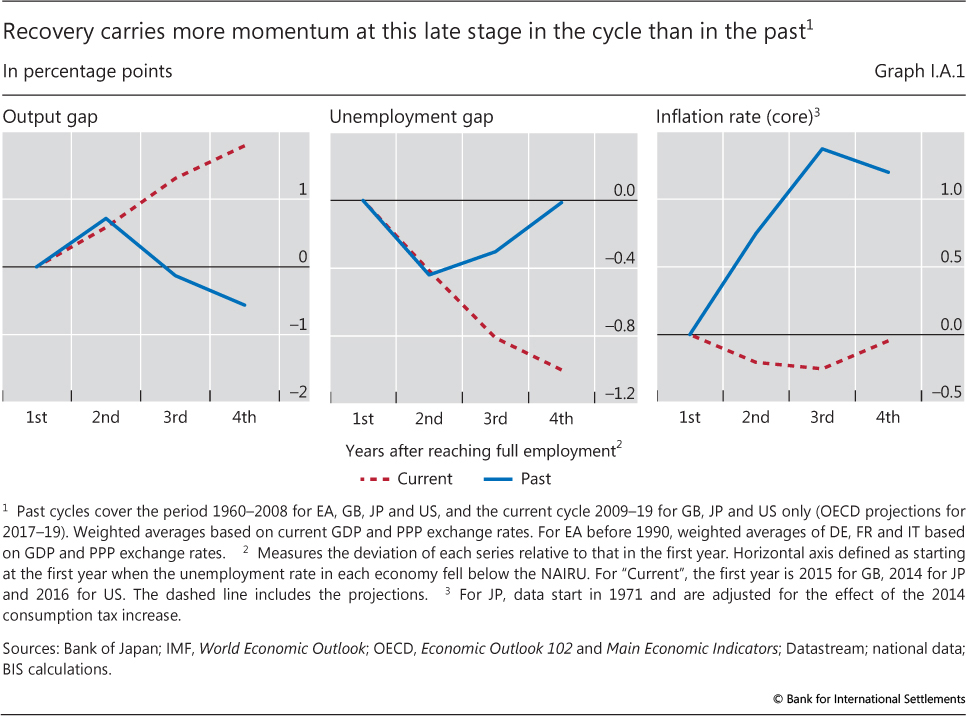
| I.A.1 | Recovery carries more momentum at this late stage in the cycle than in the past | p 10 |
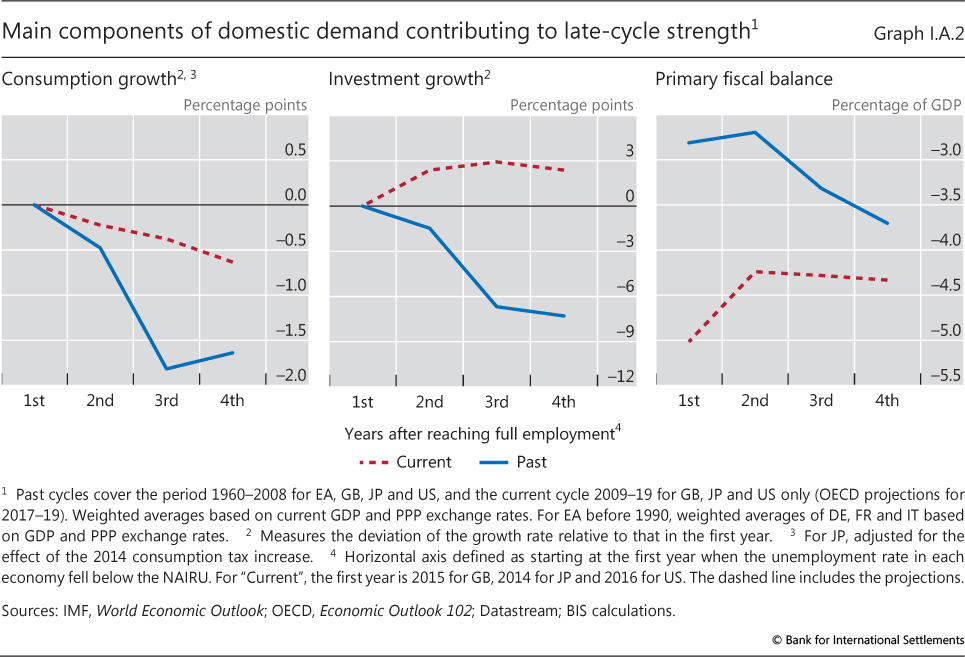
| I.A.2 | Main components of domestic demand contributing to late-cycle strength | p 11 |
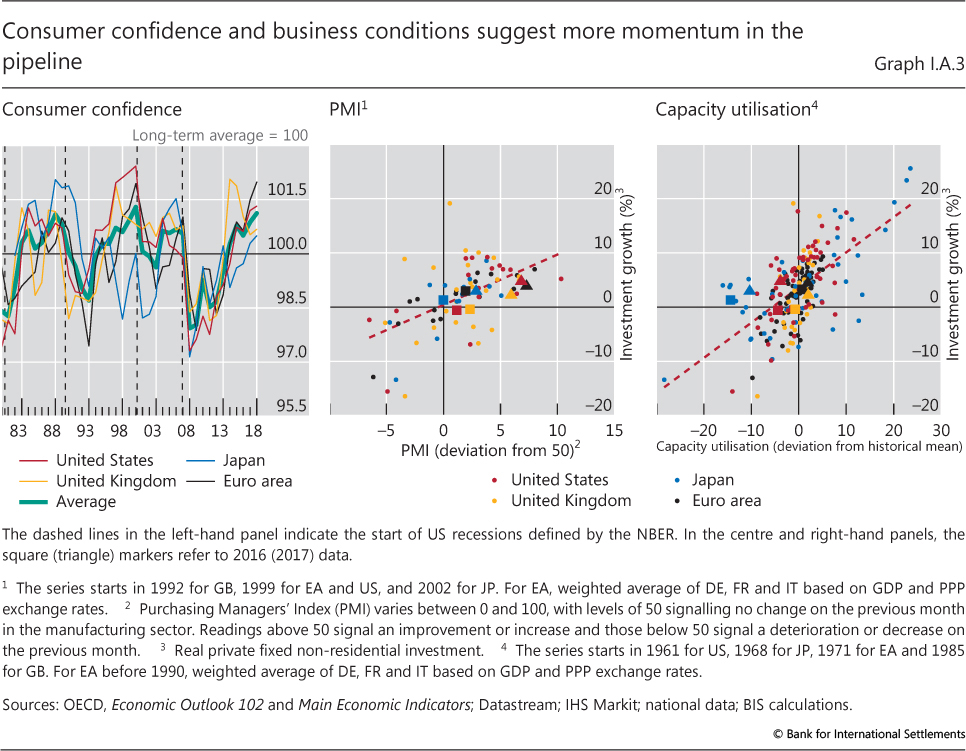
| I.A.3 | Consumer confidence and business conditions suggest more momentum in the pipeline | p 11 |
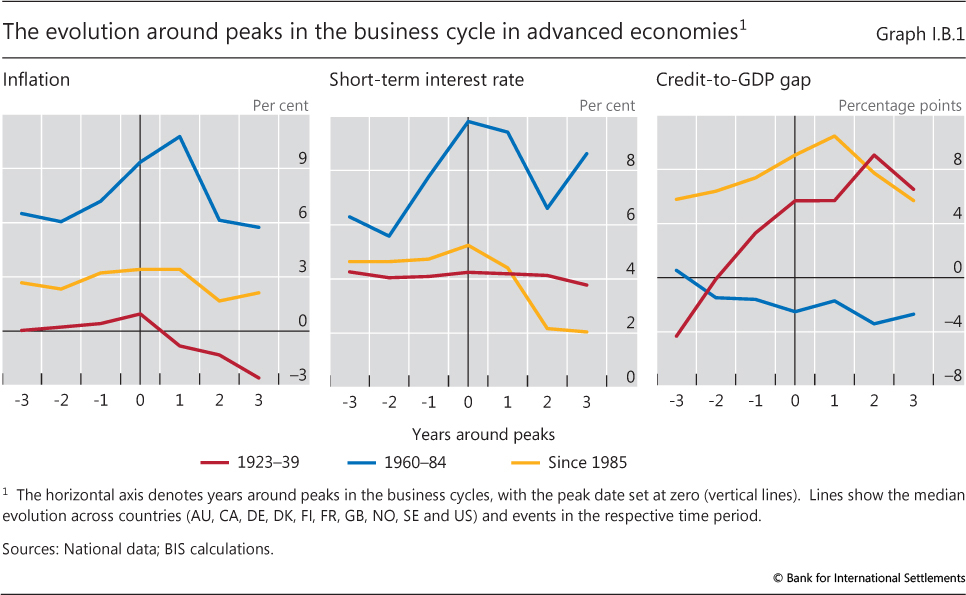
| I.B.1 | The evolution around peaks in the business cycle in advanced economies | p 14 |
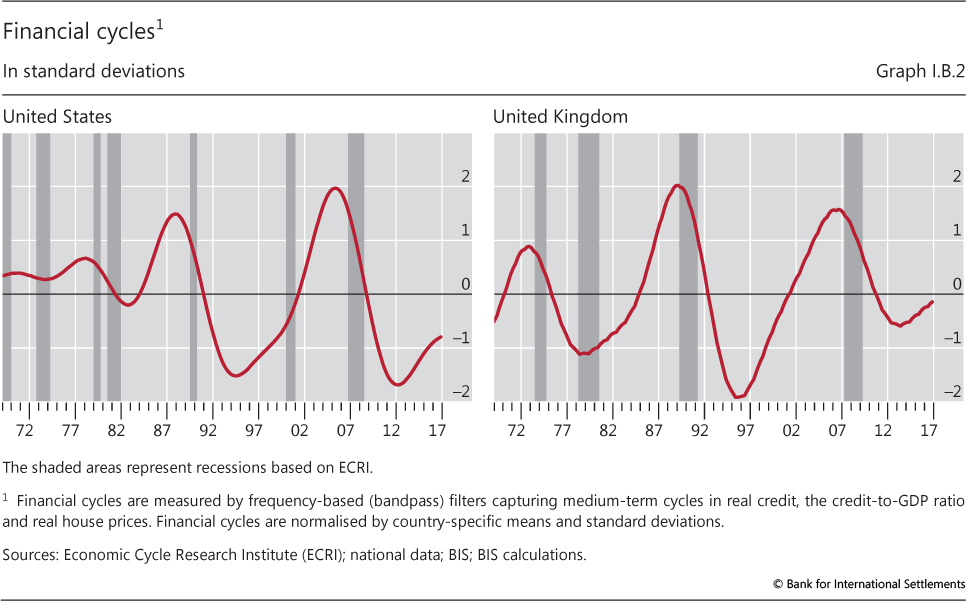
| I.B.2 | Financial cycles | p 15 |
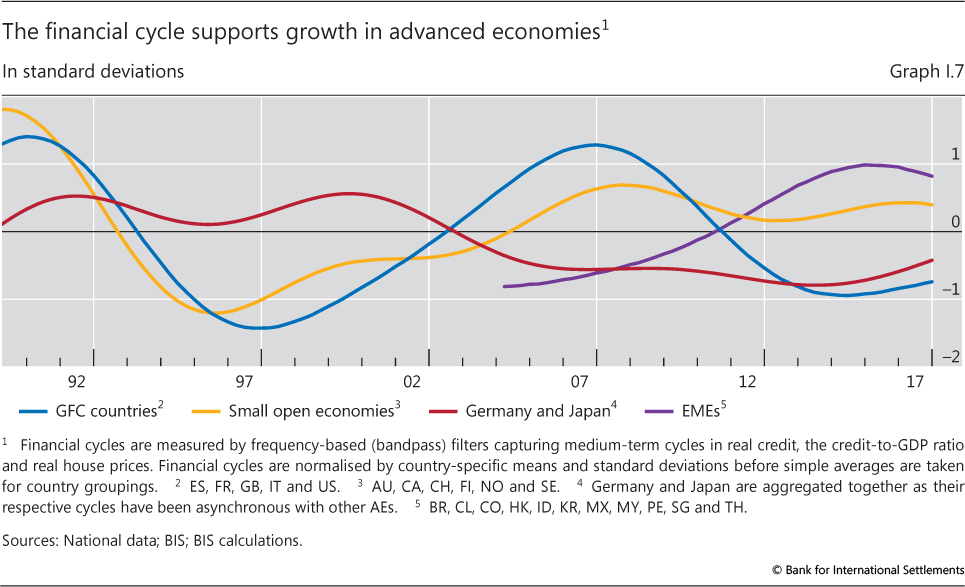
| I.7 | The financial cycle supports growth in advanced economies | p 16 |
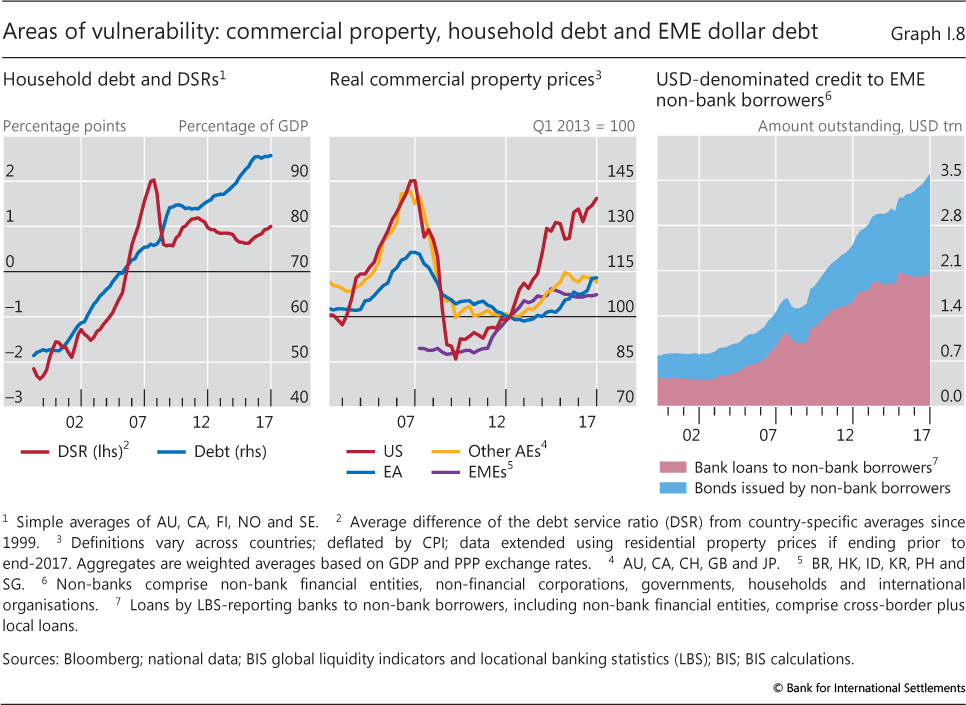
| I.8 | Areas of vulnerability: commercial property, household debt and EME dollar debt | p 17 |
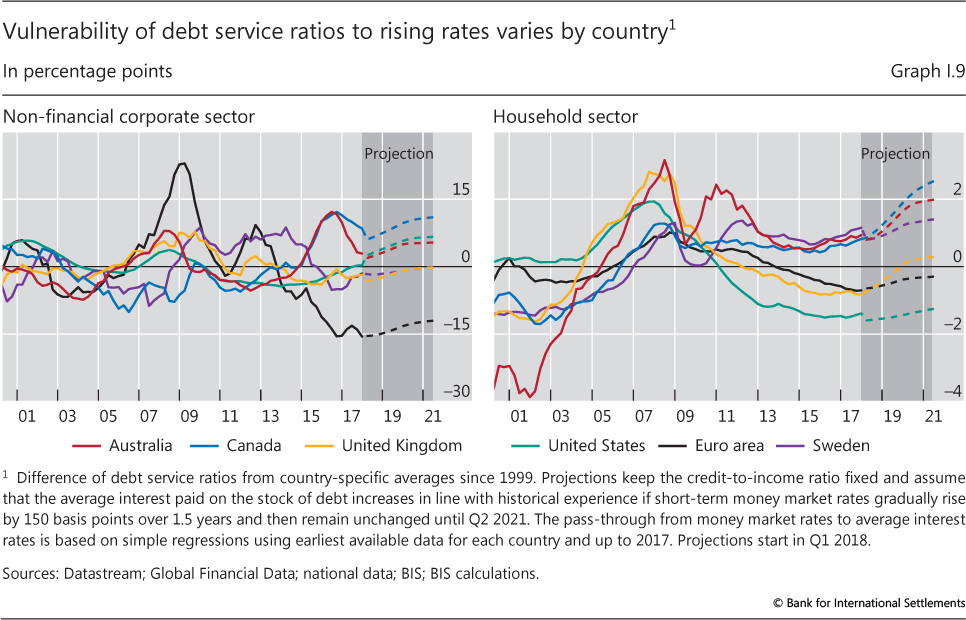
| I.9 | Vulnerability of debt service ratios to rising rates varies by country | p 19 |
| Chapter II: data behind the graphs (xlsx) | ||
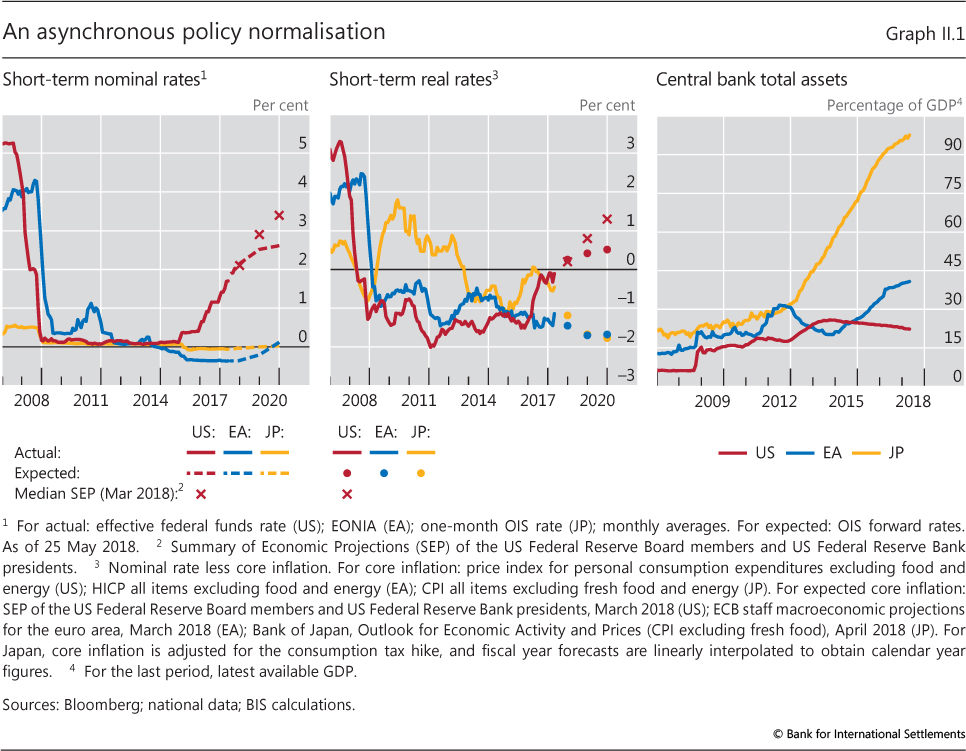
| II.1 | An asynchronous policy normalisation | p 26 |
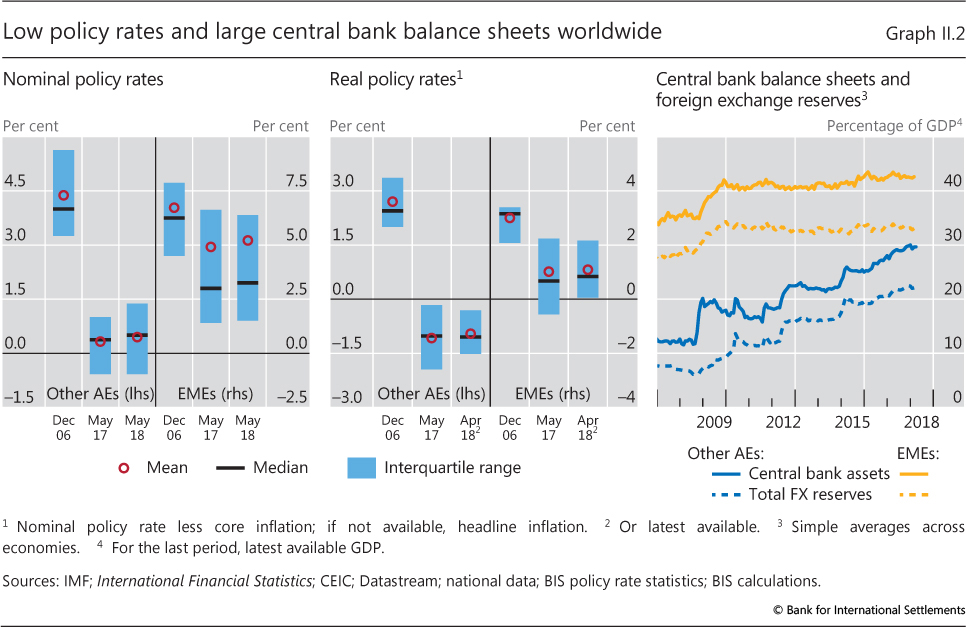
| II.2 | Low policy rates and large central bank balance sheets worldwide | p 27 |
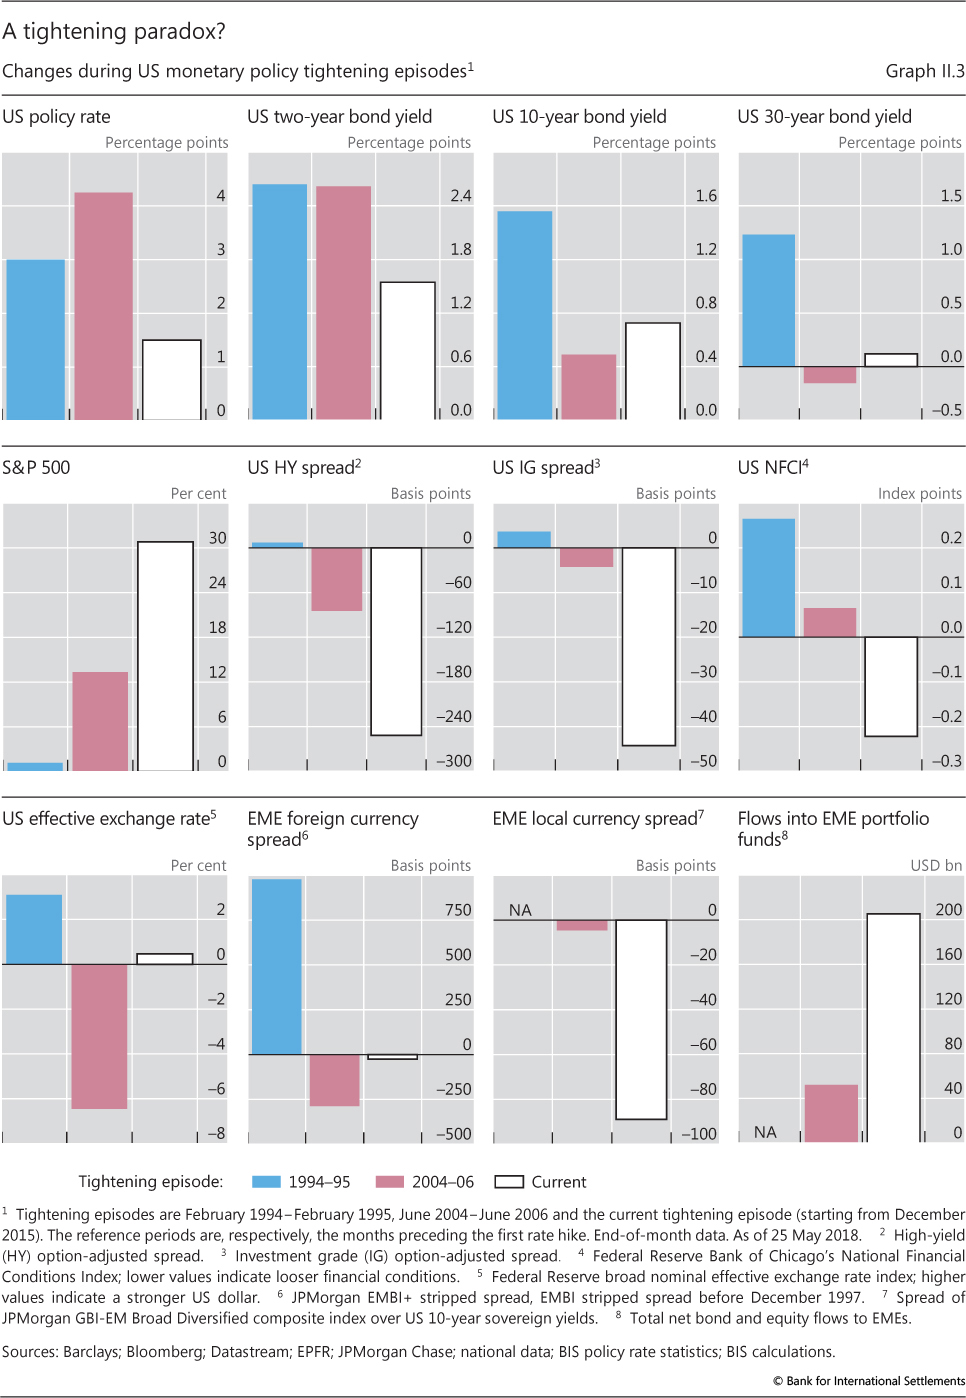
| II.3 | A tightening paradox? | p 29 |
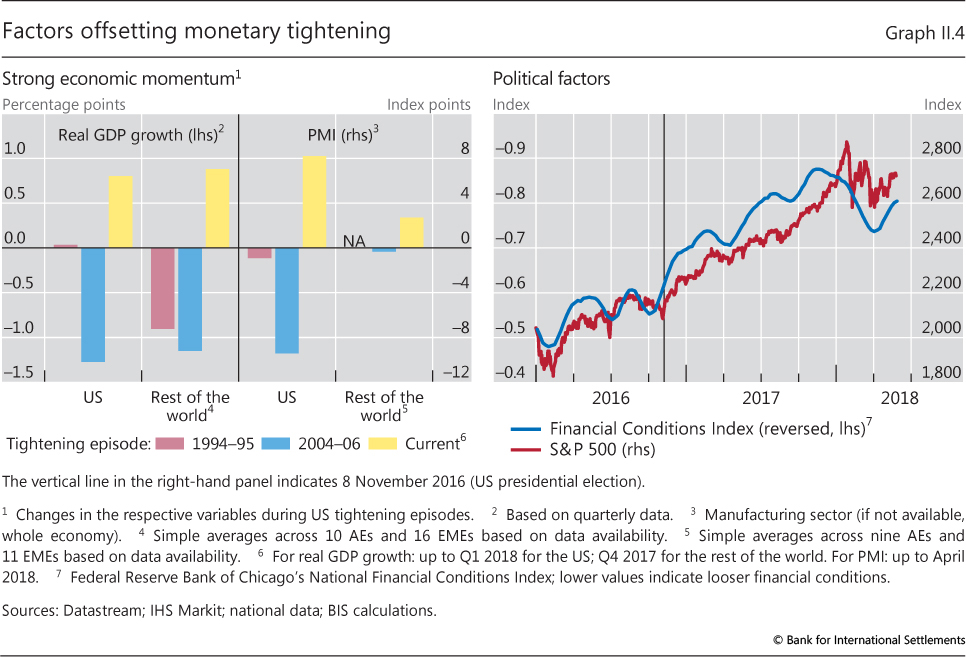
| II.4 | Factors offsetting monetary tightening | p 30 |
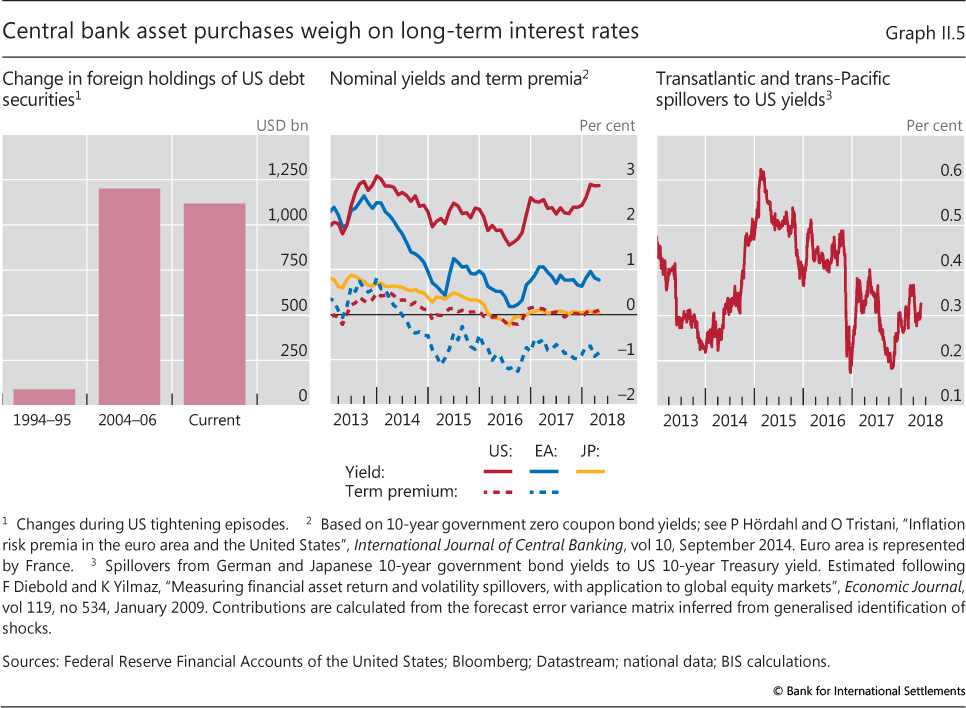
| II.5 | Central bank asset purchases weigh on long-term interest rates | p 31 |
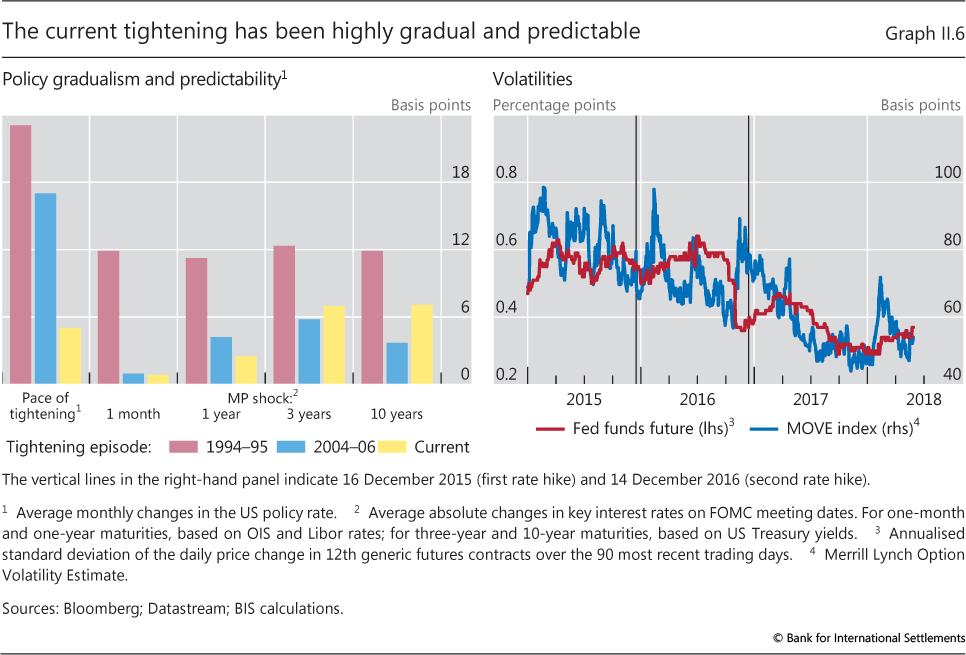
| II.6 | The current tightening has been highly gradual and predictable | p 32 |
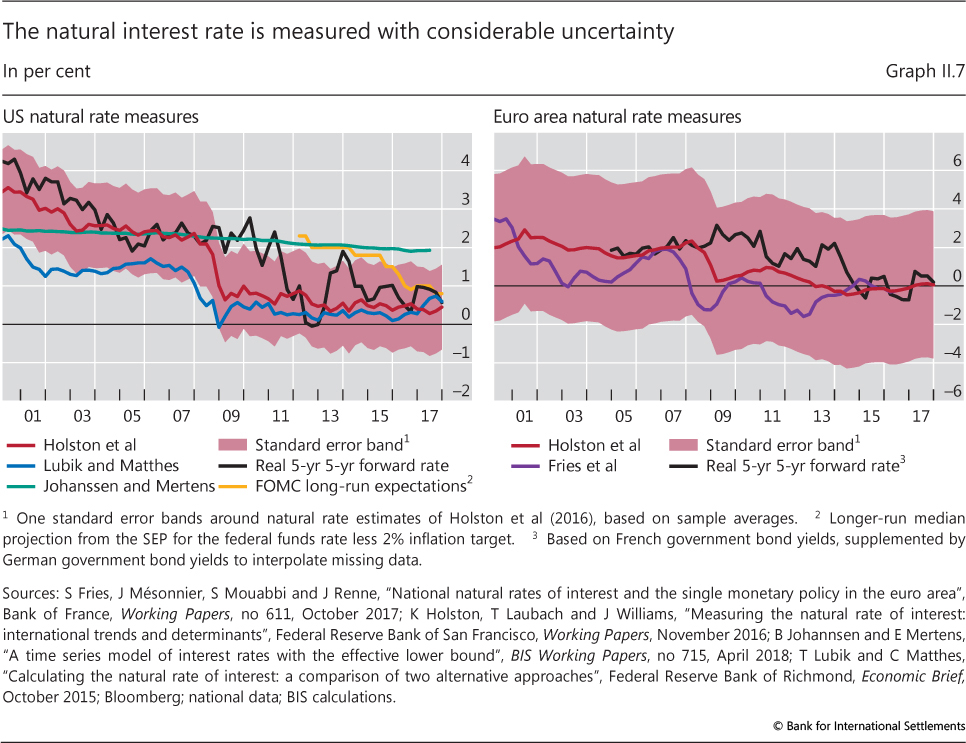
| II.7 | The natural interest rate is measured with considerable uncertainty | p 34 |
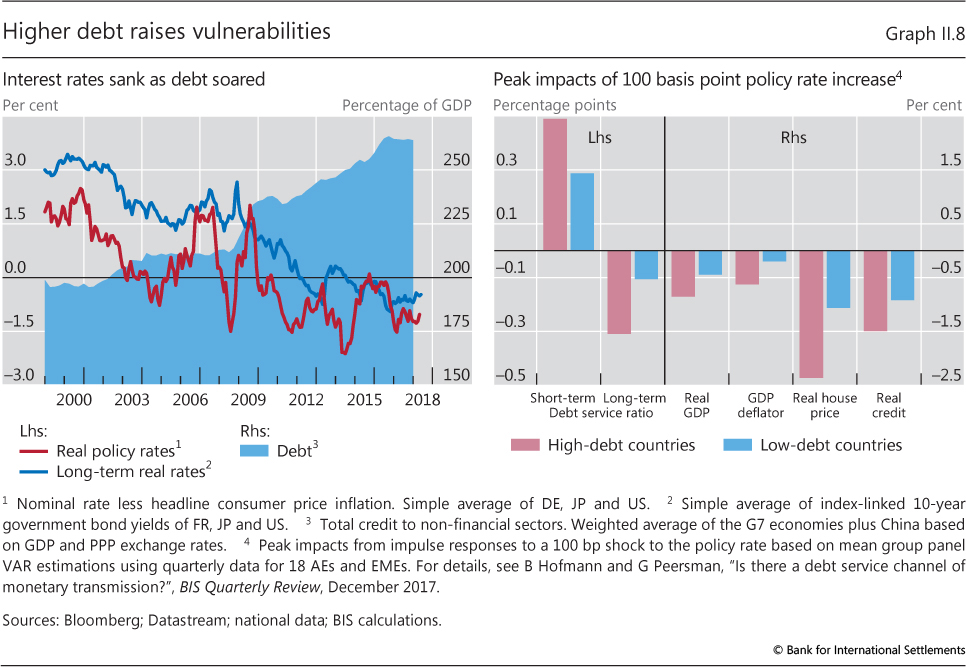
| II.8 | Higher debt raises vulnerabilities | p 35 |
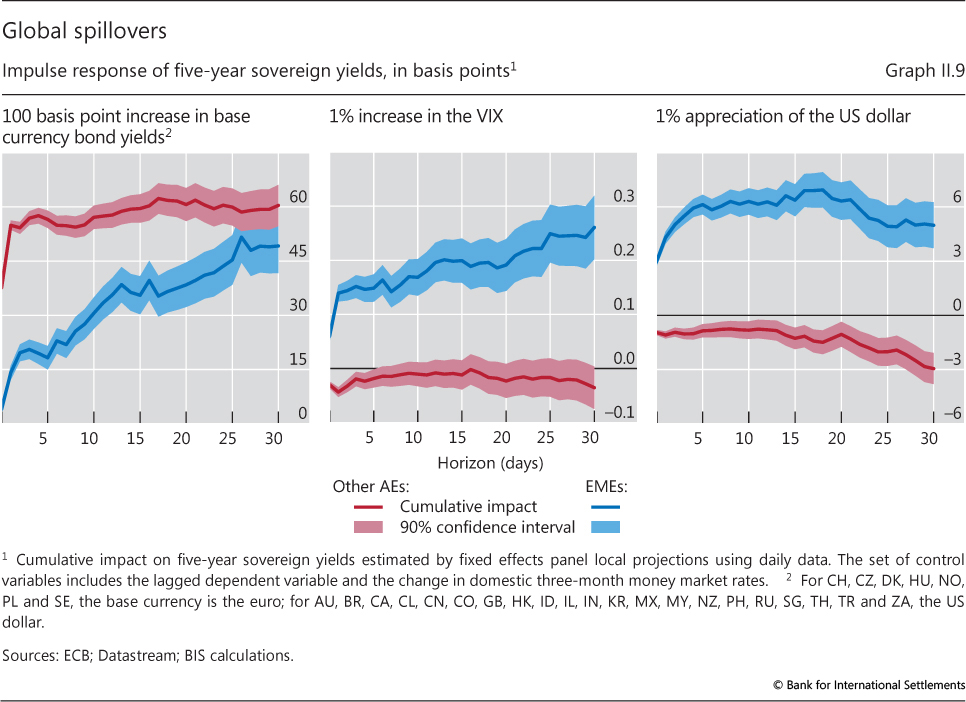
| II.9 | Global spillovers | p 36 |
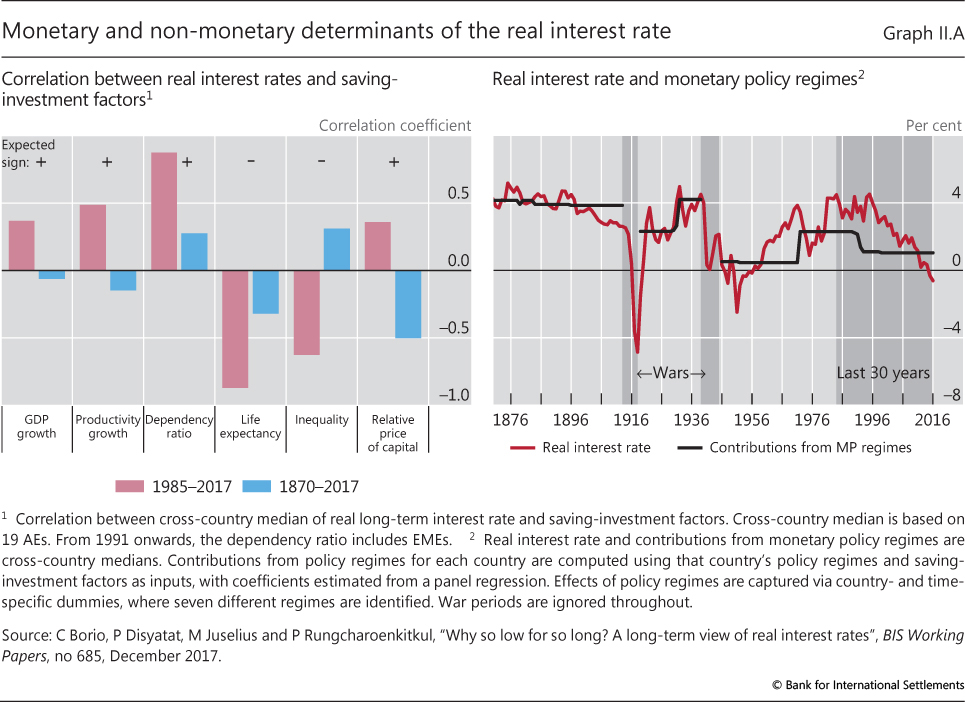
| II.A | Monetary and non-monetary determinants of the real interest rate | p 39 |
| Chapter III: data behind the graphs (xlsx) | ||
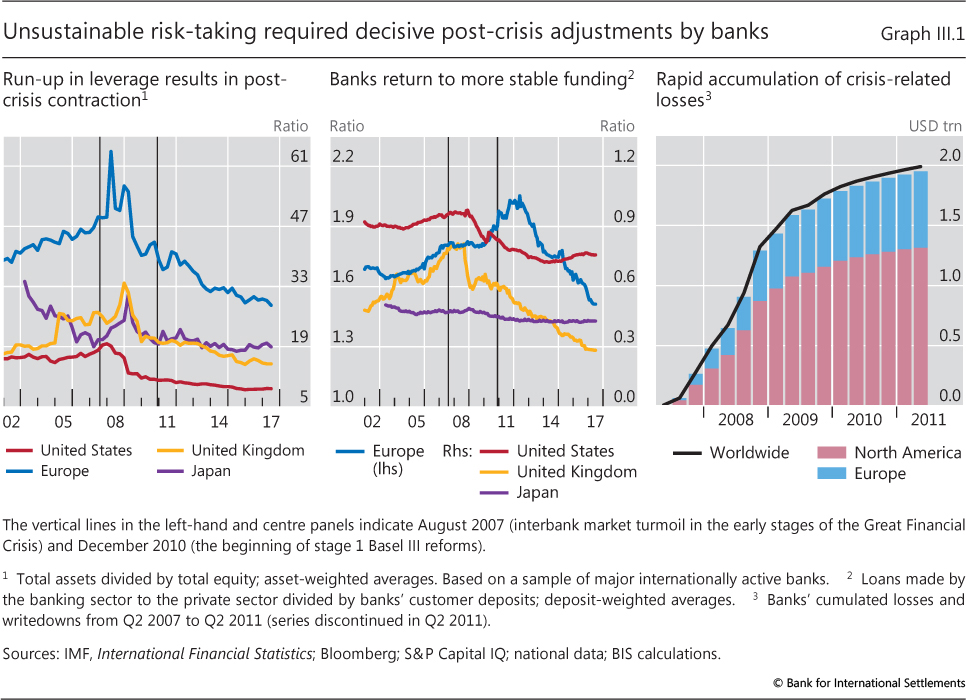
| III.1 | Unsustainable risk-taking required decisive post-crisis adjustments by banks | p 44 |
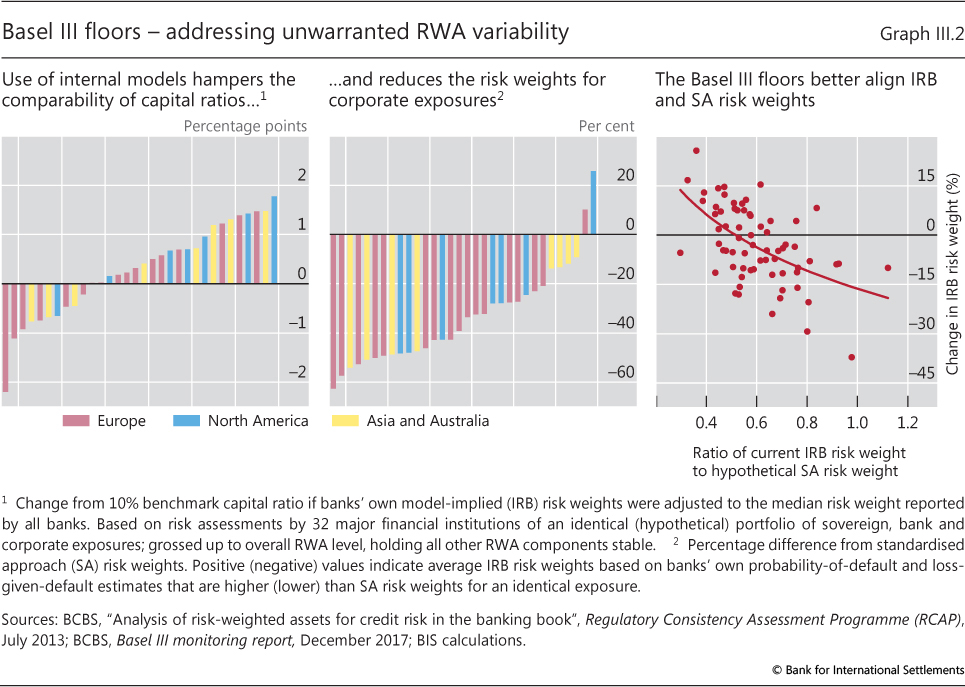
| III.2 | Basel III floors - addressing unwarranted RWA variability | p 46 |
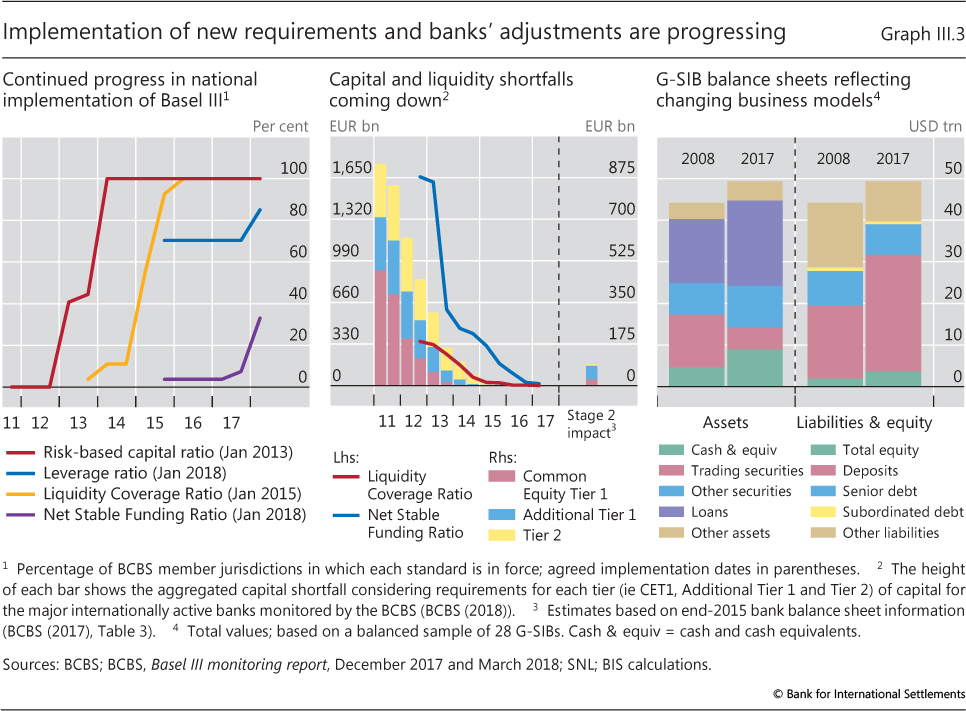
| III.3 | Implementation of new requirements and banks' adjustments are progressing | p 47 |
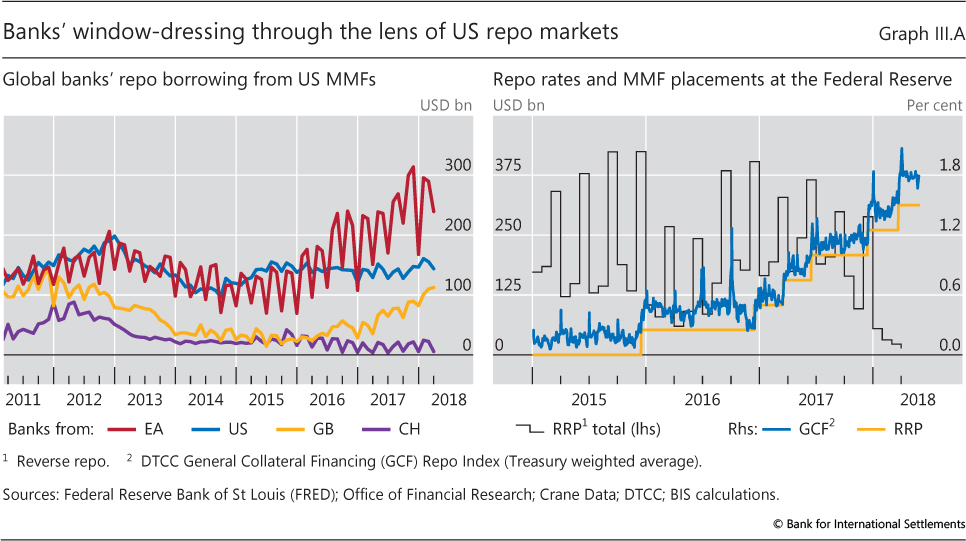
| III.A | Banks' window-dressing through the lens of US repo markets | p 49 |
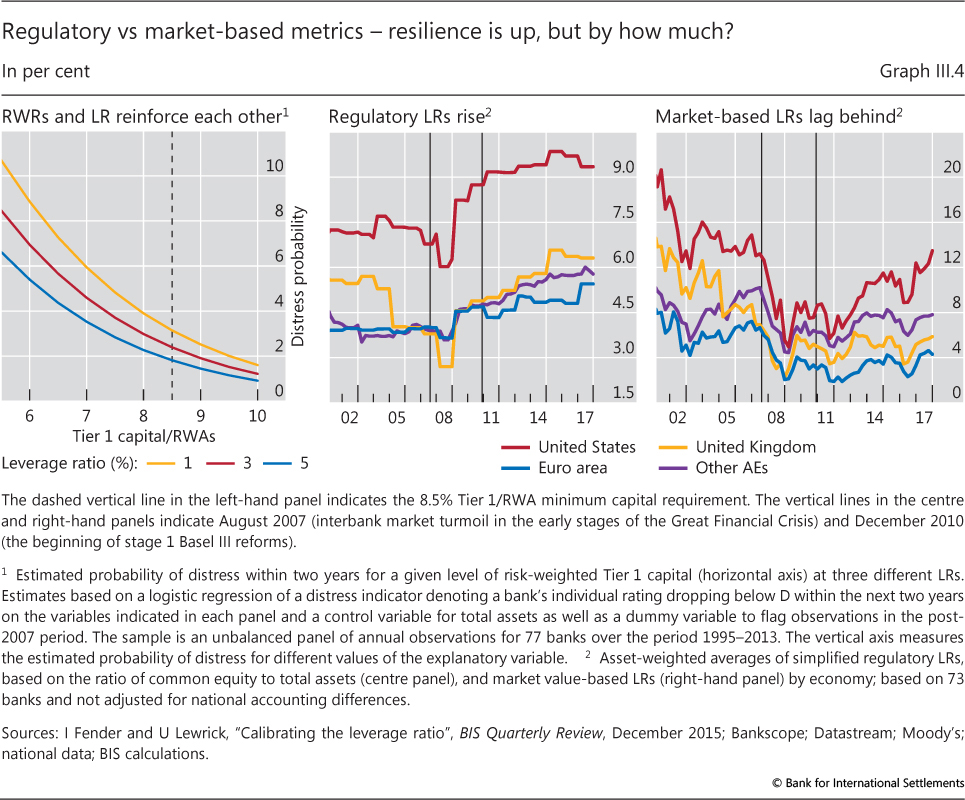
| III.4 | Regulatory vs market-based metrics - resilience is up, but by how much? | p 50 |
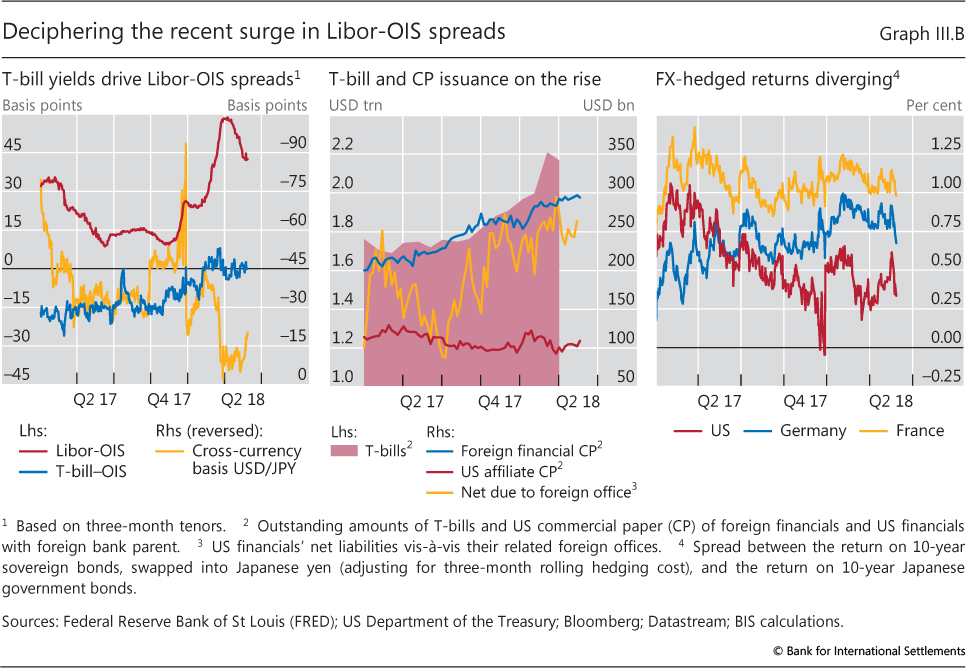
| III.B | Deciphering the recent surge in Libor-OIS spreads | p 51 |
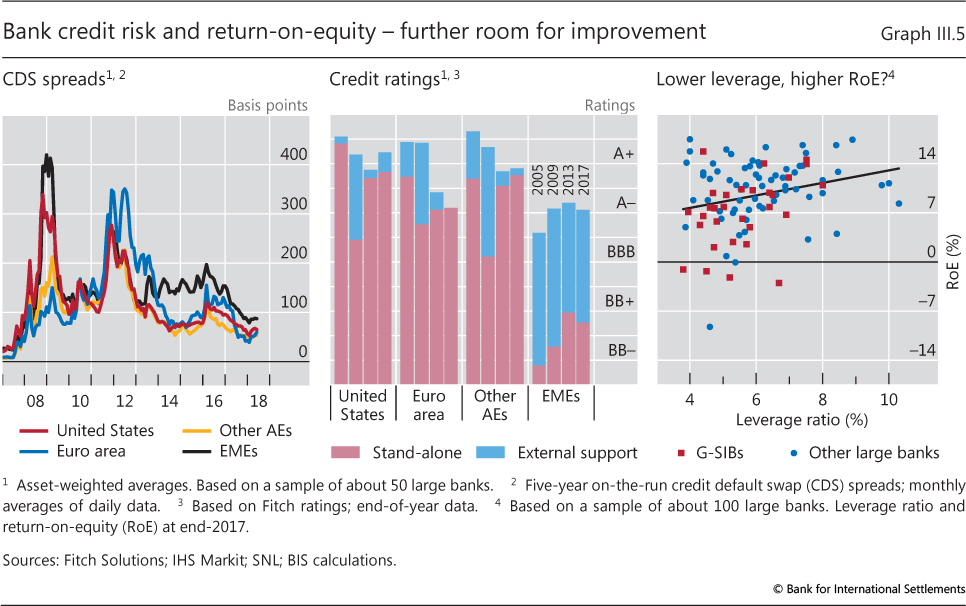
| III.5 | Bank credit risk and return-on-equity - further room for improvement | p 52 |
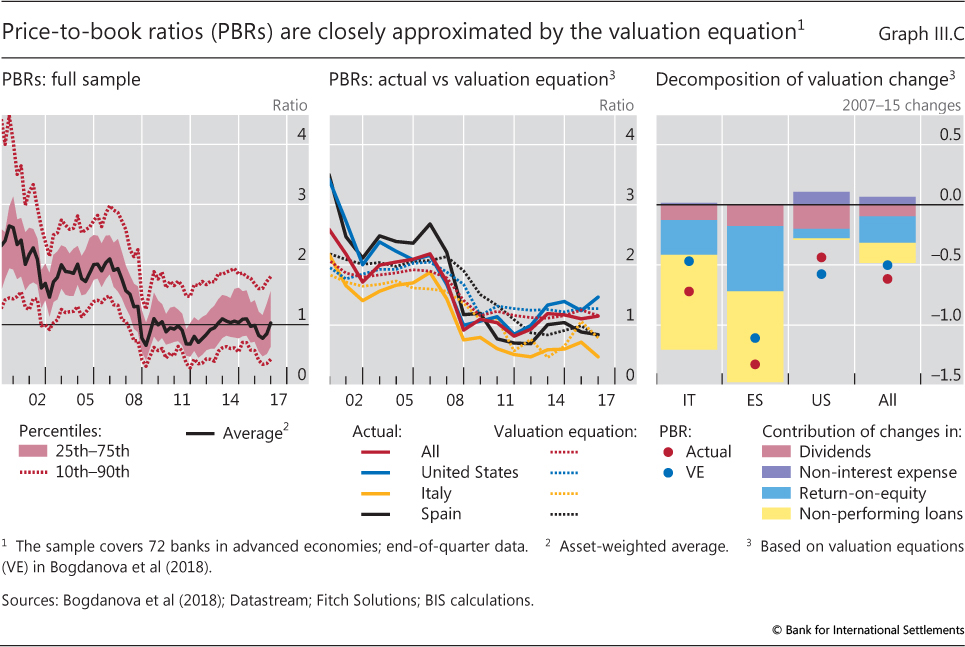
| III.C | Price-to-book ratios (PBRs) are closely approximated by the valuation equation | p 53 |
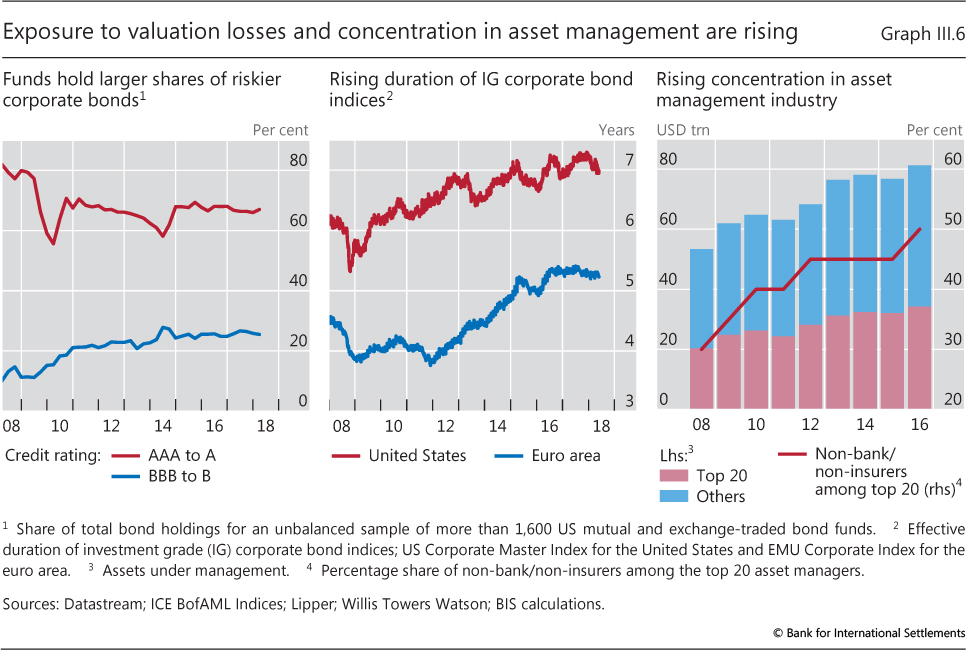
| III.6 | Exposure to valuation losses and concentration in asset management are rising | p 55 |
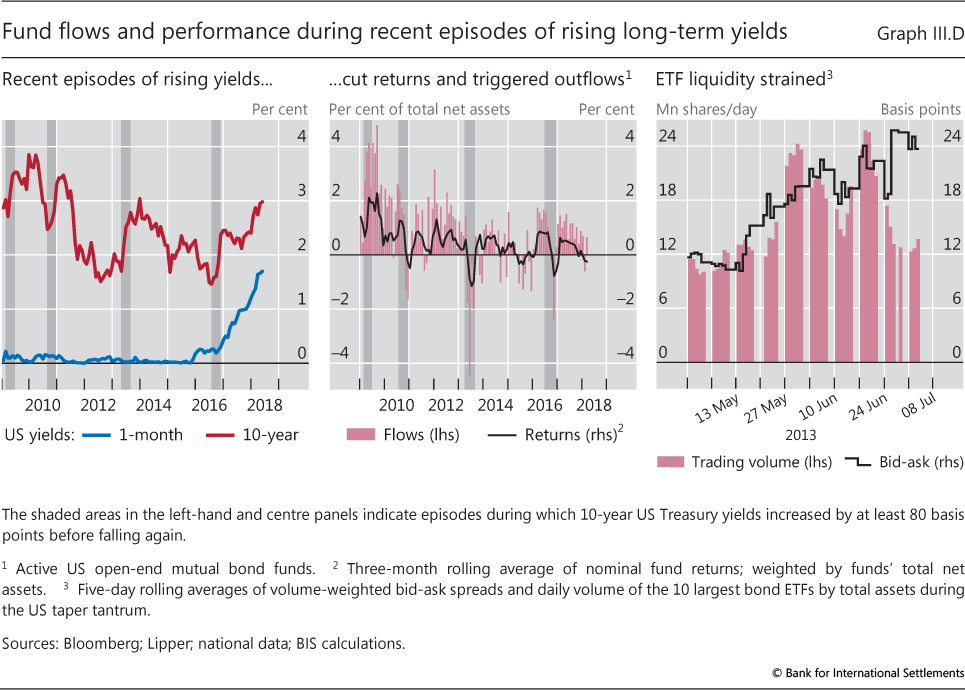
| III.D | Fund flows and performance during recent episodes of rising long-term yields | p 56 |
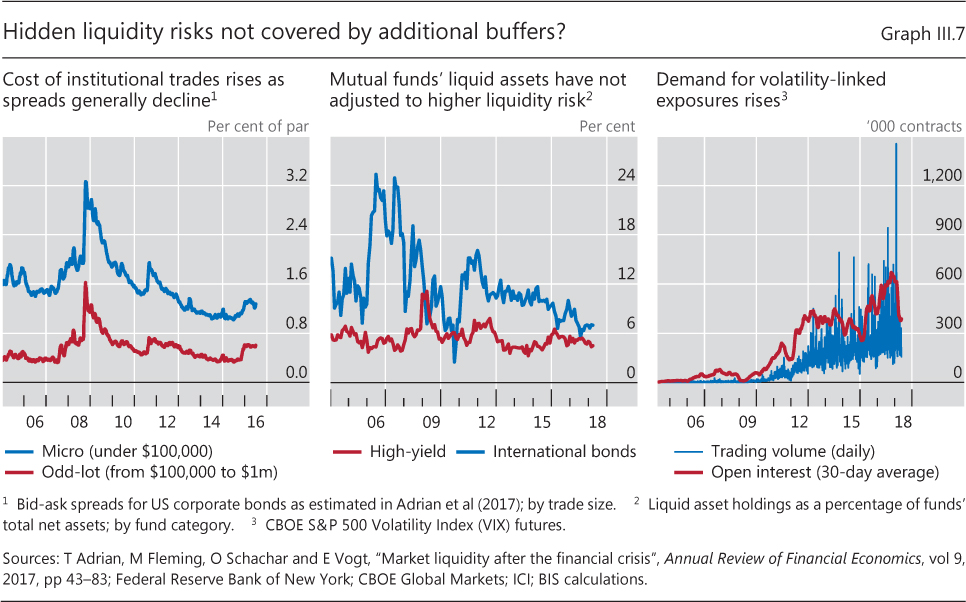
| III.7 | Hidden liquidity risks not covered by additional buffers? | p 58 |
| Chapter IV: data behind the graphs (xlsx) | ||
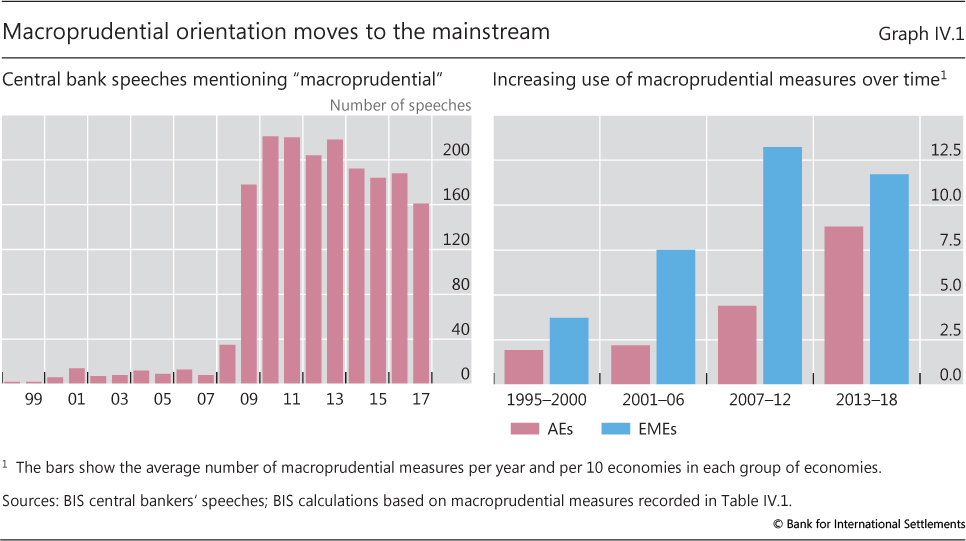
| IV.1 | Macroprudential orientation moves to the mainstream | p 64 |
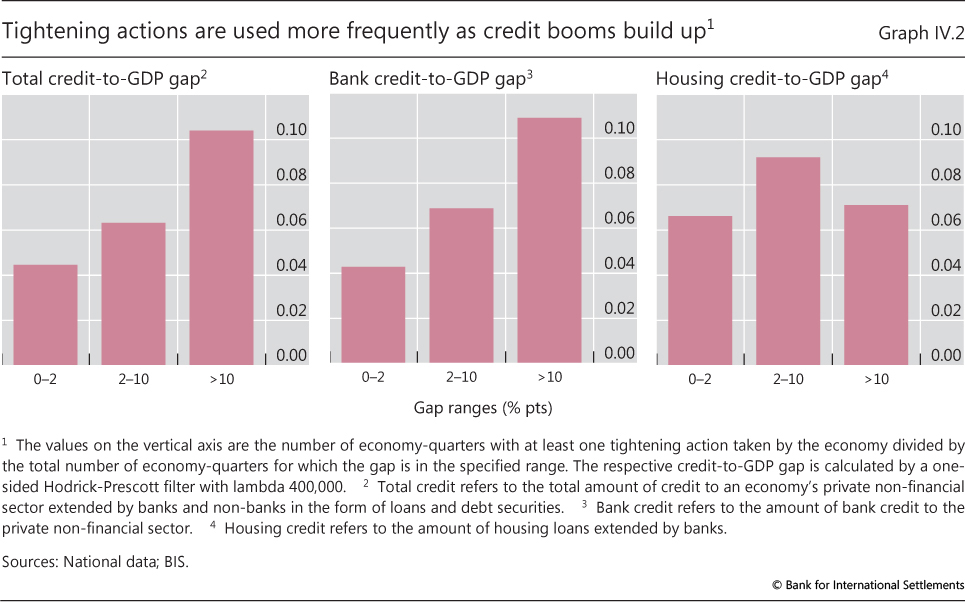
| IV.2 | Tightening actions are used more frequently as credit booms build up | p 66 |
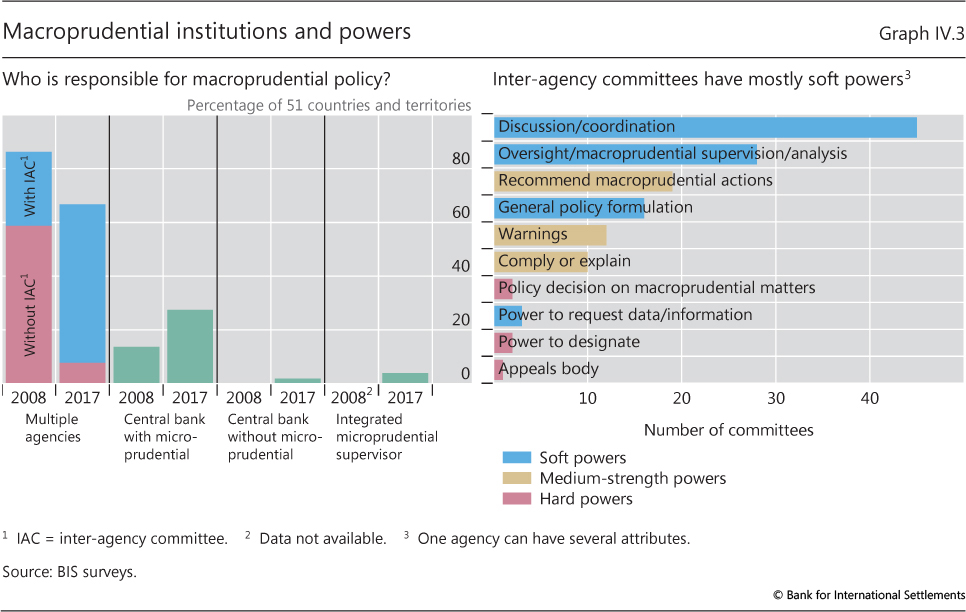
| IV.3 | Macroprudential institutions and powers | p 71 |
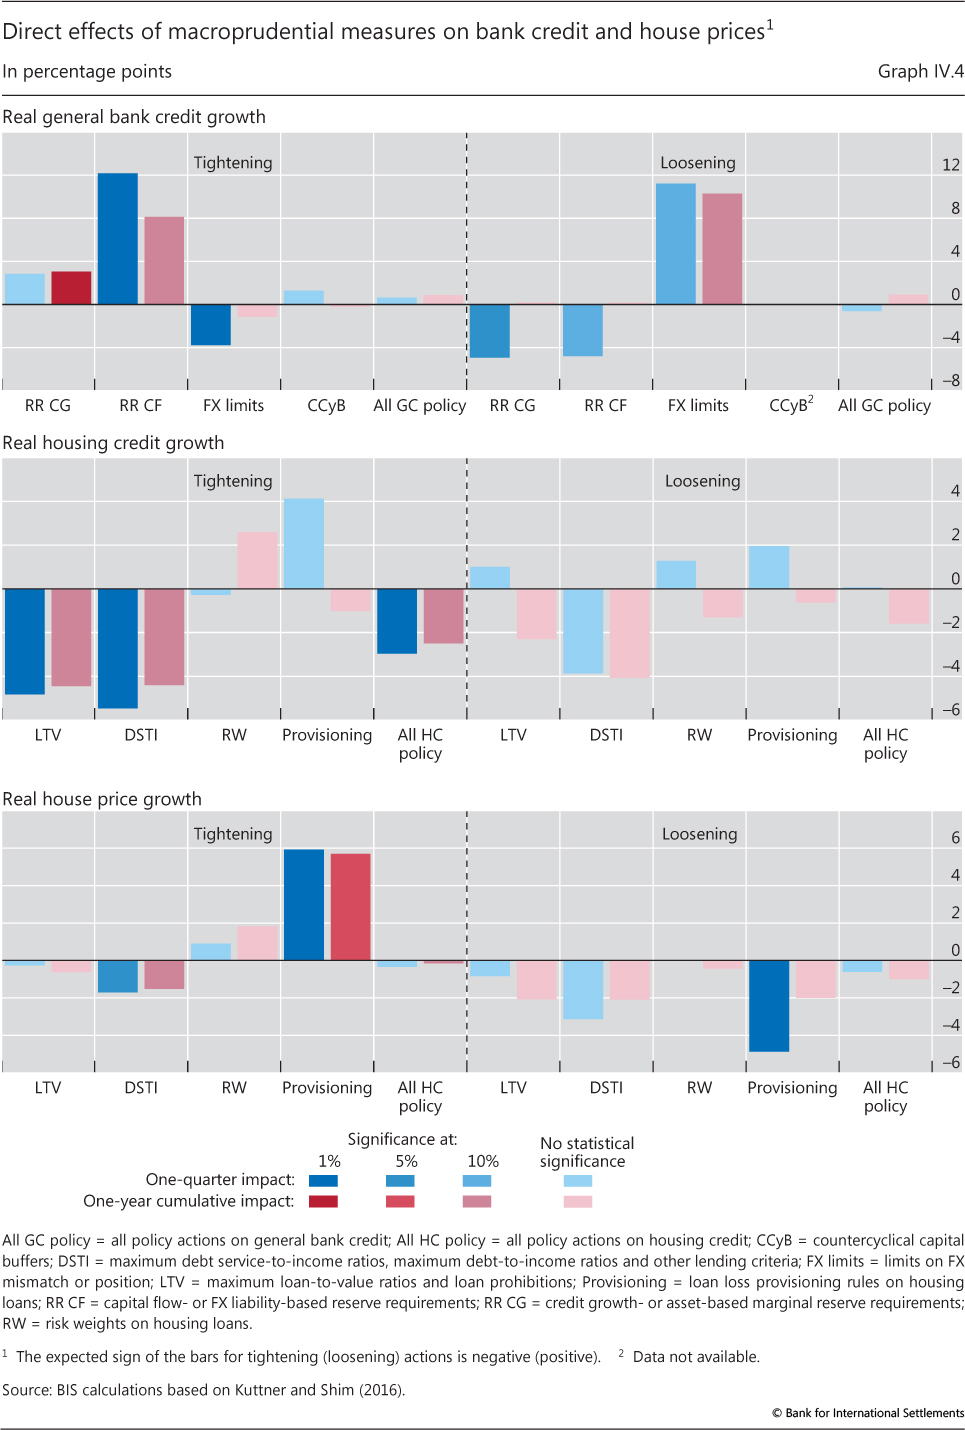
| IV.4 | Direct effects of macroprudential measures on bank credit and house prices | p 73 |
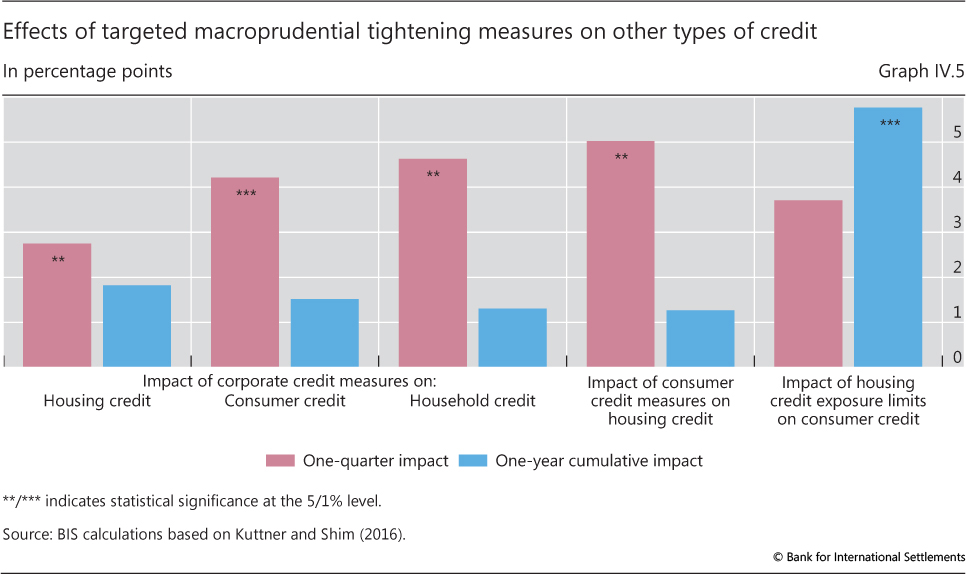
| IV.5 | Effects of targeted macroprudential tightening measures on other types of credit | p 74 |
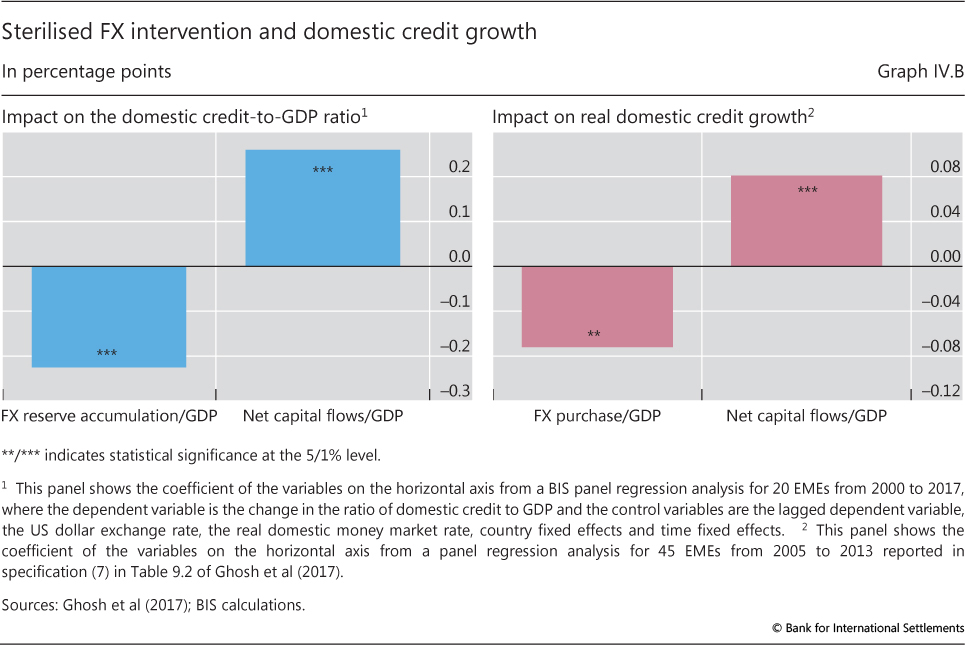
| IV.B | Sterilised FX intervention and domestic credit growth | p 77 |
| Chapter V: data behind the graphs (xlsx) | ||
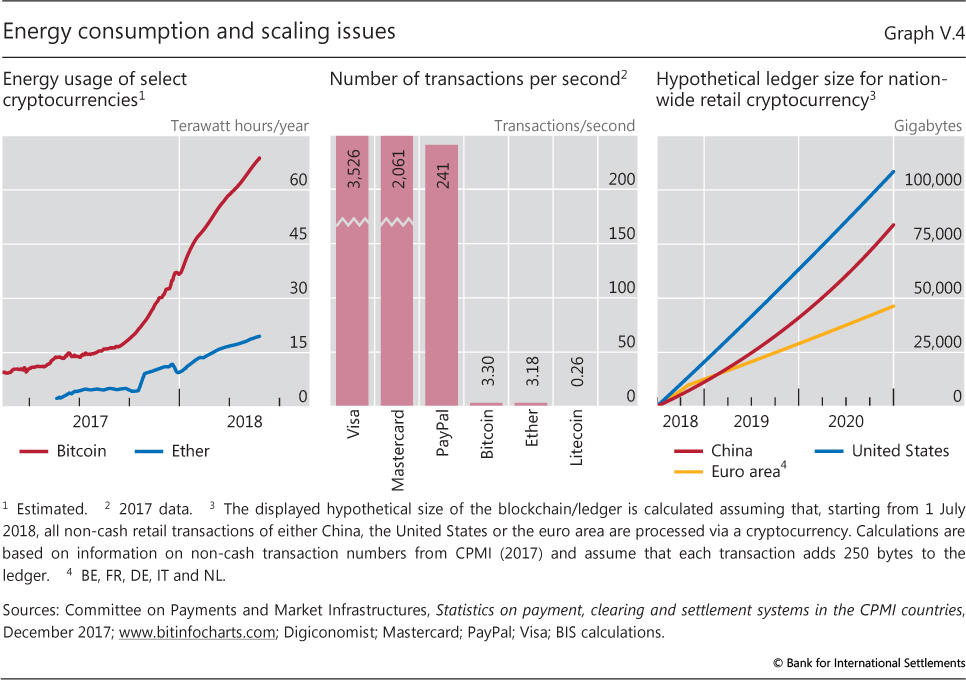
| V.4 | Energy consumption and scaling issues | p 99 |
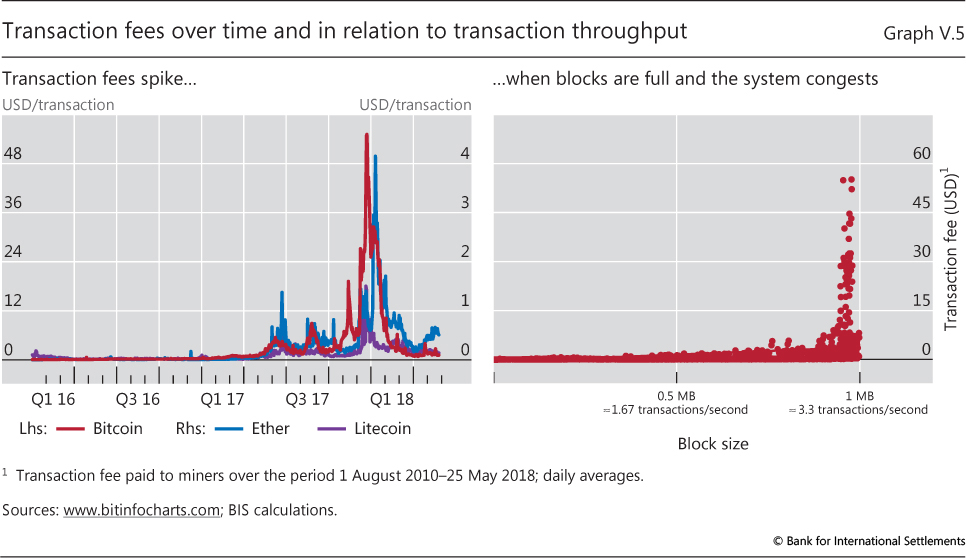
| V.5 | Transaction fees over time and in relation to transaction throughput | p 100 |
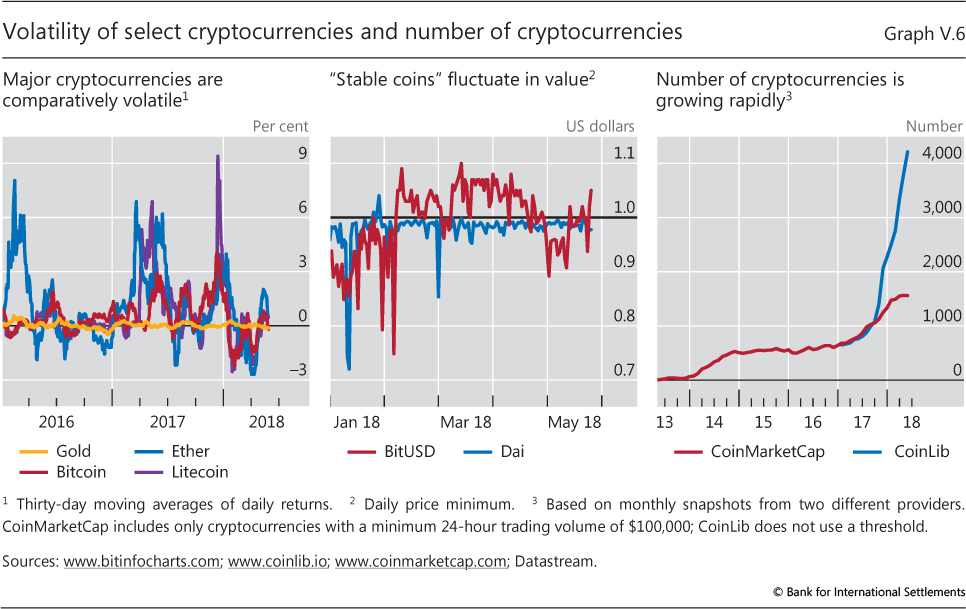
| V.6 | Volatility of select cryptocurrencies and number of cryptocurrencies | p 101 |
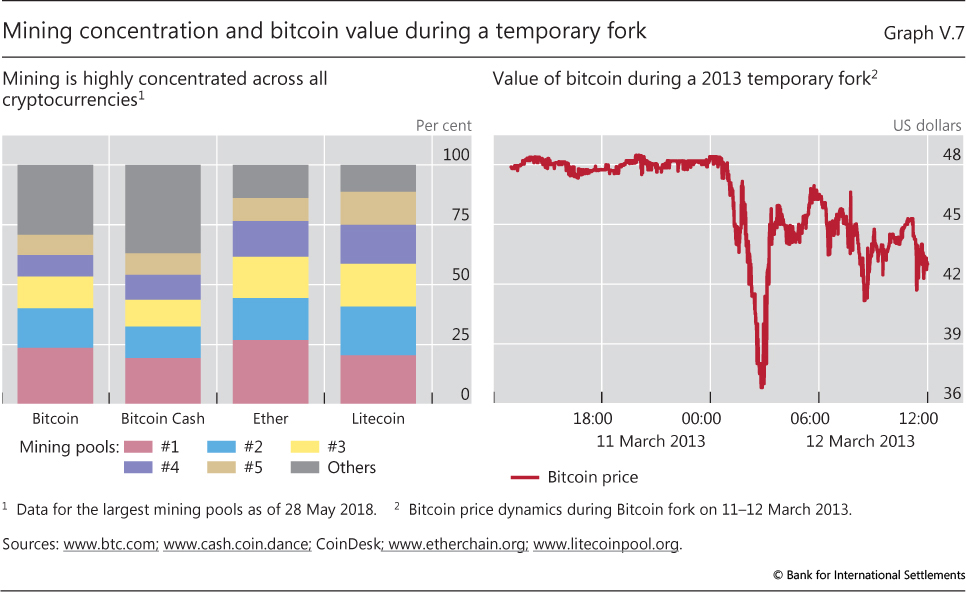
| V.7 | Mining concentration and bitcoin value during a temporary fork | p 102 |
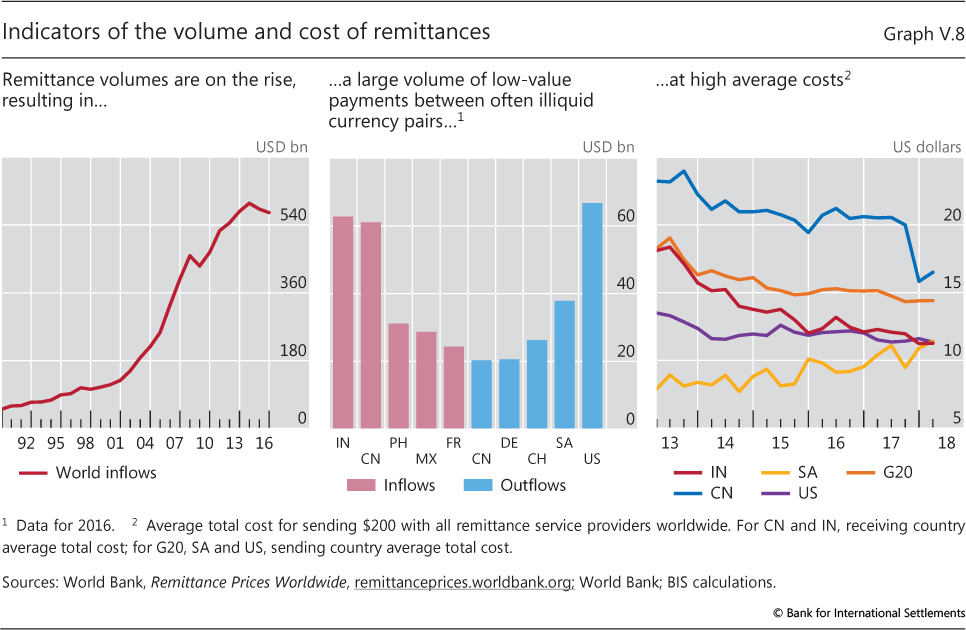
| V.8 | Indicators of the volume and cost of remittances | p 104 |
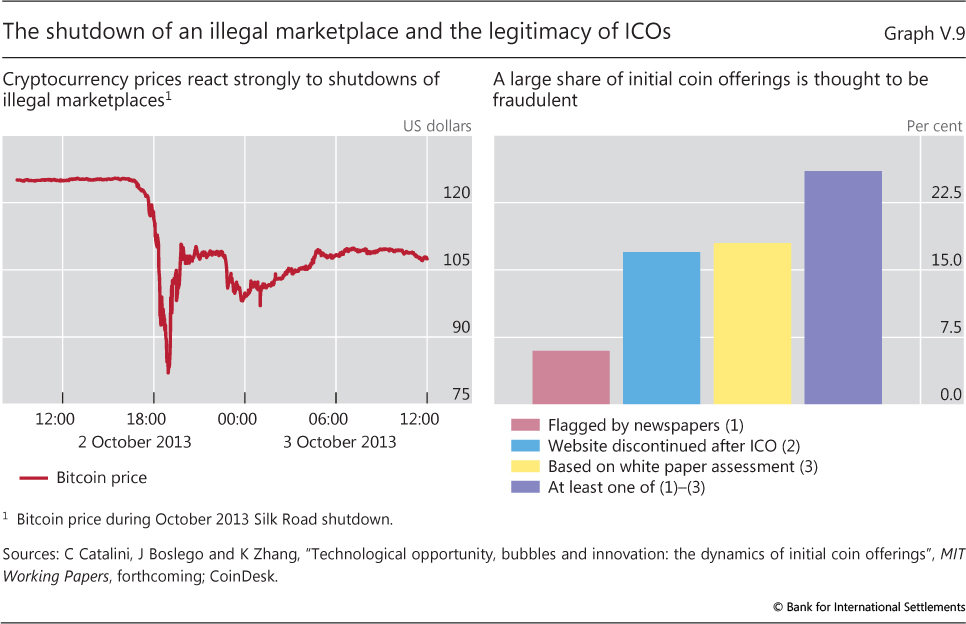
| V.9 | The shutdown of an illegal marketplace and the legitimacy of ICOs | p 107 |