87th Annual Report, 2016/17 - Statistics associated with the graphs
Series description is to be found in the corresponding graph, that is linked in the right side column.
Download all statistics (zipped XLSX, 1.844 MB).
Graphs |
||
| Chapter I: data behind the graph (xlsx) | ||
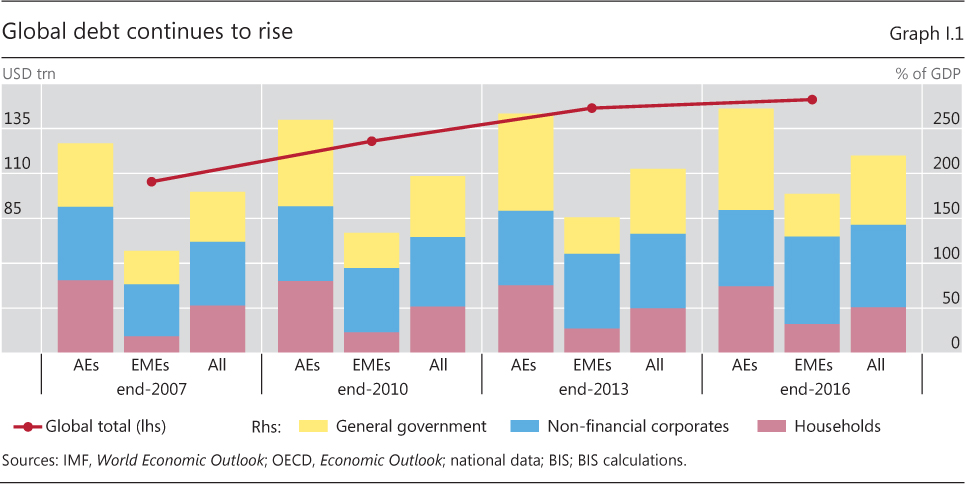
| I.1 | Global debt continues to rise | p 8 |
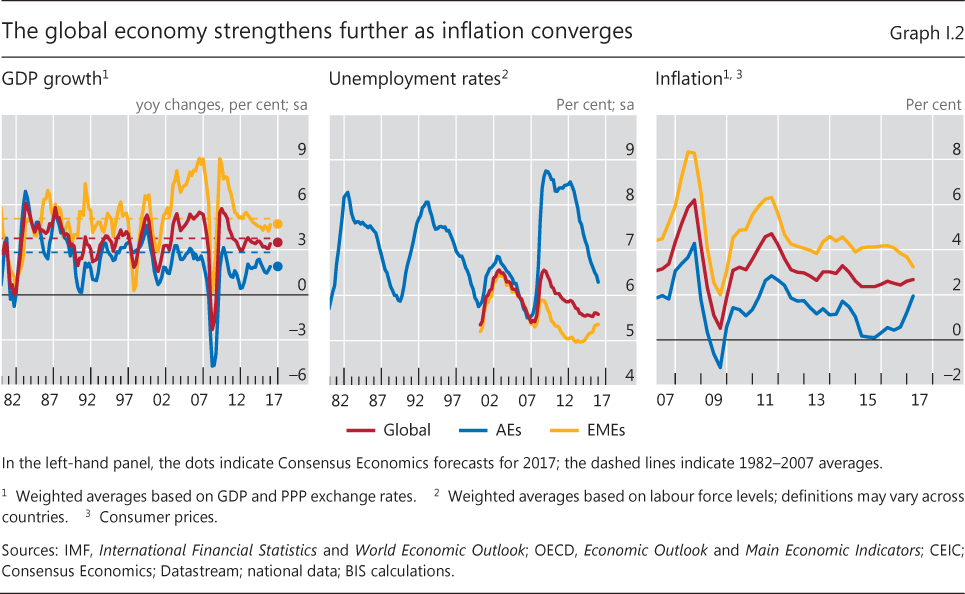
| I.2 | The global economy strengthens further as inflation converges | p 9 |
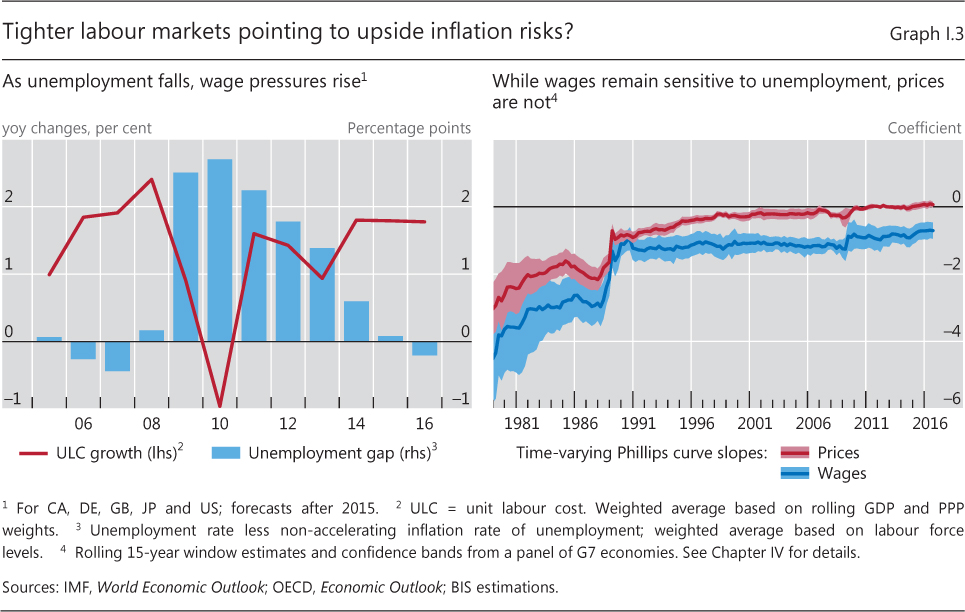
| I.3 | Tighter labour markets pointing to upside inflation risks? | p 11 |
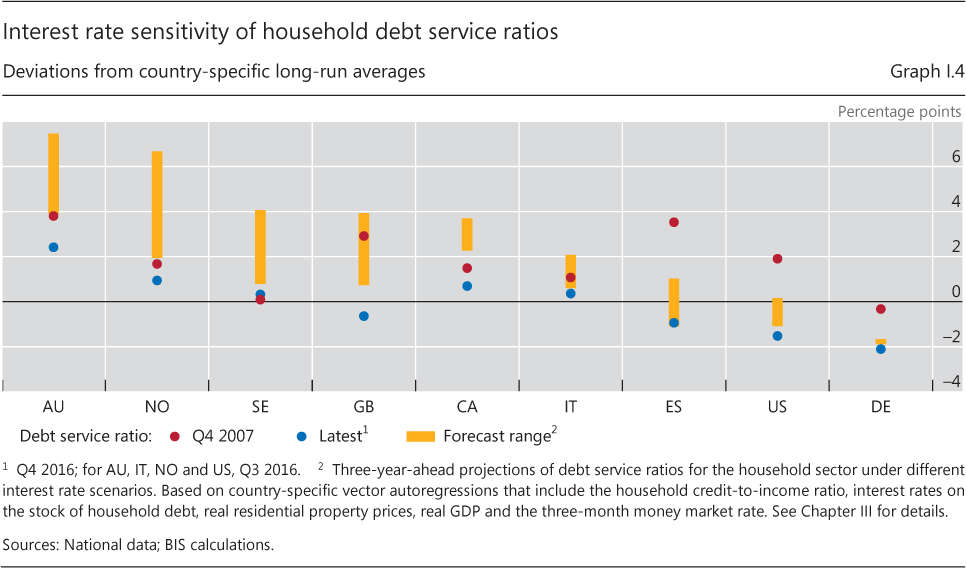
| I.4 | Interest rate sensitivity of household debt service ratios | p 14 |
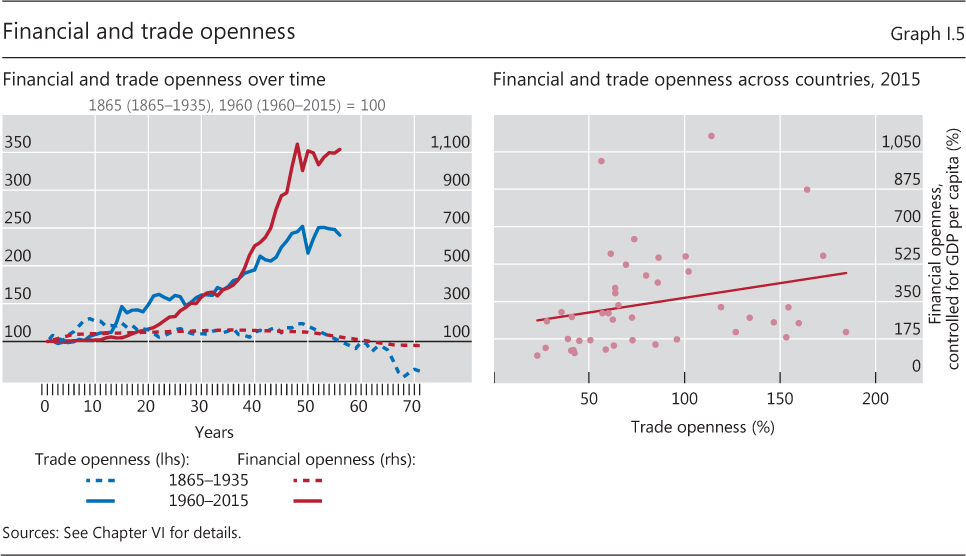
| I.5 | Financial and trade openness | p 15 |
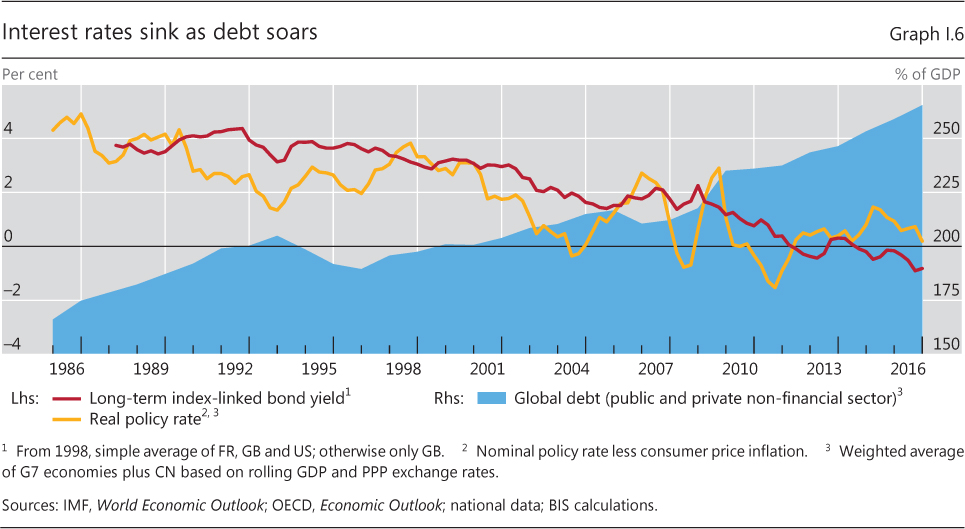
| I.6 | Interest rates sink as debt soars | p 19 |
| Chapter II: data behind the graphs (xlsx) | ||
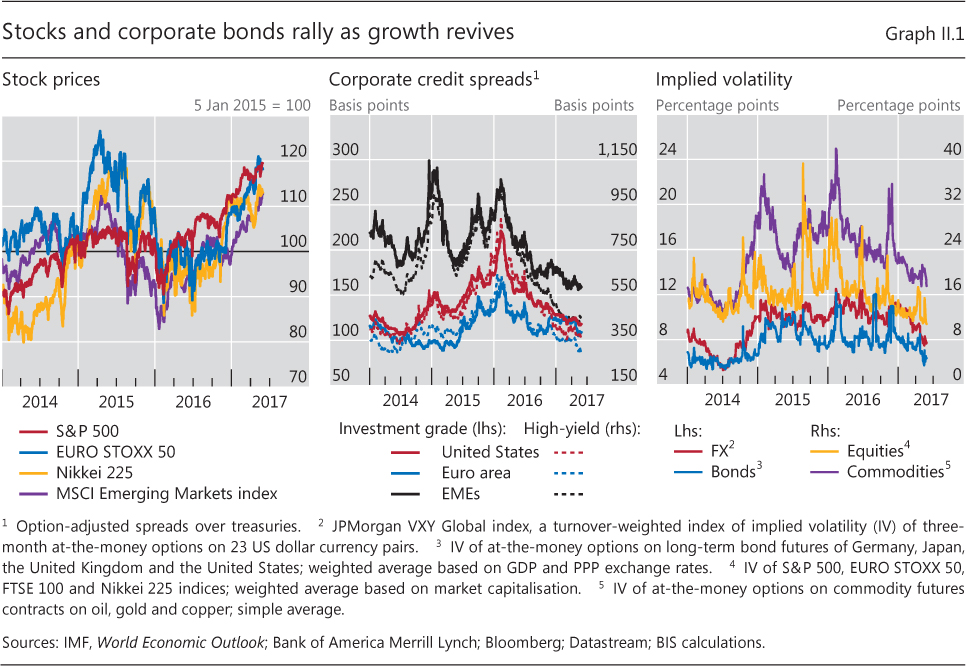
| II.1 | Stocks and corporate bonds rally as growth revives | p 24 |
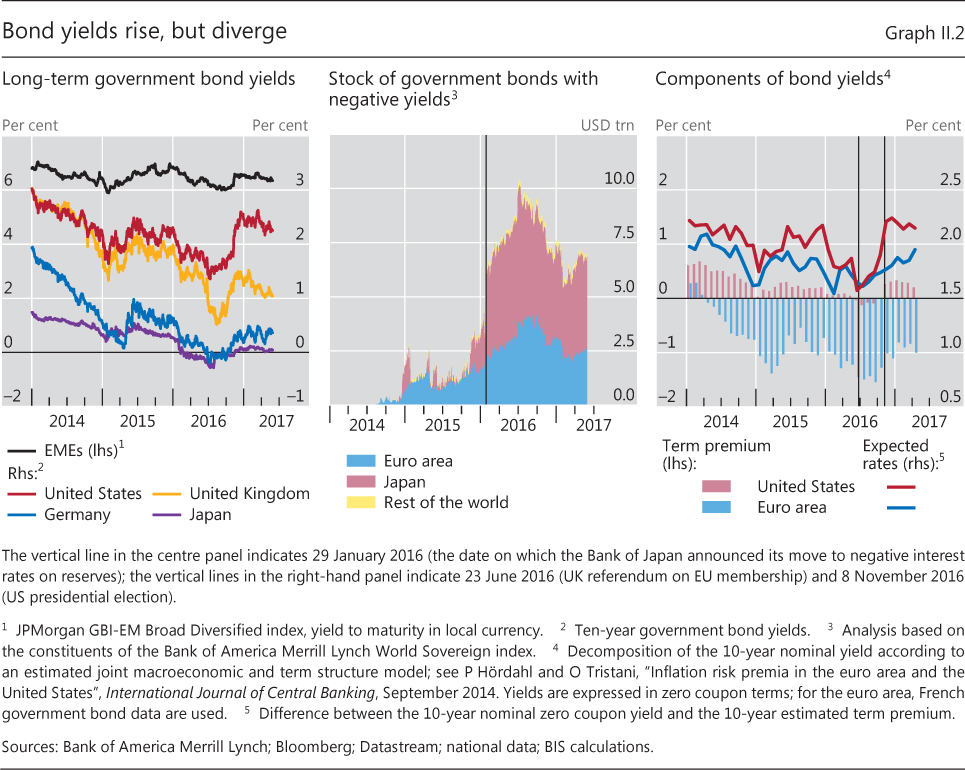
| II.2 | Bond yields rise, but diverge | p 25 |
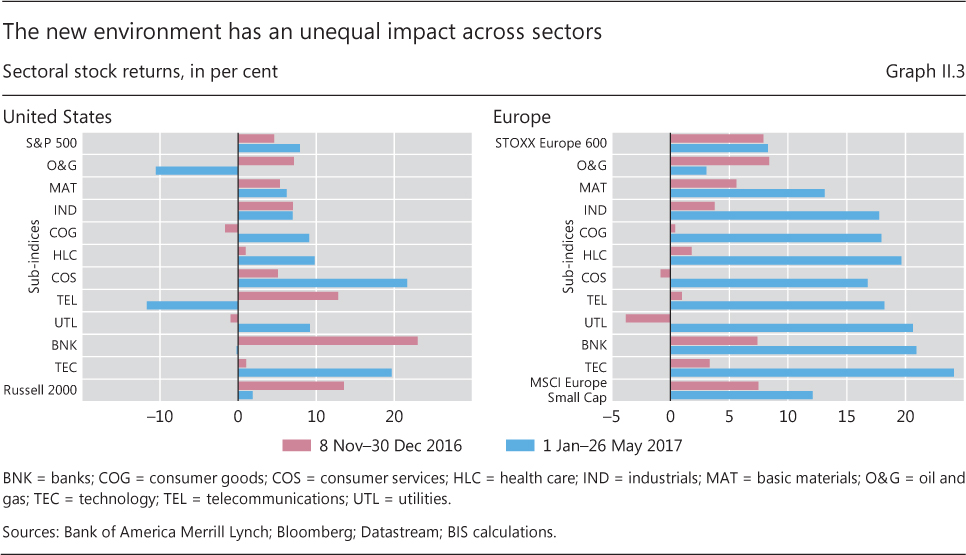
| II.3 | The new environment has an unequal impact across sectors | p 26 |
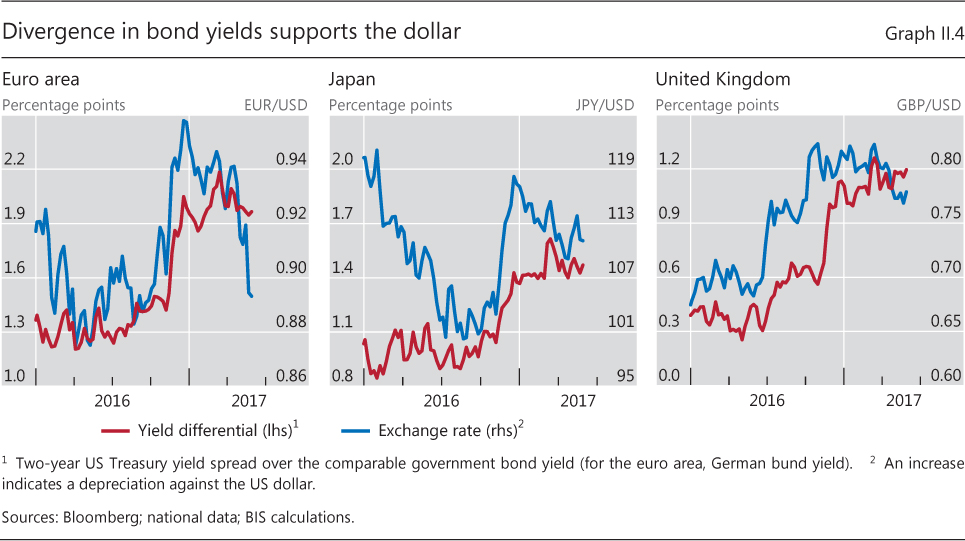
| II.4 | Divergence in bond yields supports the dollar | p 26 |
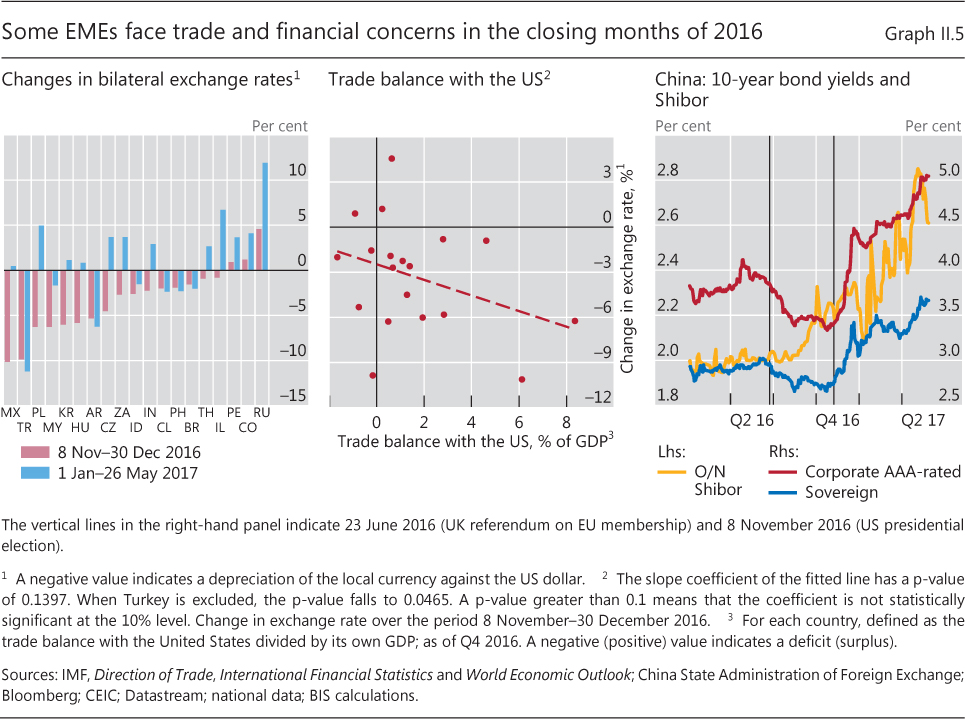
| II.5 | Some EMEs face trade and financial concerns in the closing months of 2016 | p 27 |
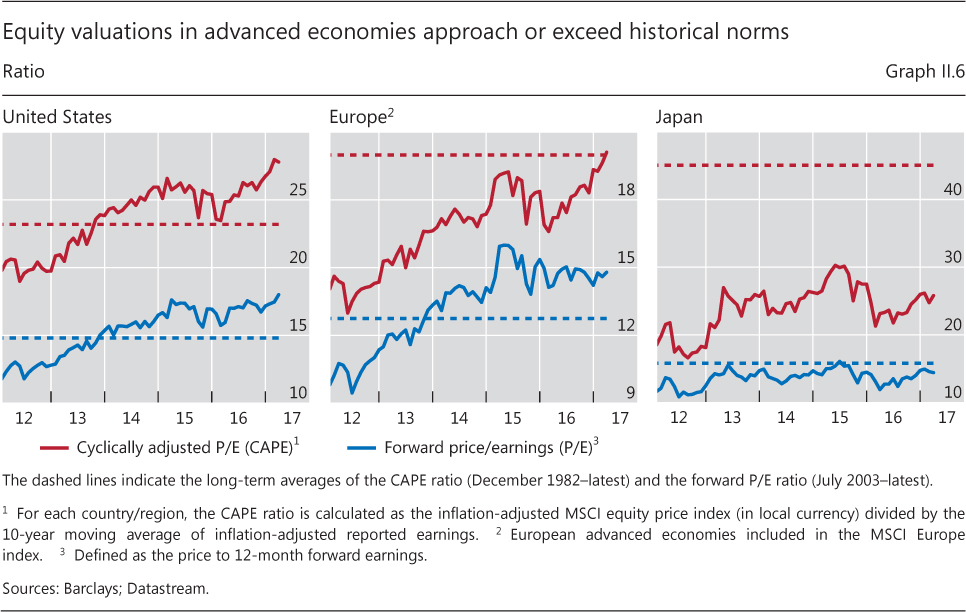
| II.6 | Equity valuations in advanced economies approach or exceed historical norms | p 27 |
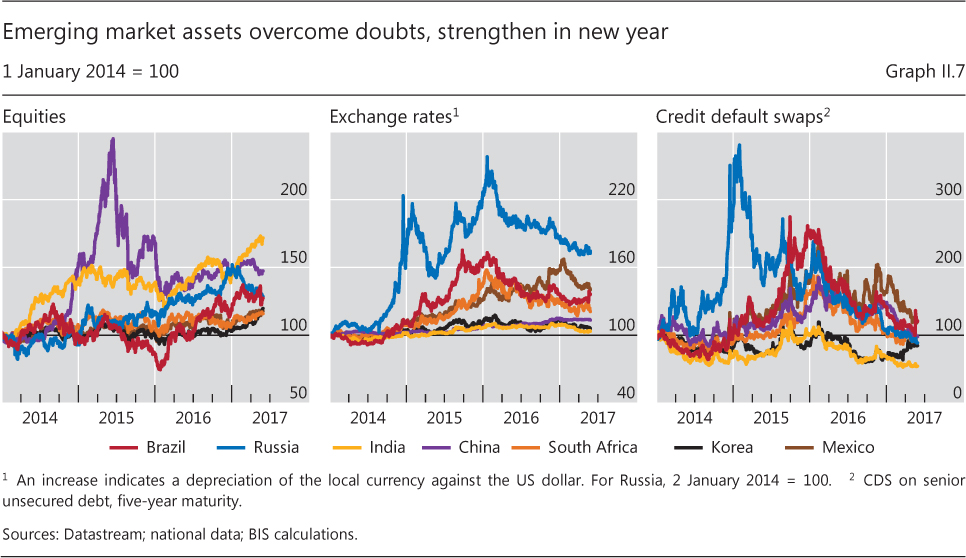
| II.7 | Emerging market assets overcome doubts, strengthen in new year | p 28 |
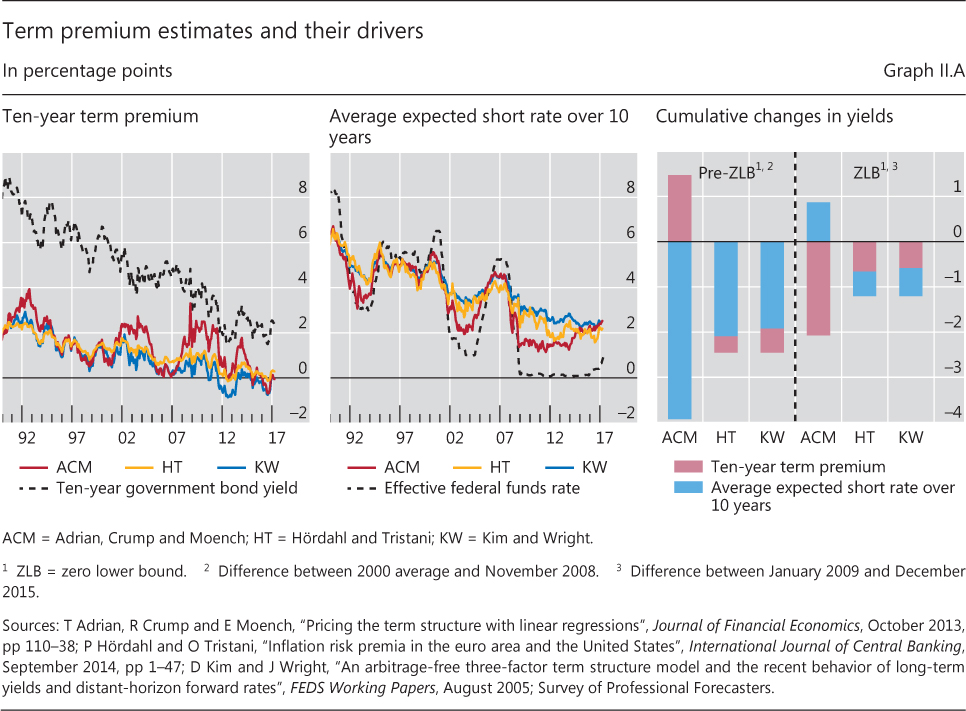
| II.A | Term premium estimates and their drivers | p 29 |
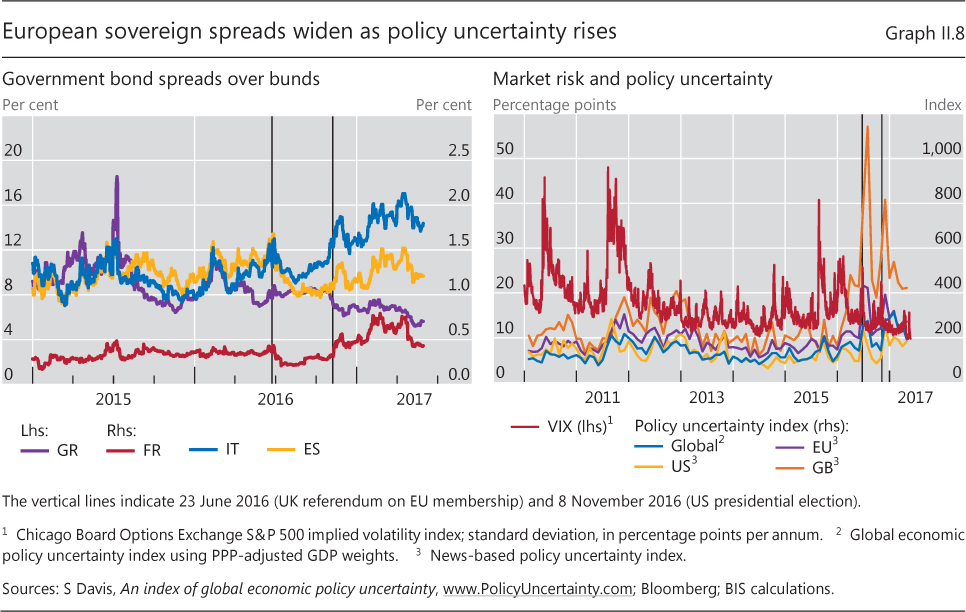
| II.8 | European sovereign spreads widen as policy uncertainty rises | p 31 |
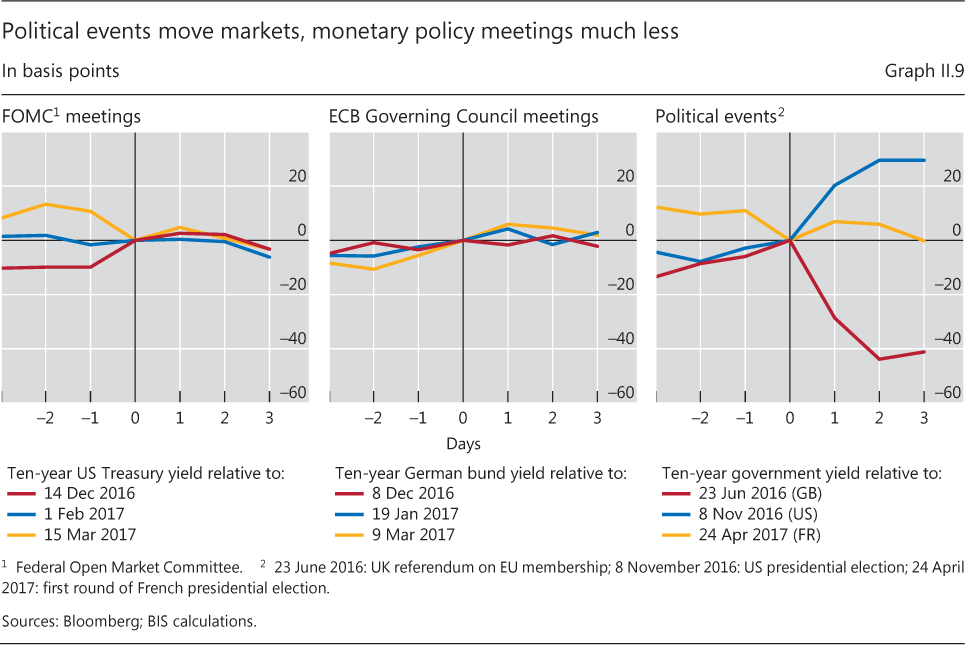
| II.9 | Political events move markets, monetary policy meetings much less | p 32 |
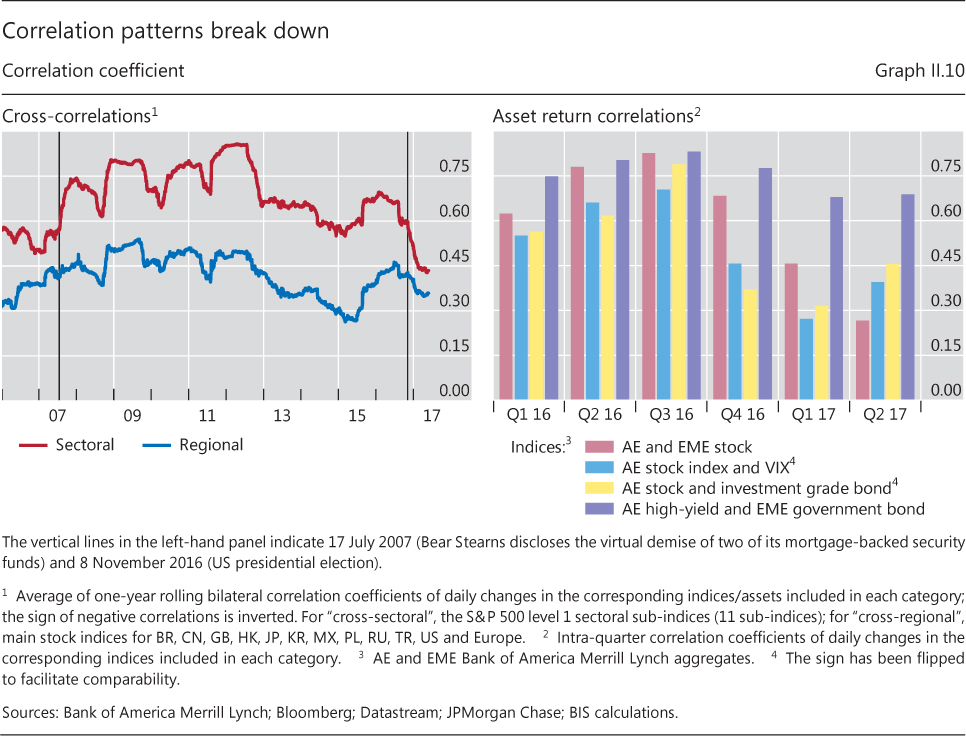
| II.10 | Correlation patterns break down | p 32 |
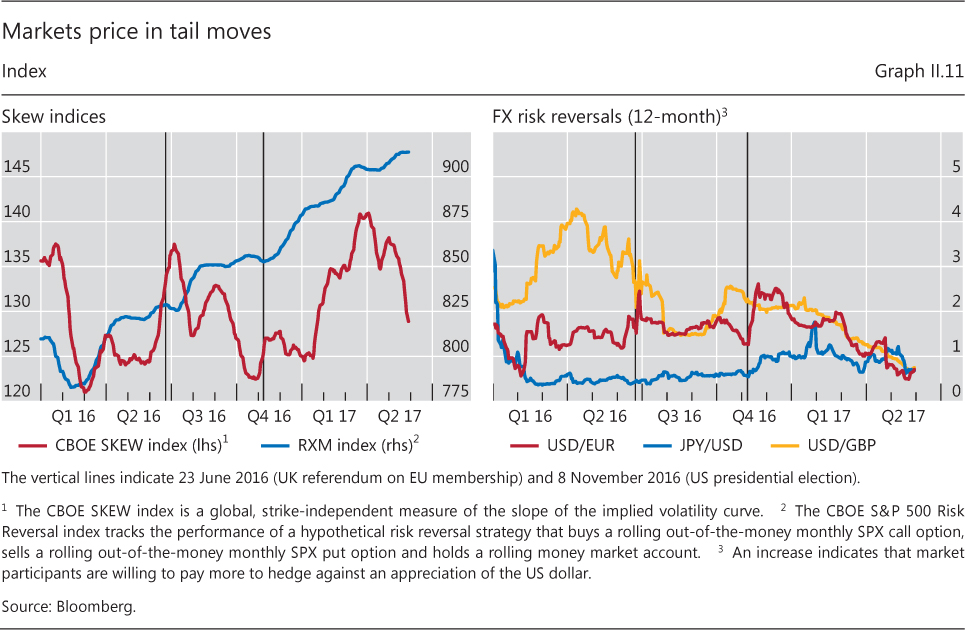
| II.11 | Markets price in tail moves | p 33 |
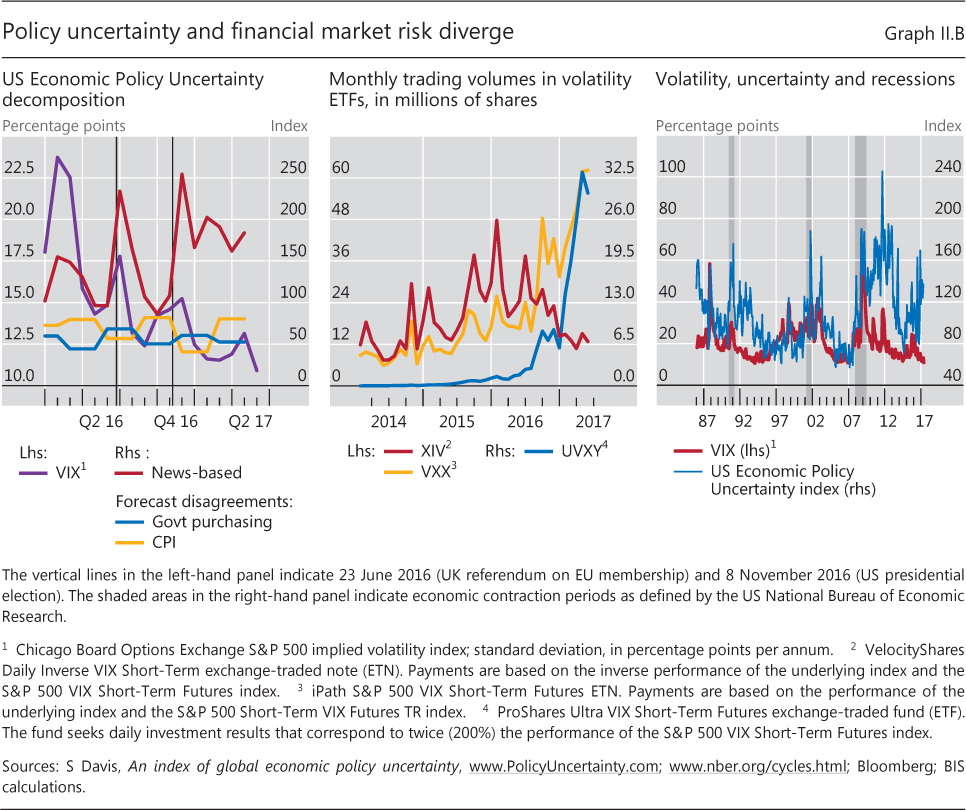
| II.B | Policy uncertainty and financial market risk diverge | p 34 |
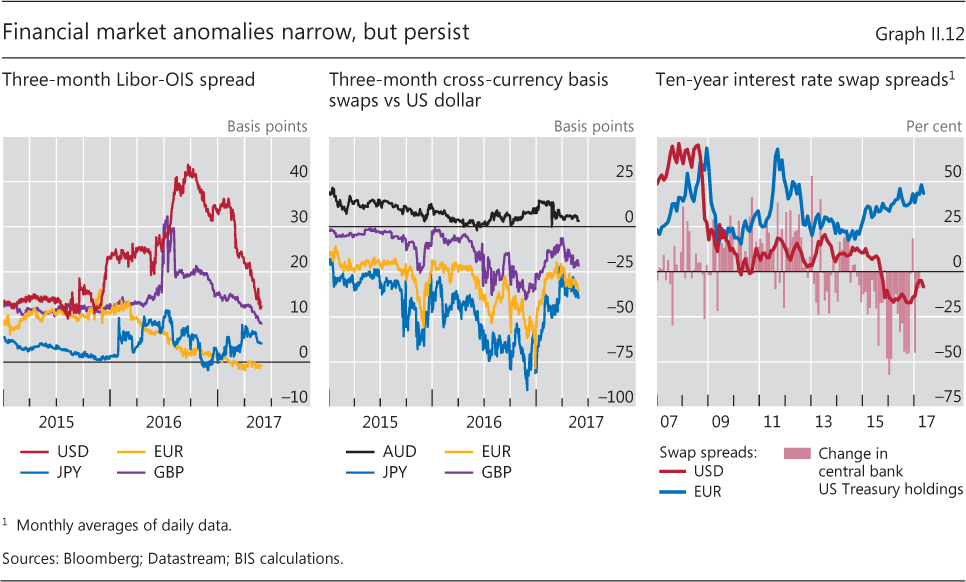
| II.12 | Financial market anomalies narrow, but persist | p 36 |
| Chapter III: data behind the graphs (xlsx) | ||
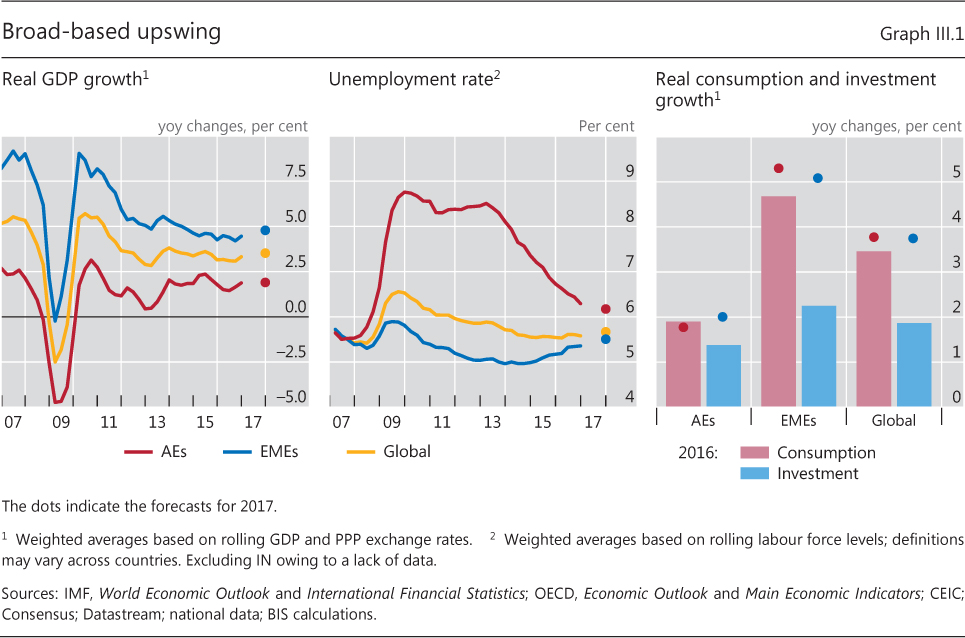
| III.1 | Broad-based upswing | p 42 |
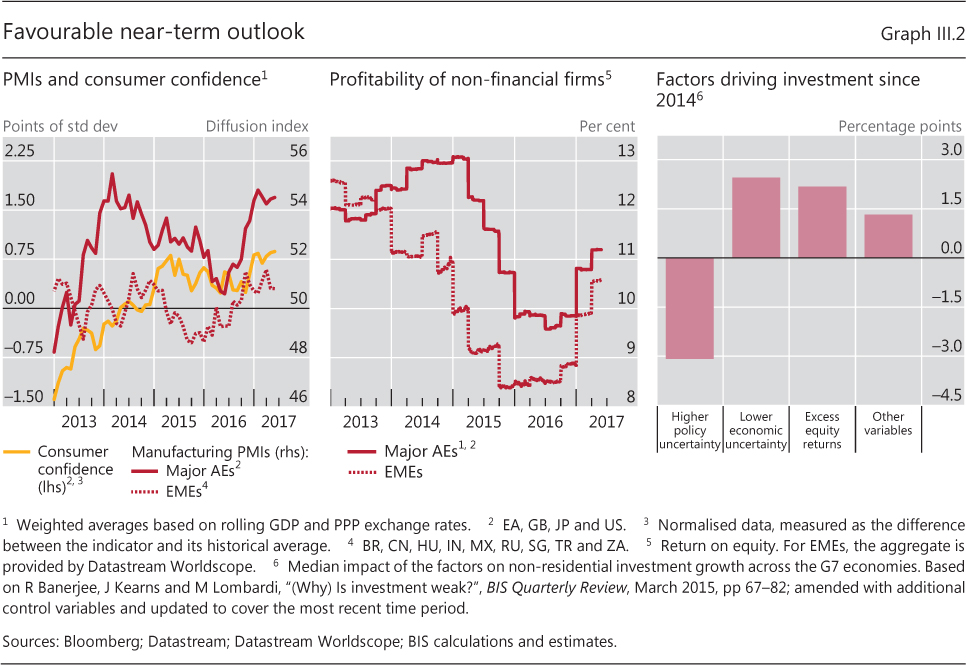
| III.2 | Favourable near-term outlook | p 43 |
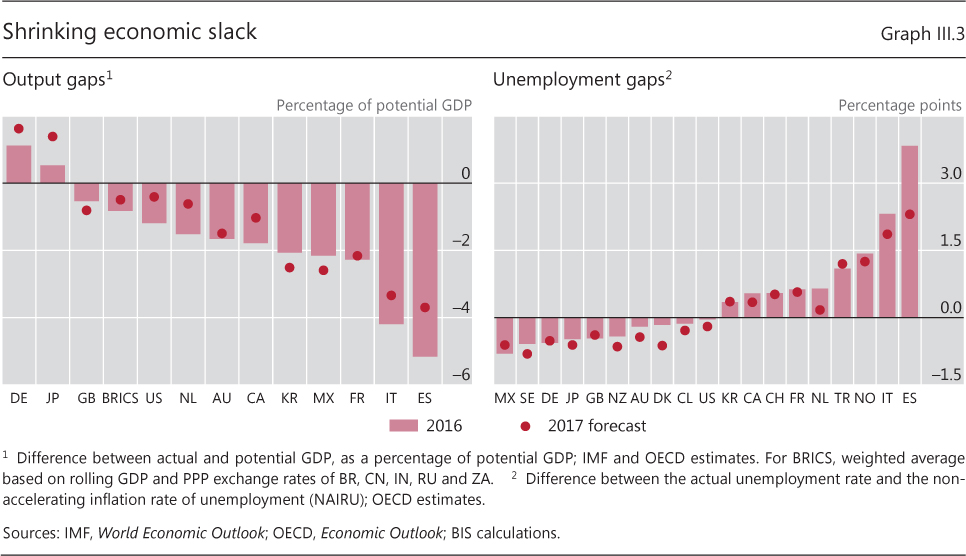
| III.3 | Shrinking economic slack | p 44 |
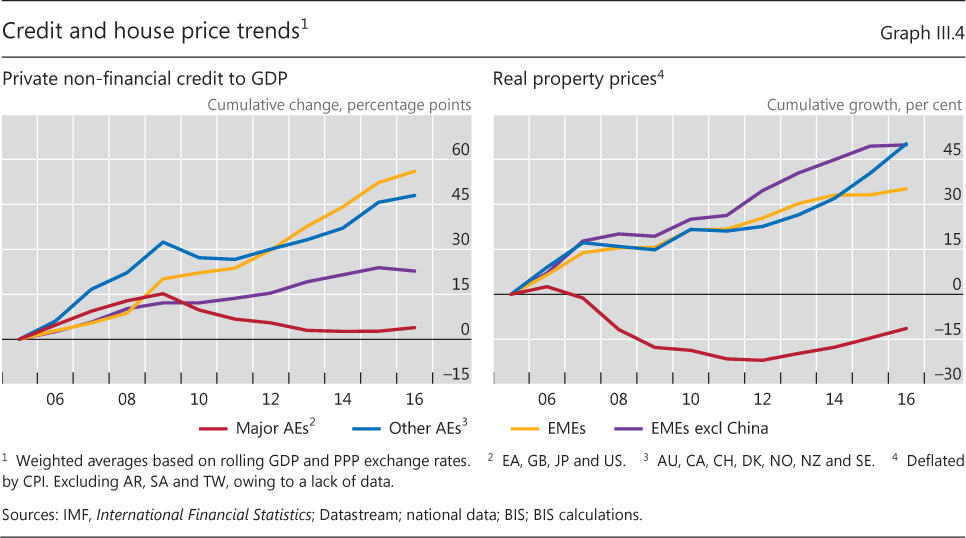
| III.4 | Credit and house price trends | p 44 |
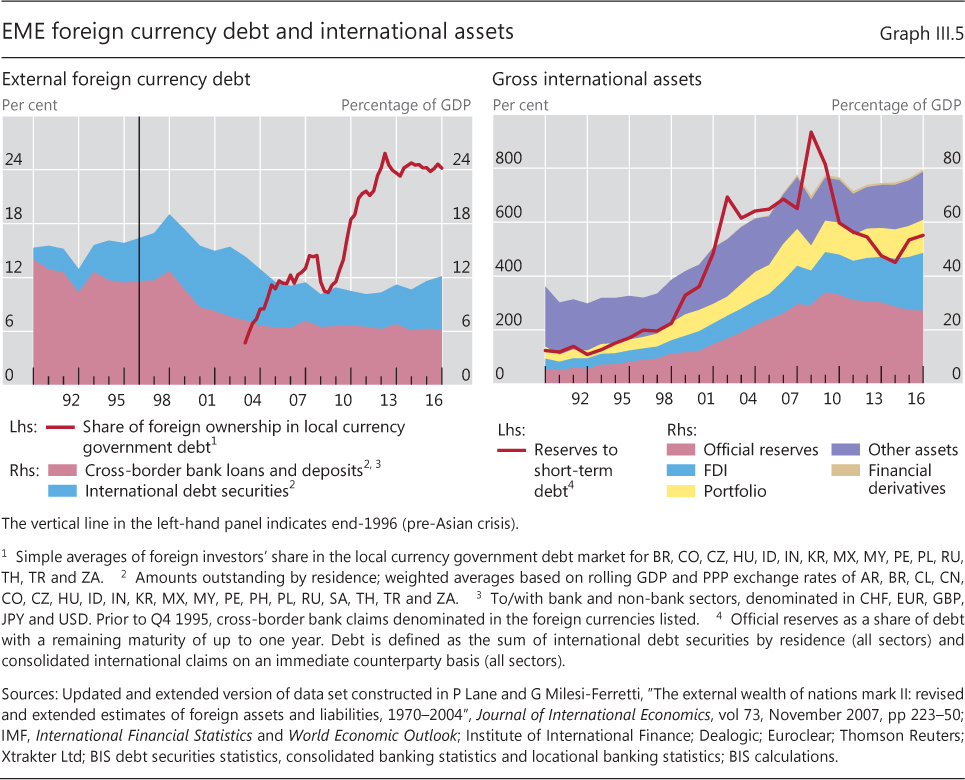
| III.5 | EME foreign currency debt and international assets | p 47 |
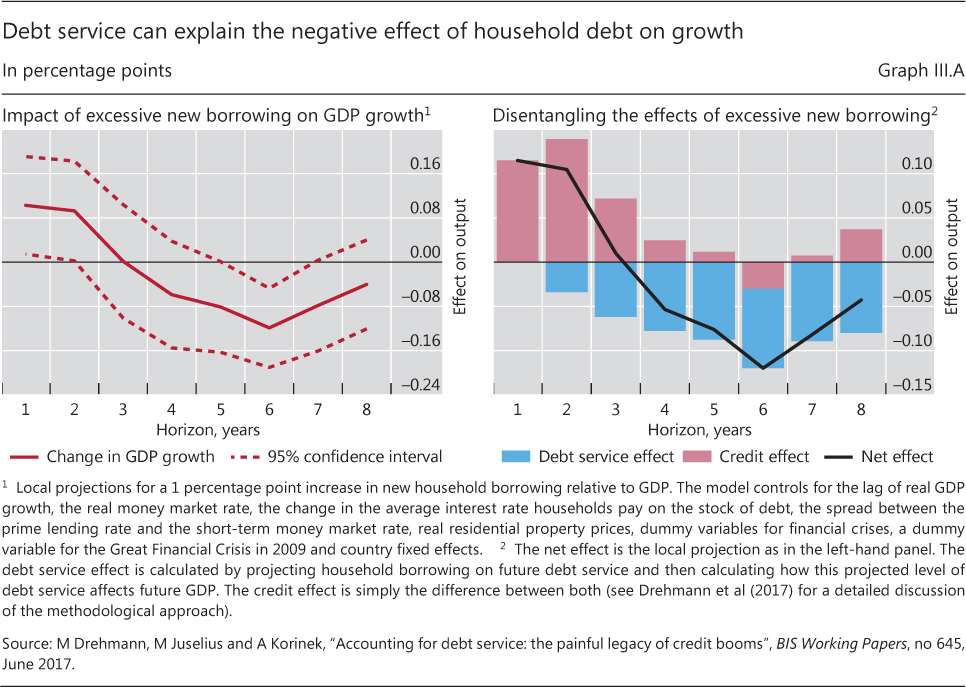
| III.A | Debt service can explain the negative effect of household debt on growth | p 48 |
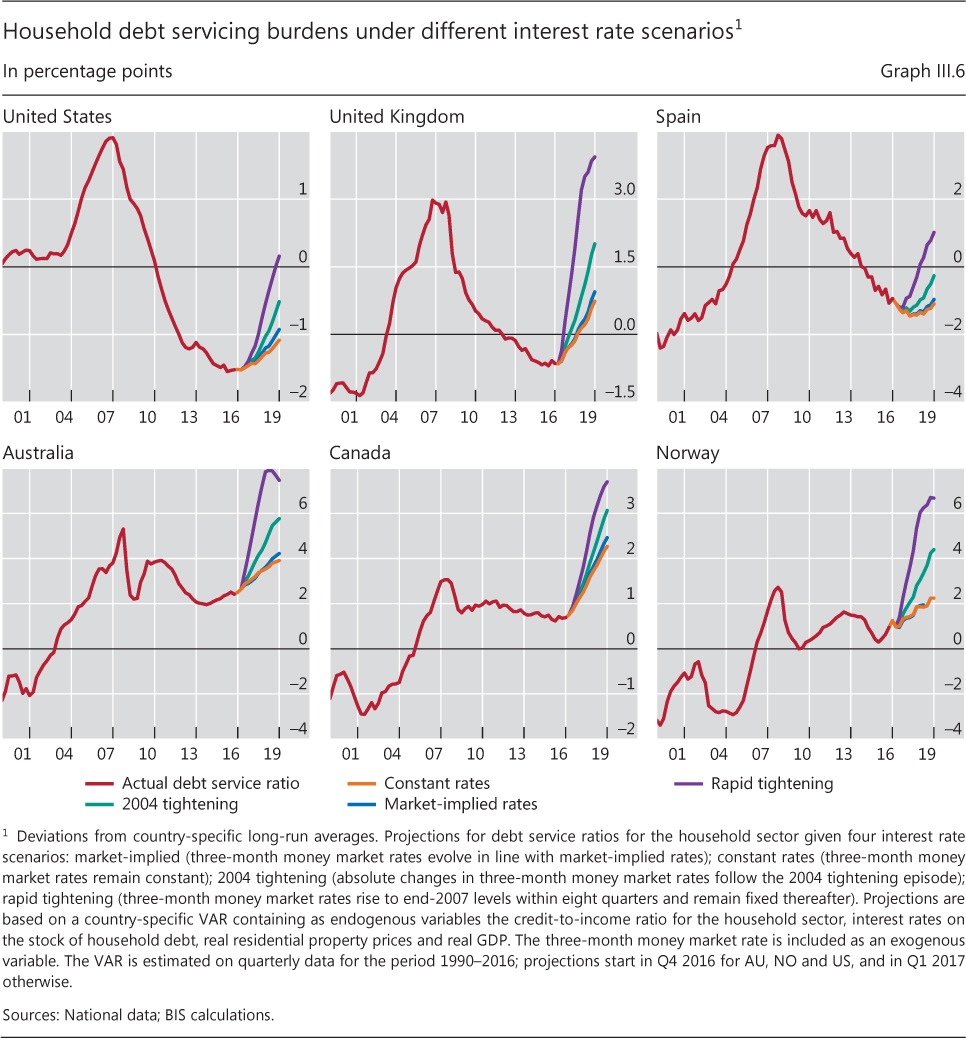
| III.6 | Household debt servicing burdens under different interest rate scenarios | p 50 |
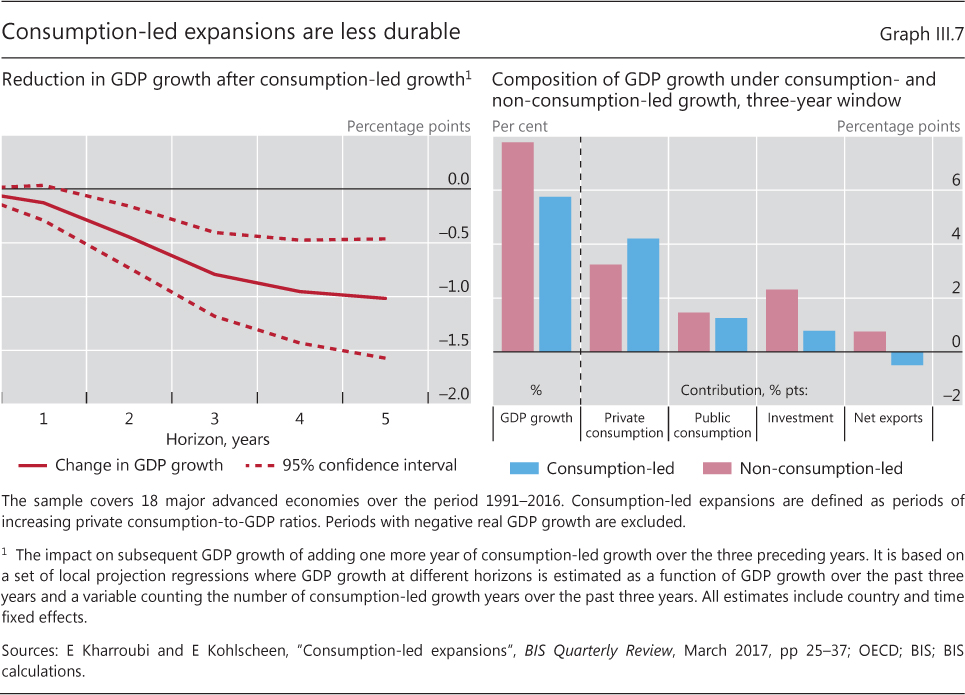
| III.7 | Consumption-led expansions are less durable | p 51 |
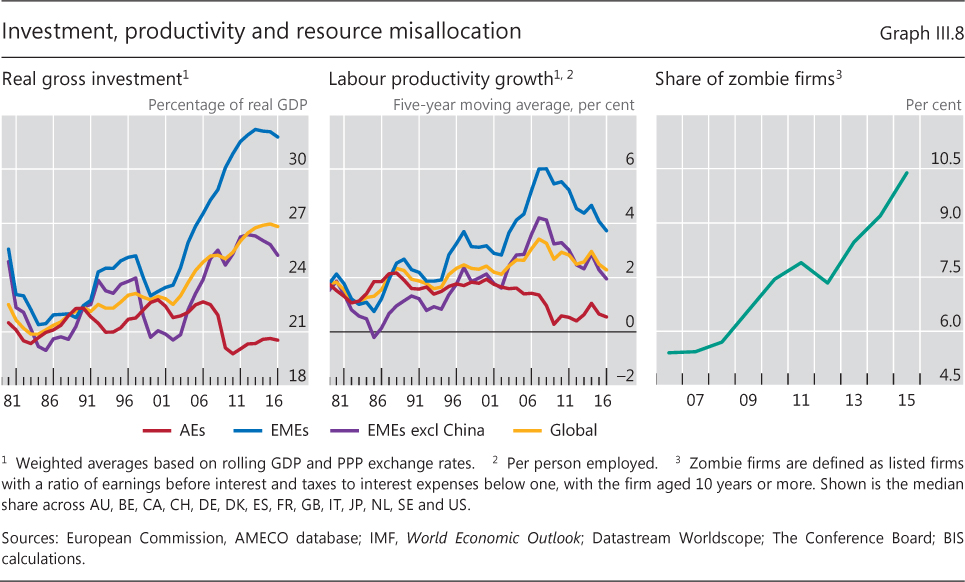
| III.8 | Investment, productivity and resource misallocation | p 52 |
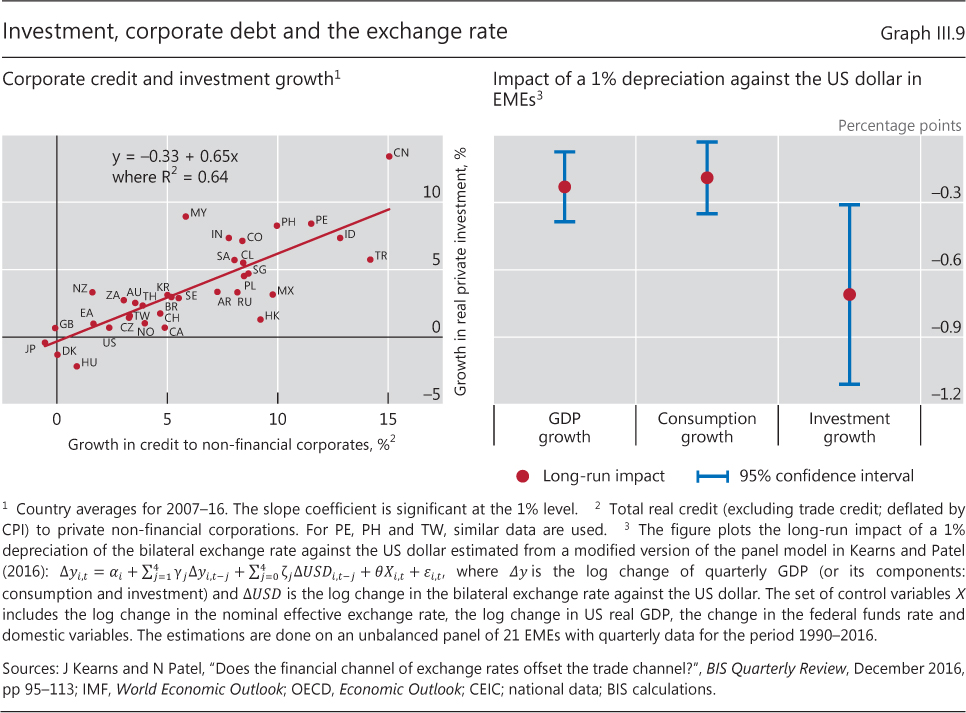
| III.9 | Investment, corporate debt and the exchange rate | p 52 |
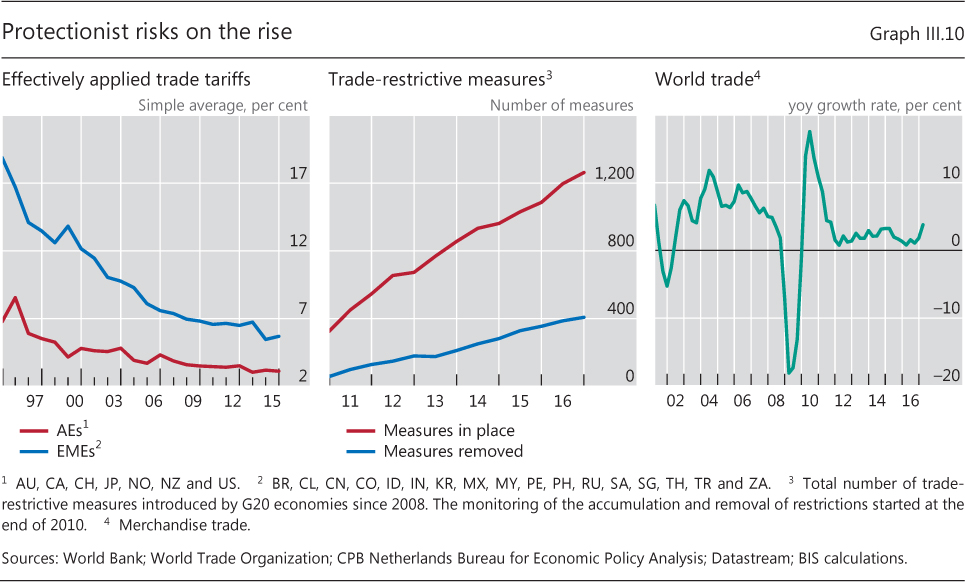
| III.10 | Protectionist risks on the rise | p 53 |
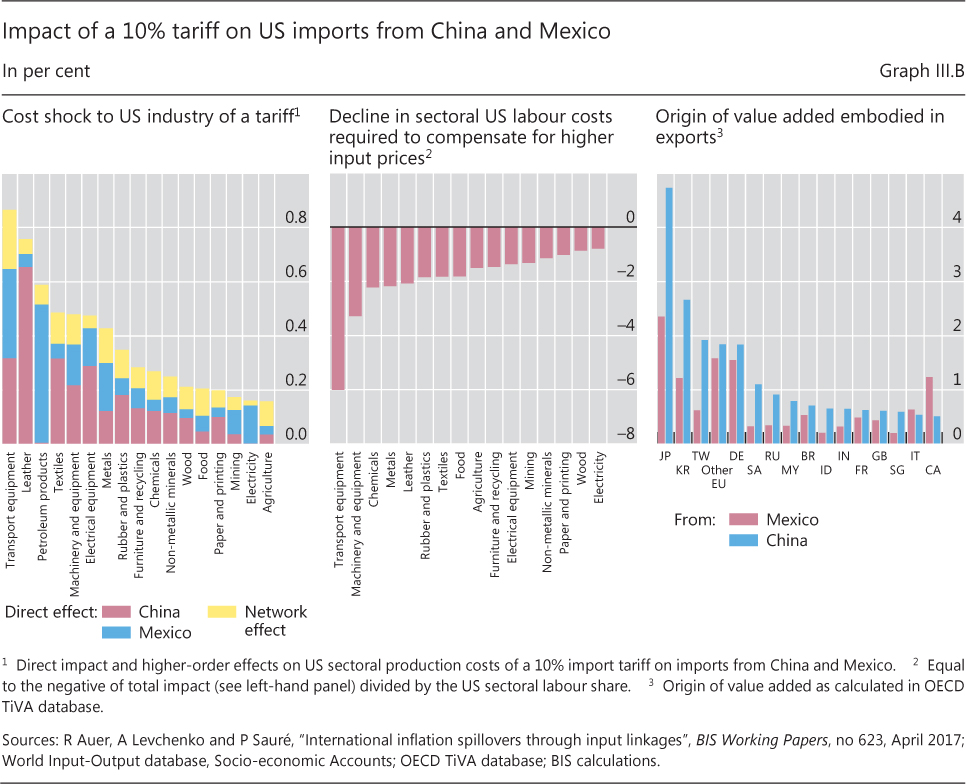
| III.B | Impact of a 10% tariff on US imports from China and Mexico | p 54 |
| Chapter IV: data behind the graphs (xlsx) | ||
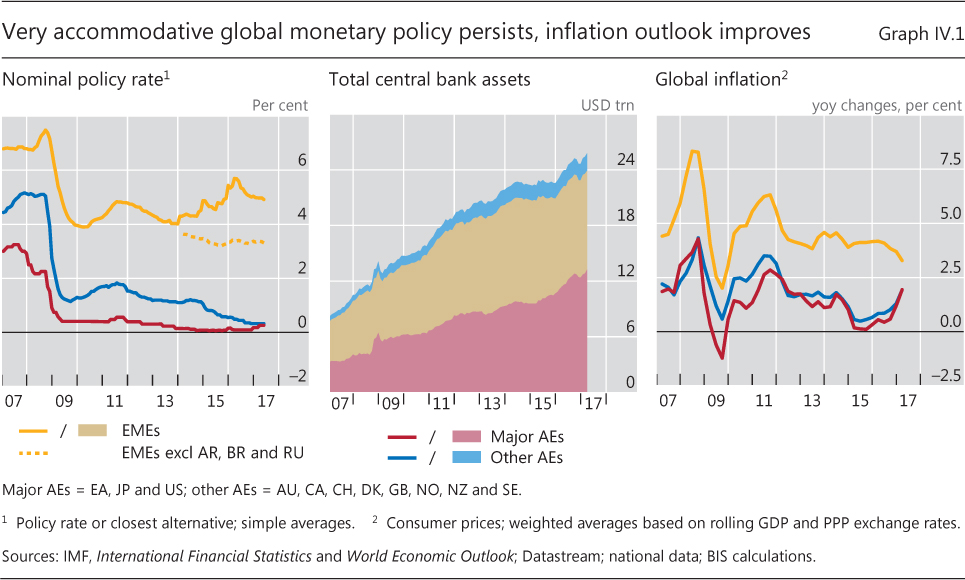
| IV.1 | Very accommodative global monetary policy persists, inflation outlook improves | p 60 |
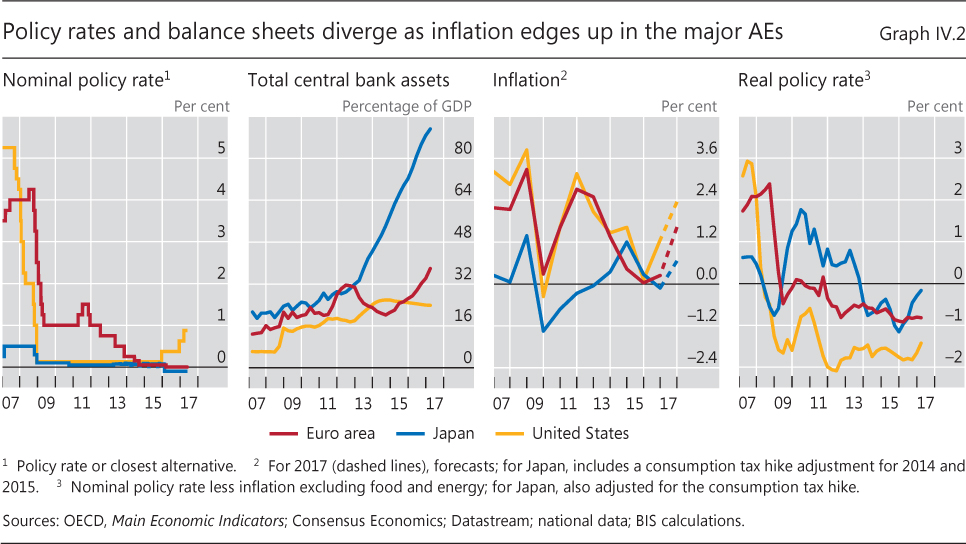
| IV.2 | Policy rates and balance sheets diverge as inflation edges up in the major AEs | p 61 |
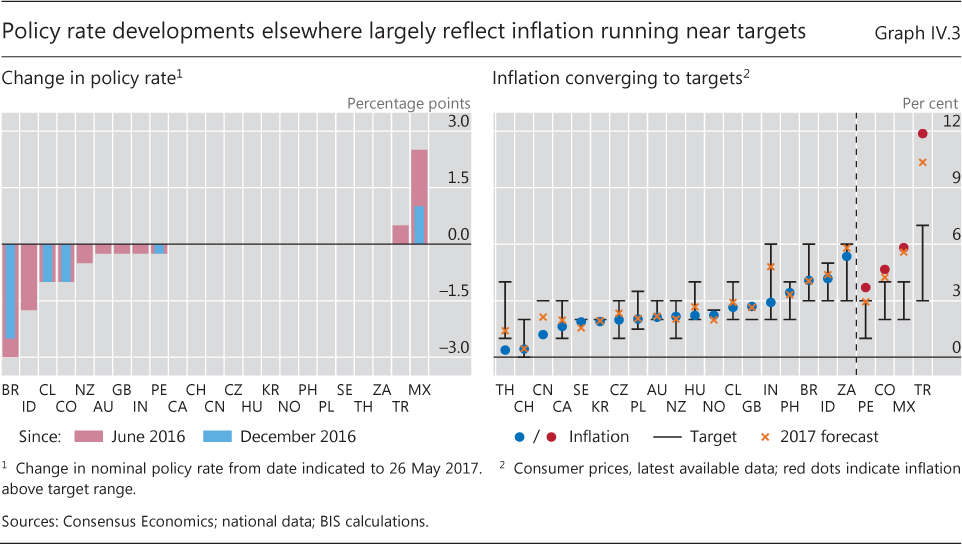
| IV.3 | Policy rate developments elsewhere largely reflect inflation running near targets | p 61 |
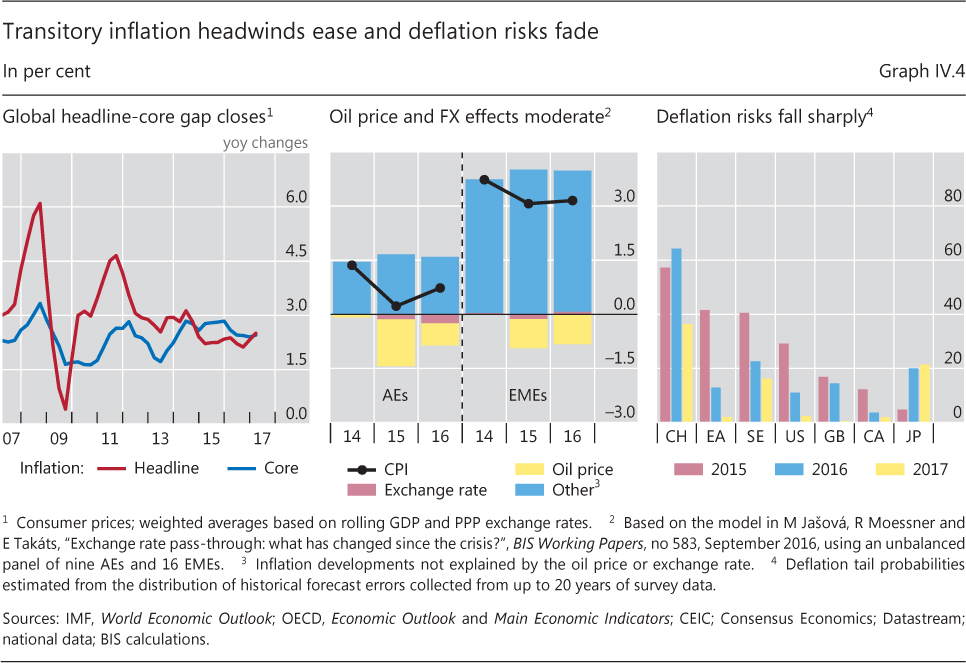
| IV.4 | Transitory inflation headwinds ease and deflation risks fade | p 63 |
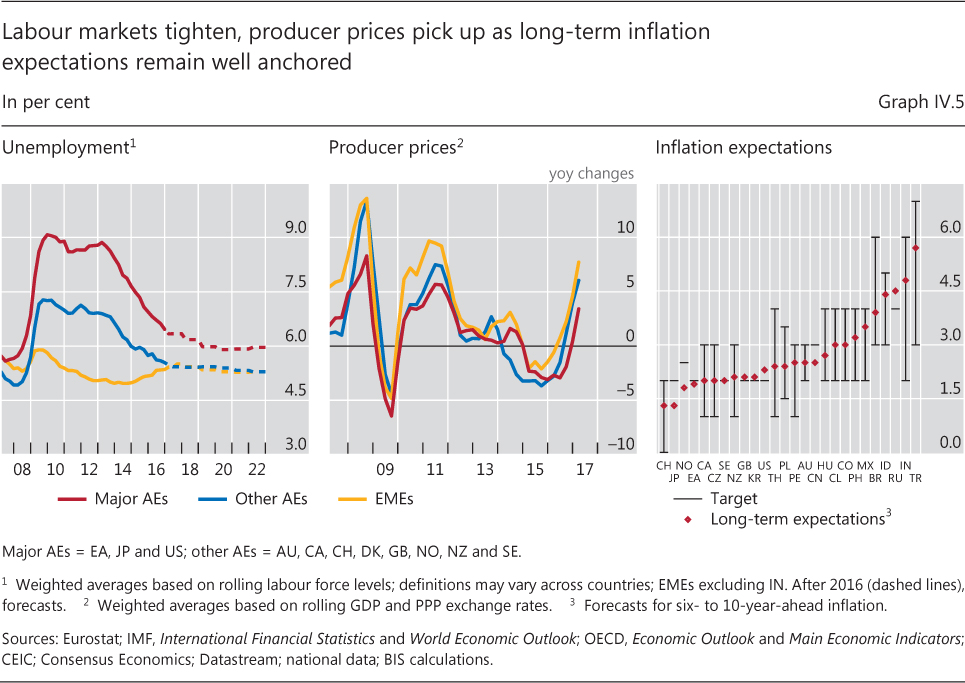
| IV.5 | Labour markets tighten, producer prices pick up as long-term inflation expectations remain well anchored | p 64 |
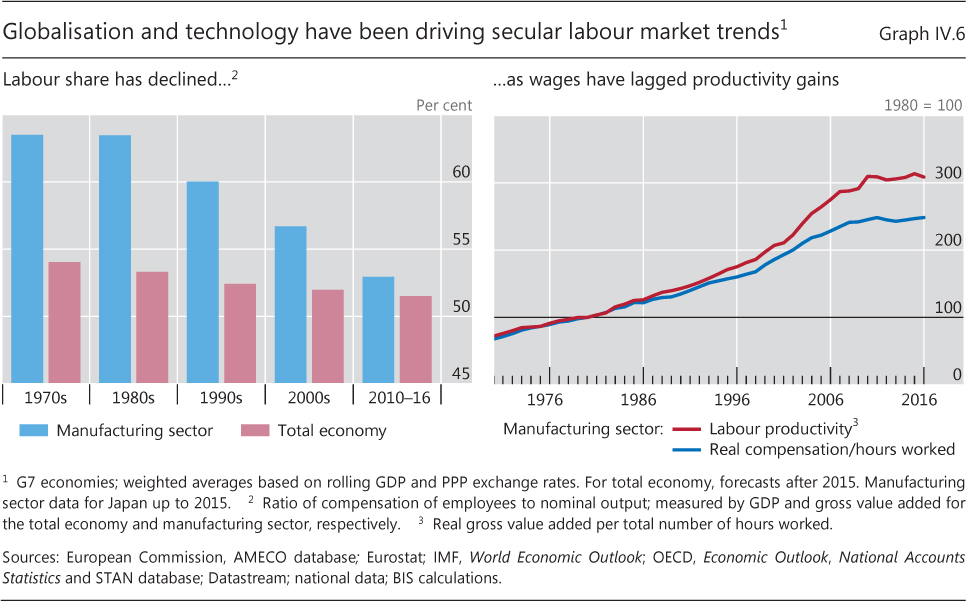
| IV.6 | Globalisation and technology have been driving secular labour market trends | p 65 |
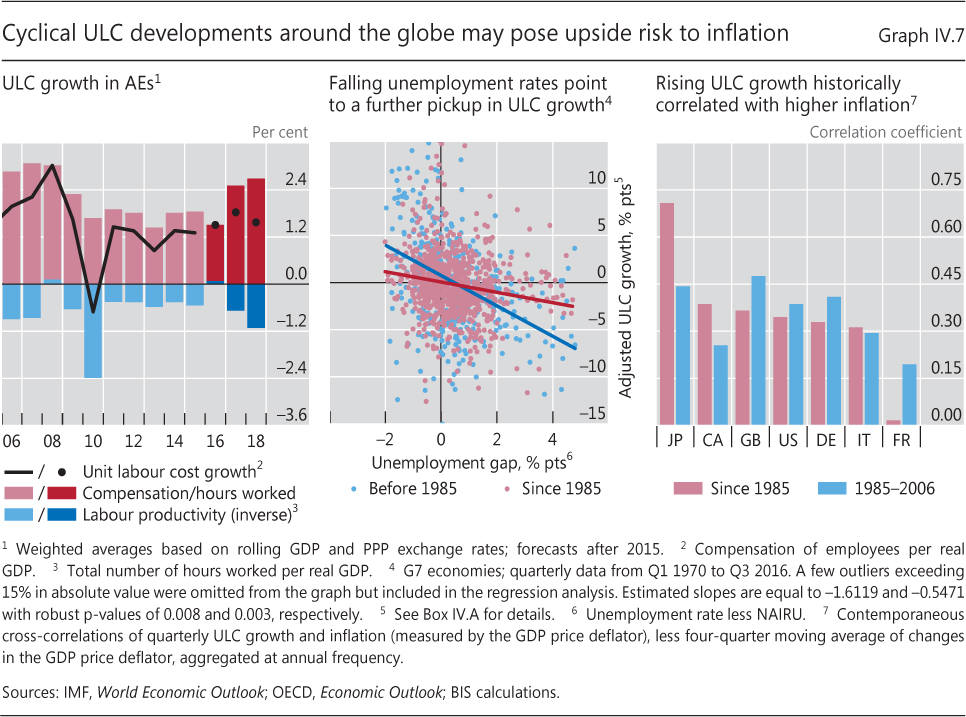
| IV.7 | Cyclical ULC developments around the globe may pose upside risk to inflation | p 66 |
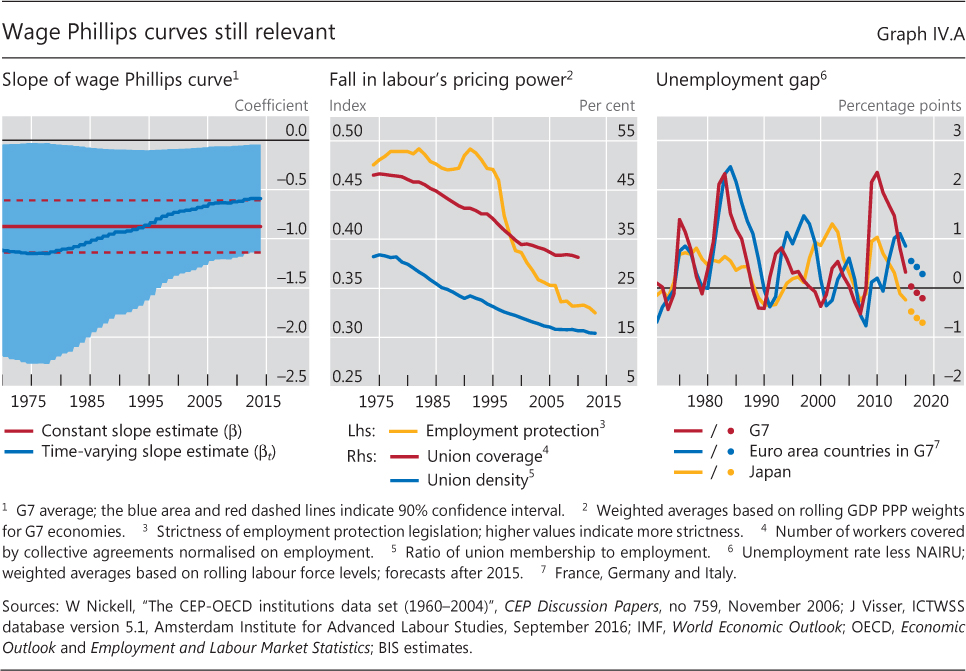
| IV.A | Wage Phillips curves still relevant | p 67 |
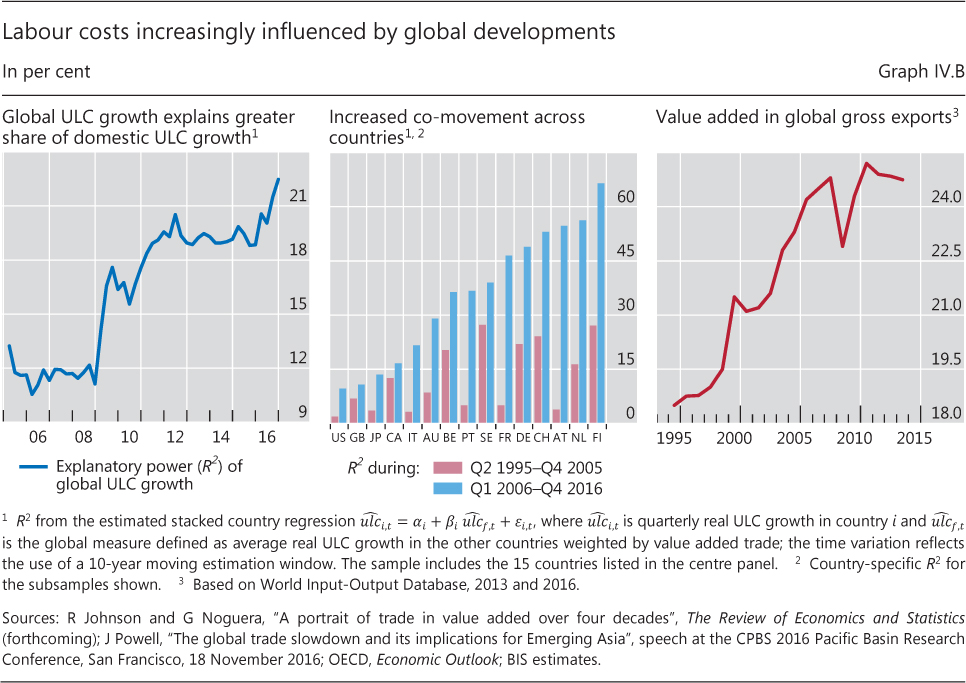
| IV.B | Labour costs increasingly influenced by global developments | p 69 |
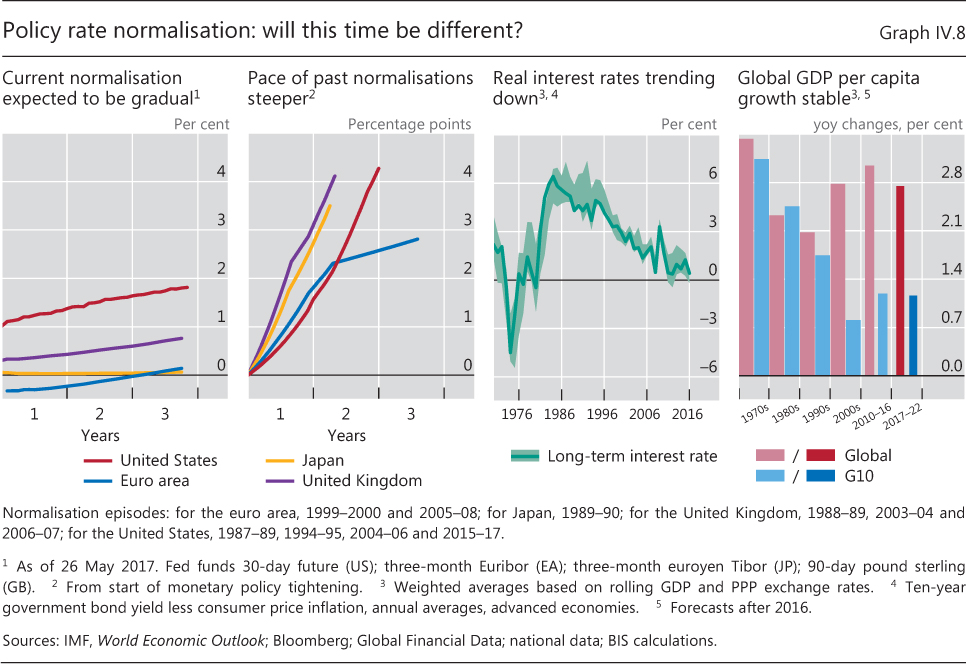
| IV.8 | Policy rate normalisation: will this time be different? | p 70 |
| Chapter V: data behind the graphs (xlsx) | ||
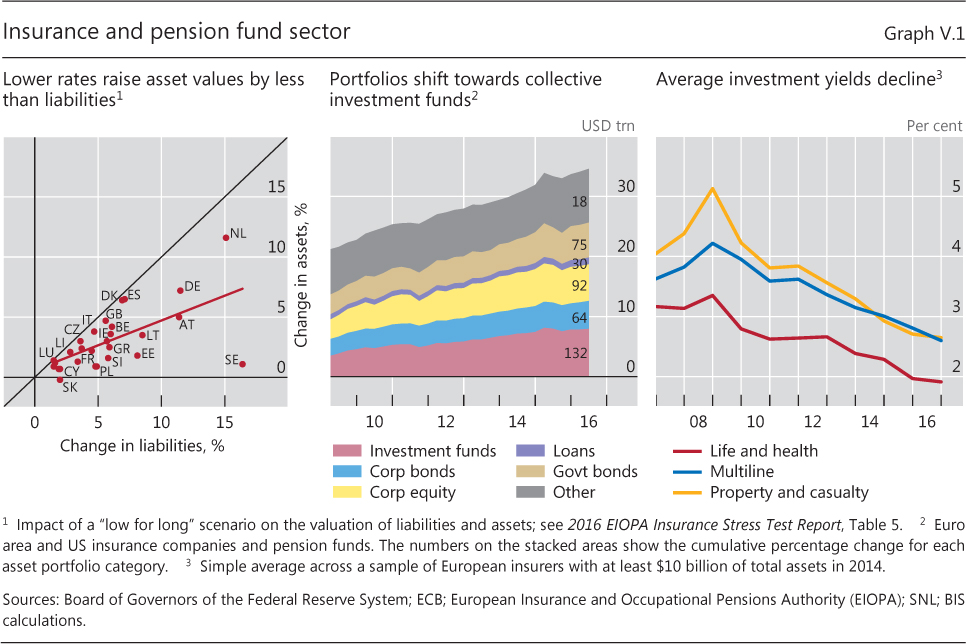
| V.1 | Insurance and pension fund sector | p 82 |
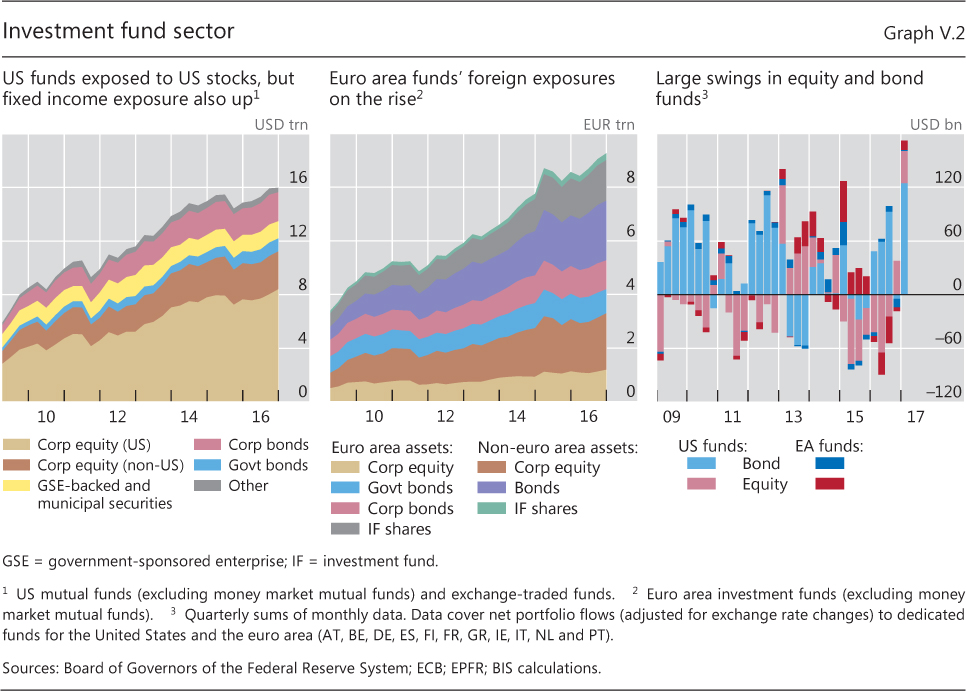
| V.2 | Investment fund sector | p 83 |
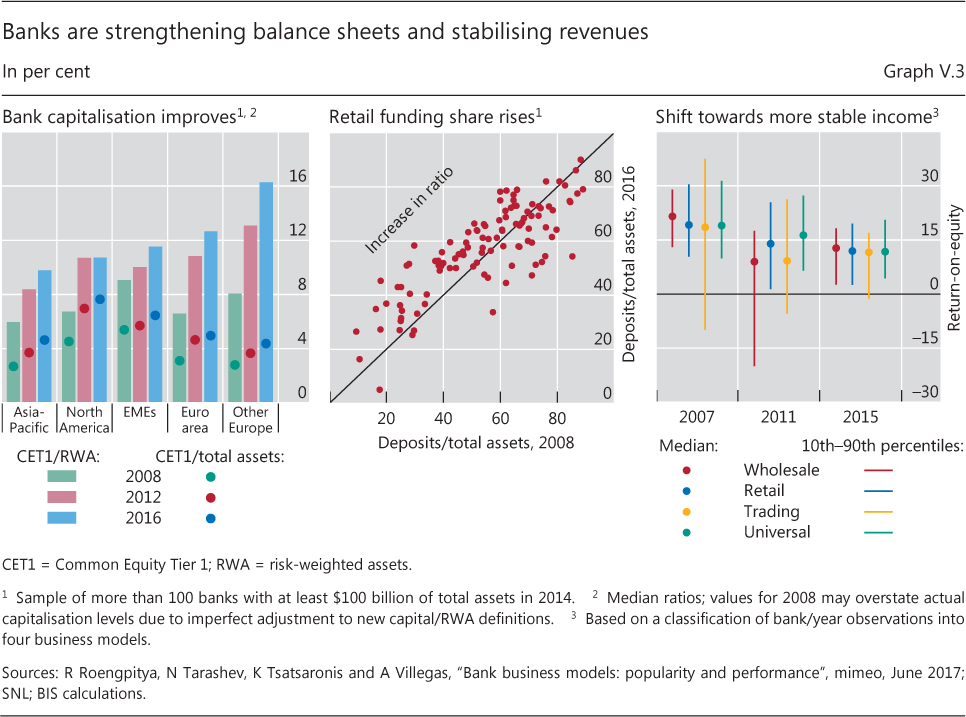
| V.3 | Banks are strengthening balance sheets and stabilising revenues | p 84 |
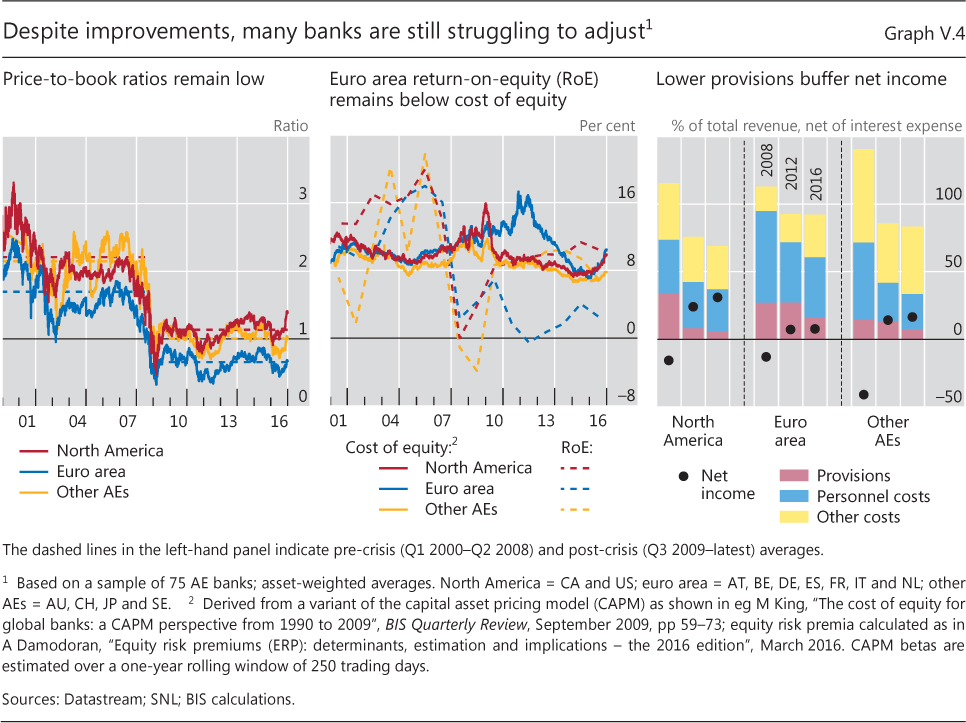
| V.4 | Despite improvements, many banks are still struggling to adjust | p 85 |
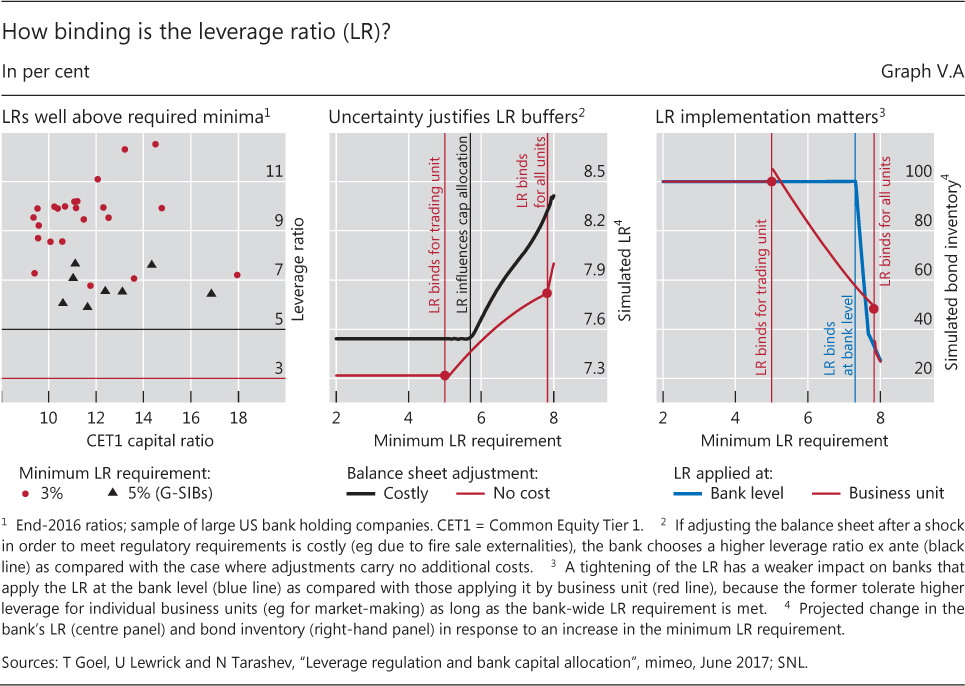
| V.A | How binding is the leverage ratio (LR)? | p 87 |
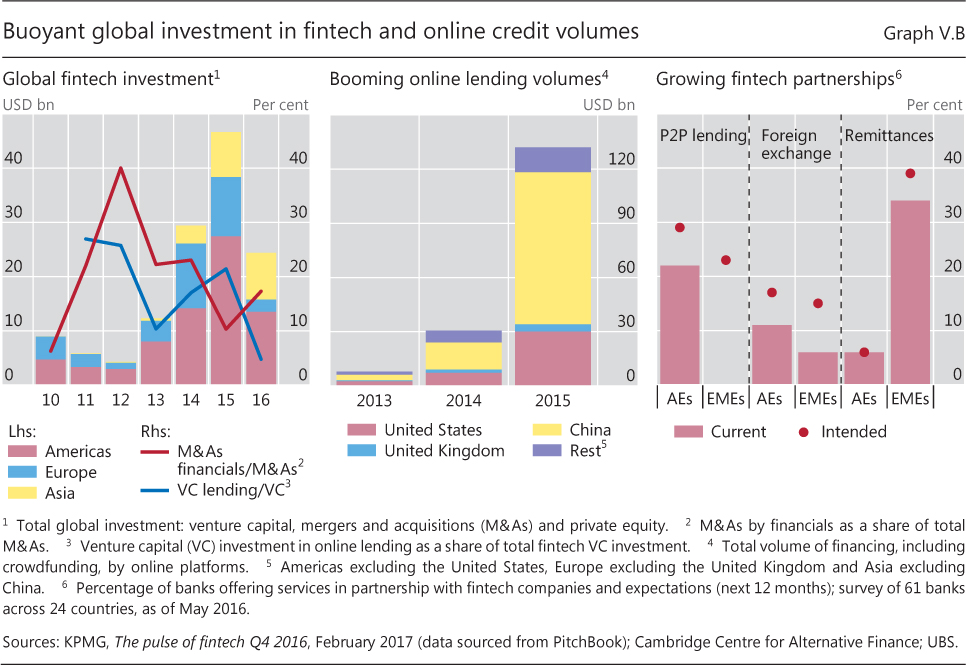
| V.B | Buoyant global investment in fintech and online credit volumes | p 88 |
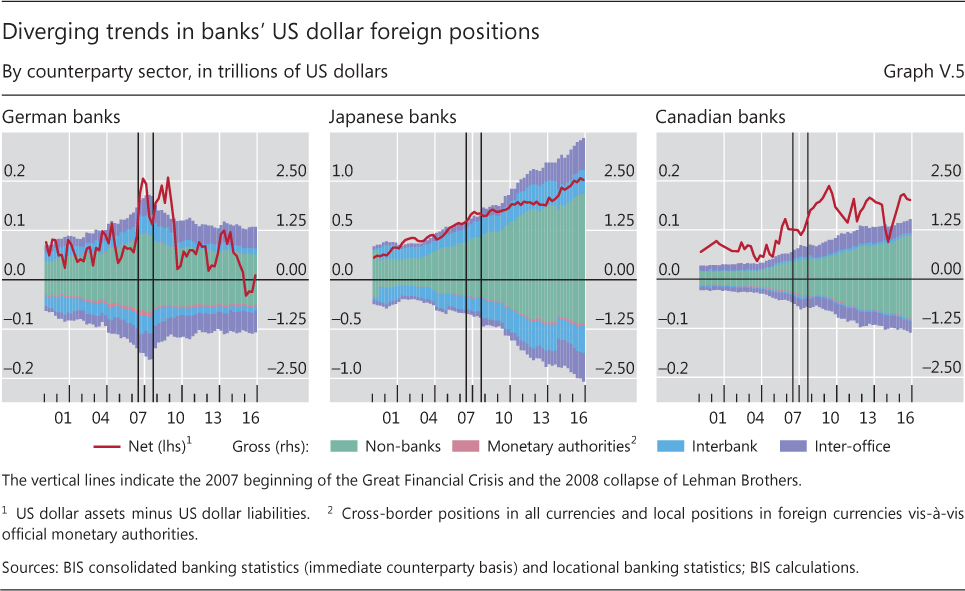
| V.5 | Diverging trends in banks' US dollar foreign positions | p 90 |
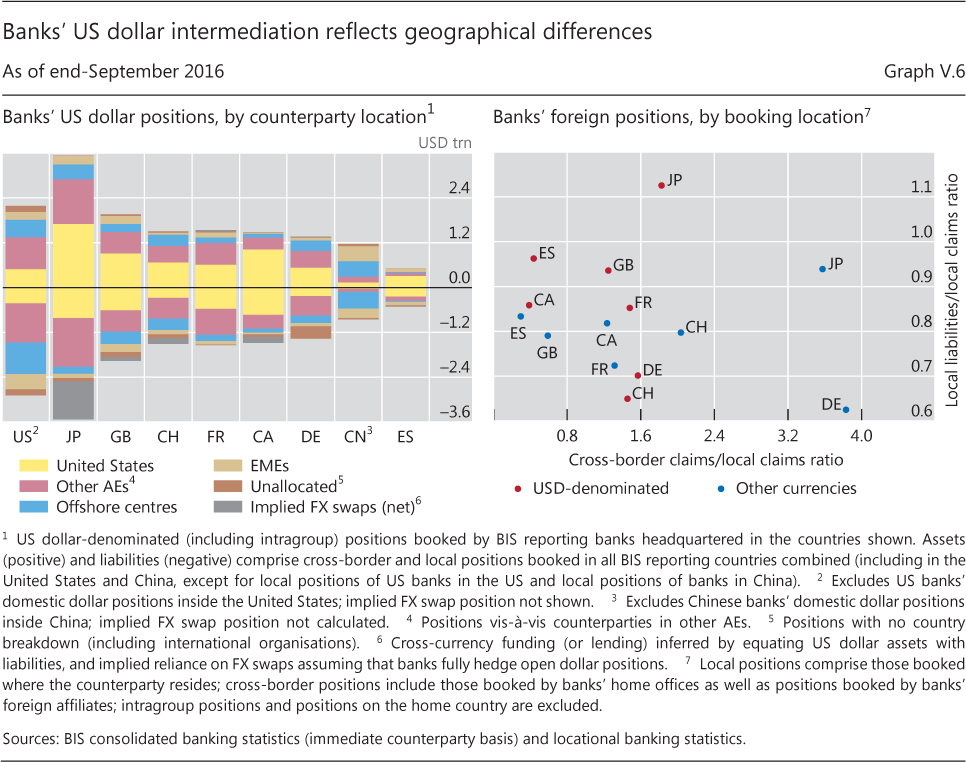
| V.6 | Banks' US dollar intermediation reflects geographical differences | p 91 |
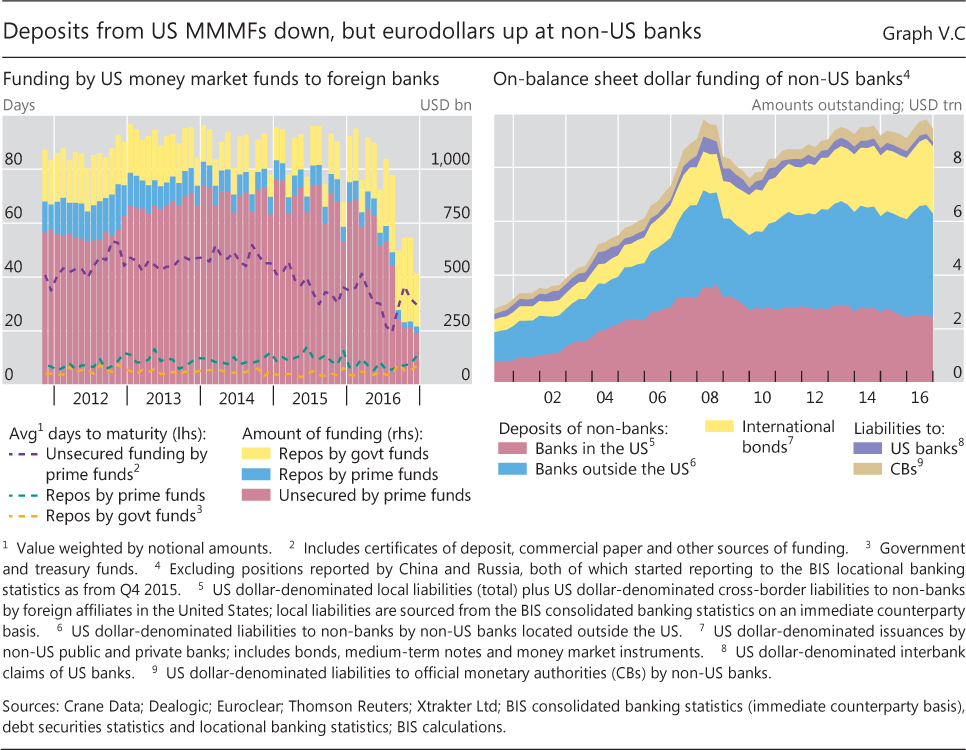
| V.C | Deposits from US MMMFs down, but eurodollars up at non-US banks | p 92 |
| Chapter VI: data behind the graphs (xlsx) | ||
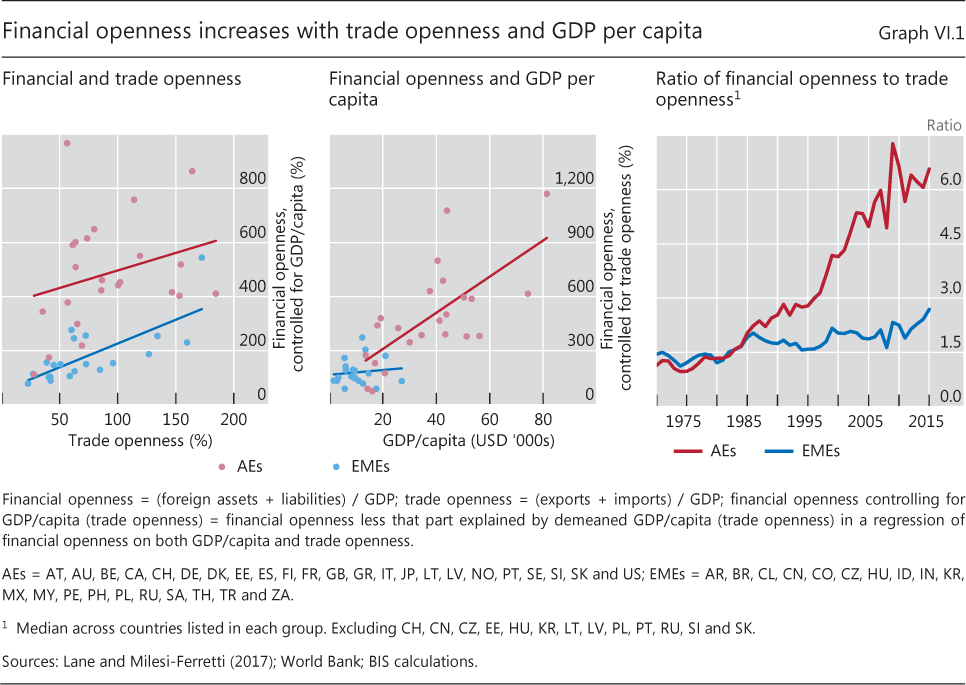
| VI.1 | Financial openness increases with trade openness and GDP per capita | p 98 |
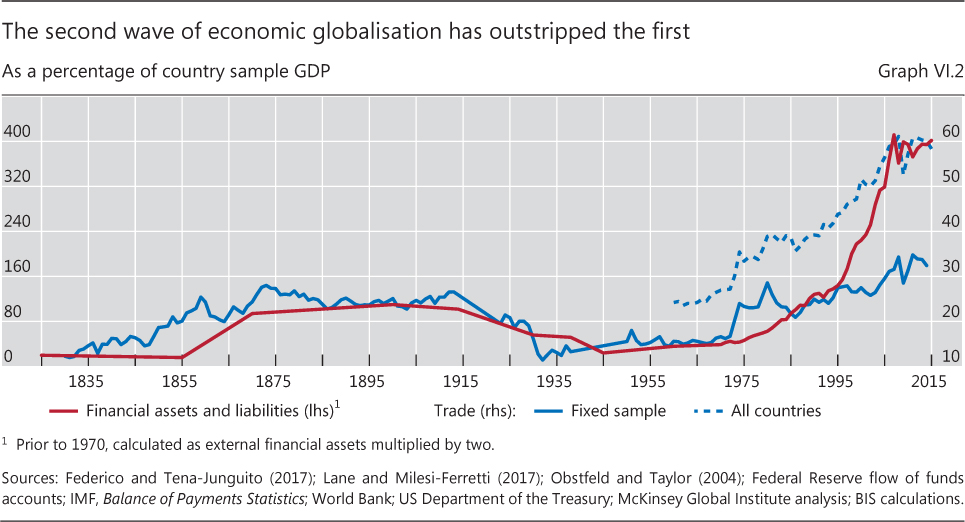
| VI.2 | The second wave of economic globalisation has outstripped the first | p 100 |
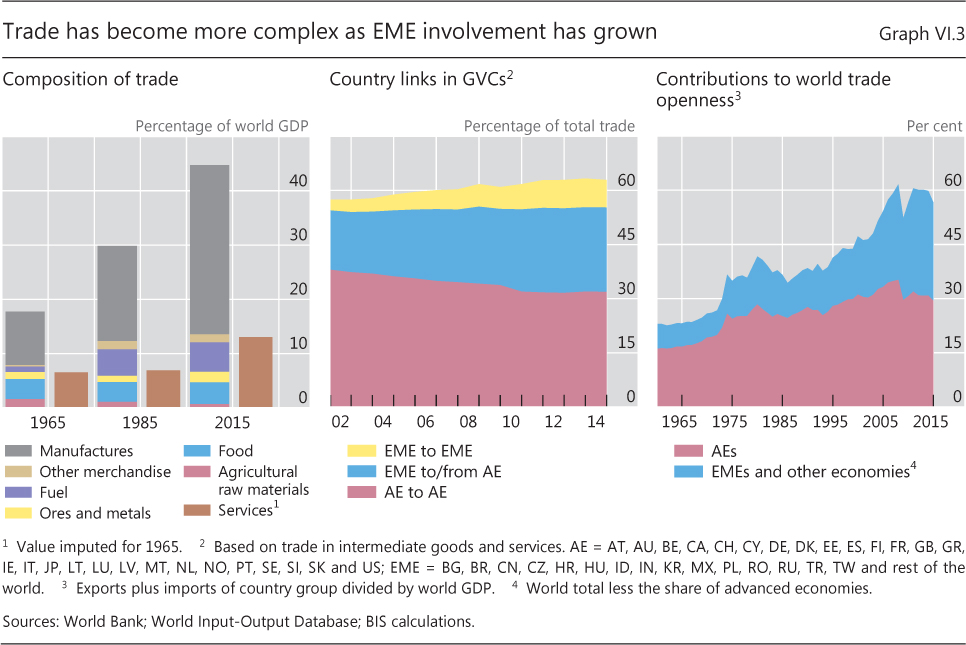
| VI.3 | Trade has become more complex as EME involvement has grown | p 101 |
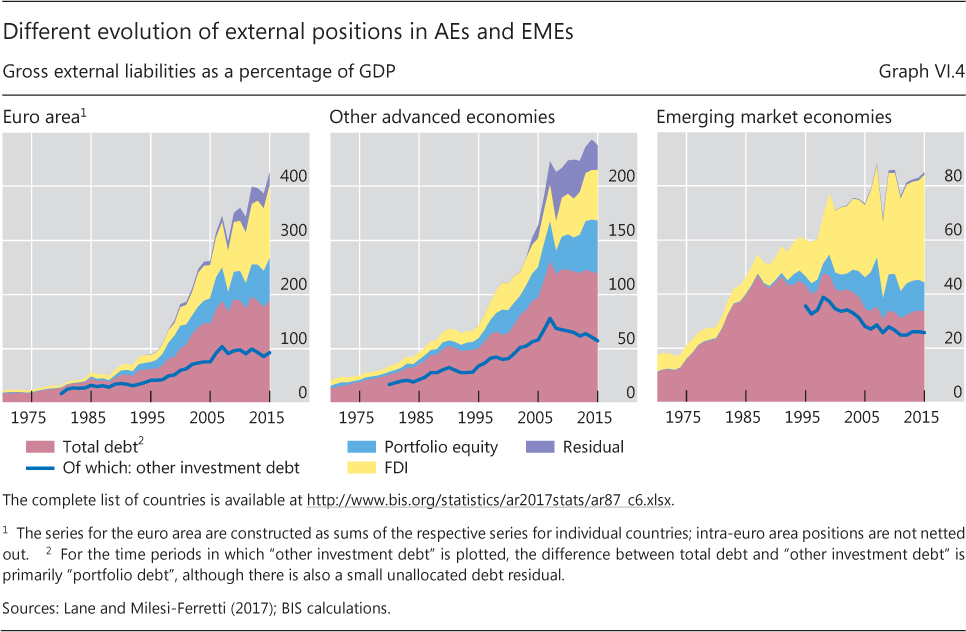
| VI.4 | Different evolution of external positions in AEs and EMEs | p 103 |
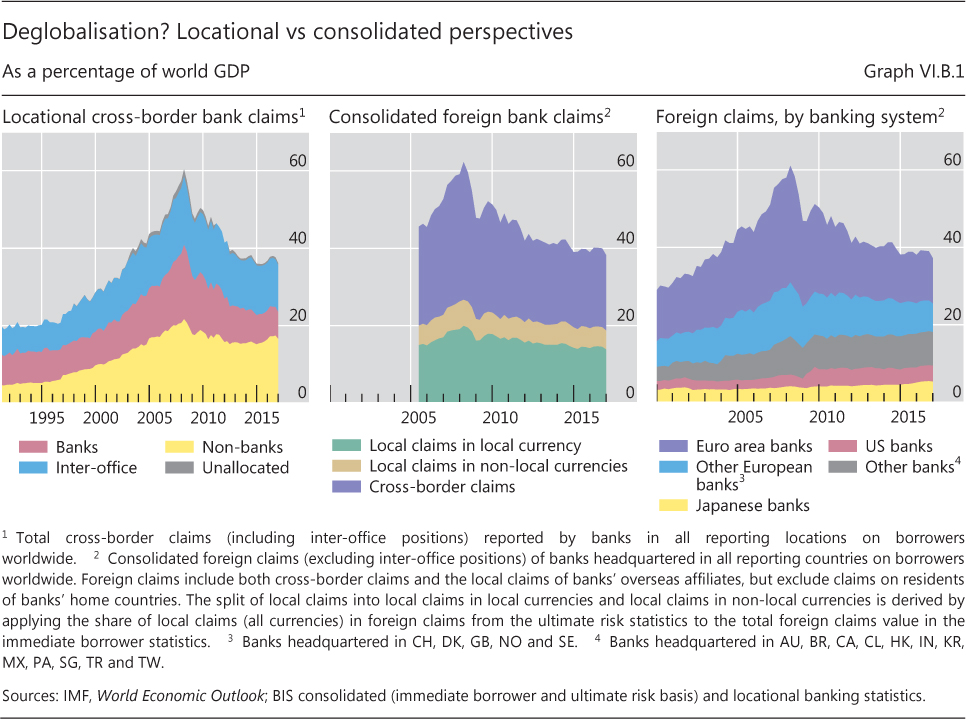
| VI.B.1 | Deglobalisation? Locational vs consolidated perspectives | p 106 |
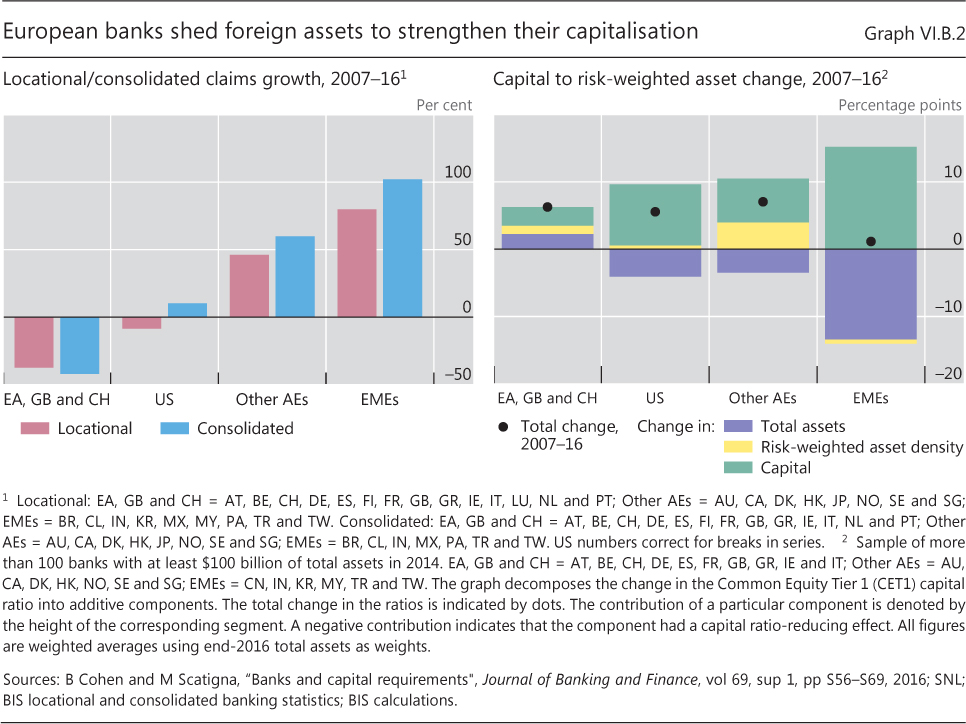
| VI.B.2 | European banks shed foreign assets to strengthen their capitalisation | p 107 |
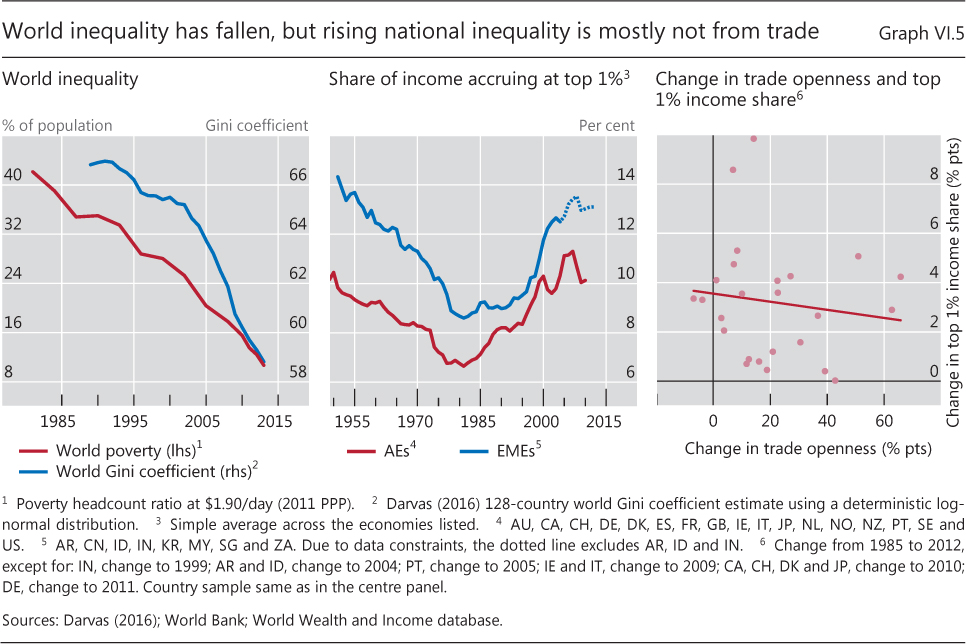
| VI.5 | World inequality has fallen, but rising national inequality is mostly not from trade | p 108 |
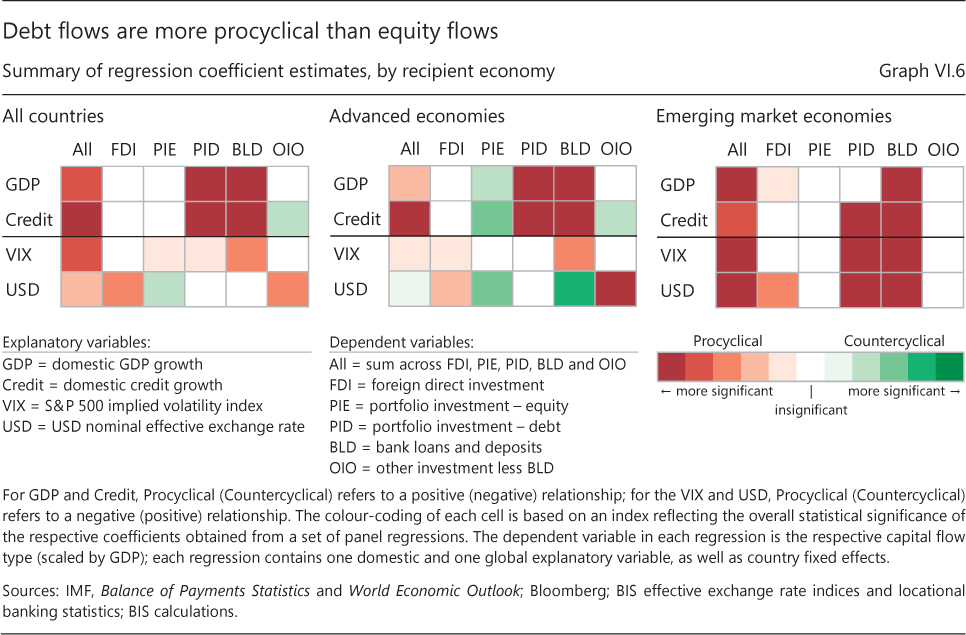
| VI.6 | Debt flows are more procyclical than equity flows | p 111 |
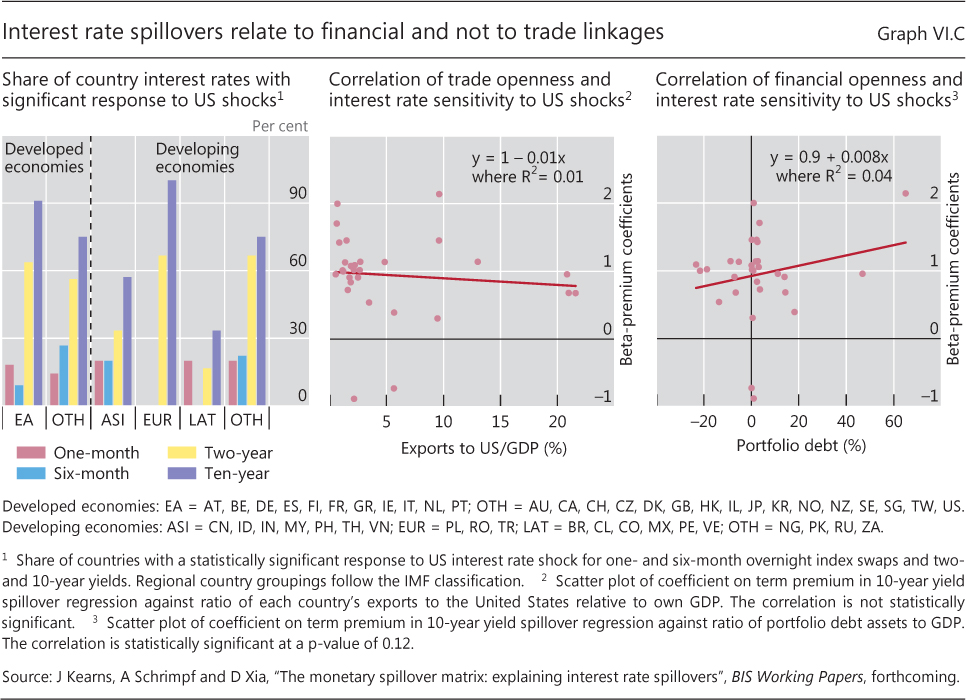
| VI.C | Interest rate spillovers relate to financial and not to trade linkages | p 114 |