86th Annual Report, 2015/16 - Statistics associated with the graphs
Series description is to be found in the corresponding graph, that is linked in the right side column.
Download all statistics (zipped XLSX, 1.5 MB).
Graphs |
||
| Chapter I: data behind the graph (xlsx) | ||
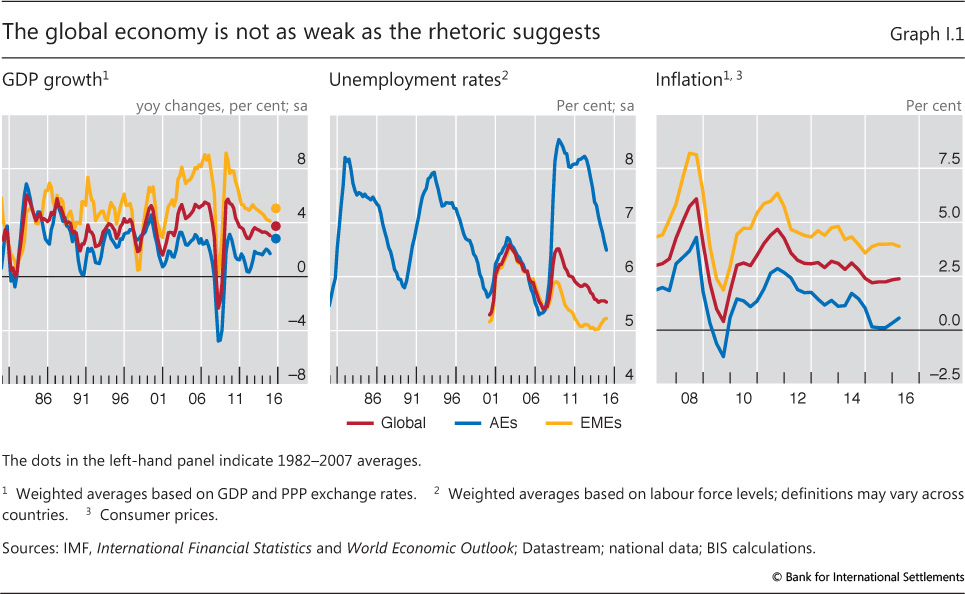
| I.1 | The global economy is not as weak as the rhetoric suggests | p 7 |
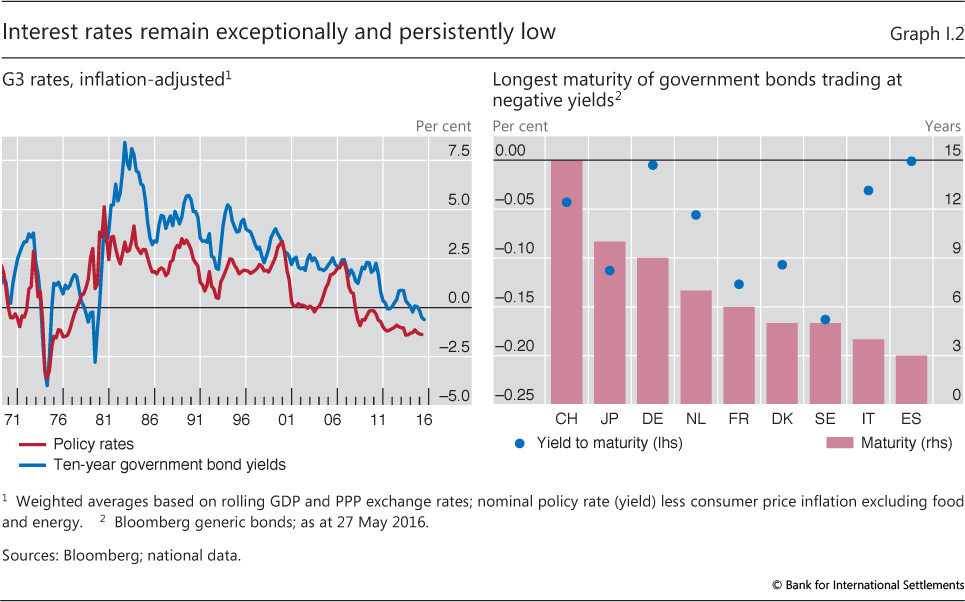
| I.2 | Interest rates remain exceptionally and persistently low | p 8 |
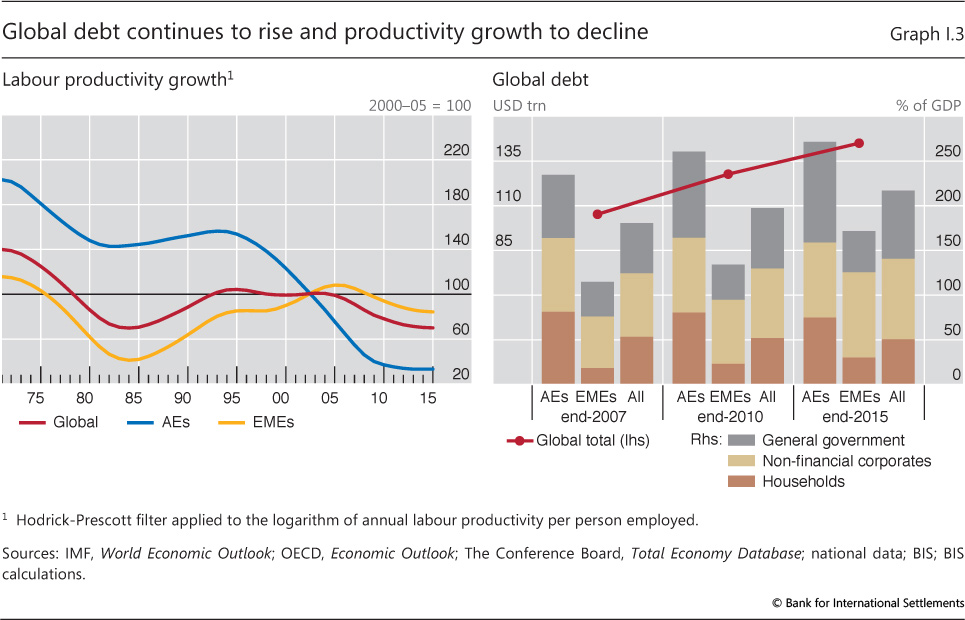
| I.3 | Global debt continues to rise and productivity growth to decline | p 10 |
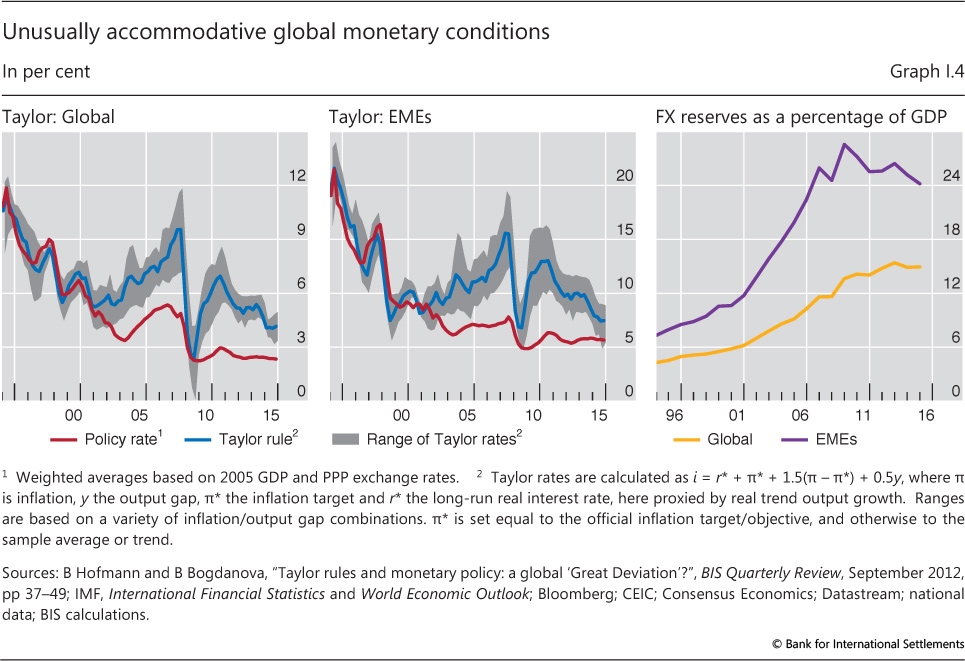
| I.4 | Unusually accommodative global monetary conditions | p 12 |
| Chapter II: data behind the graphs (xlsx) | ||
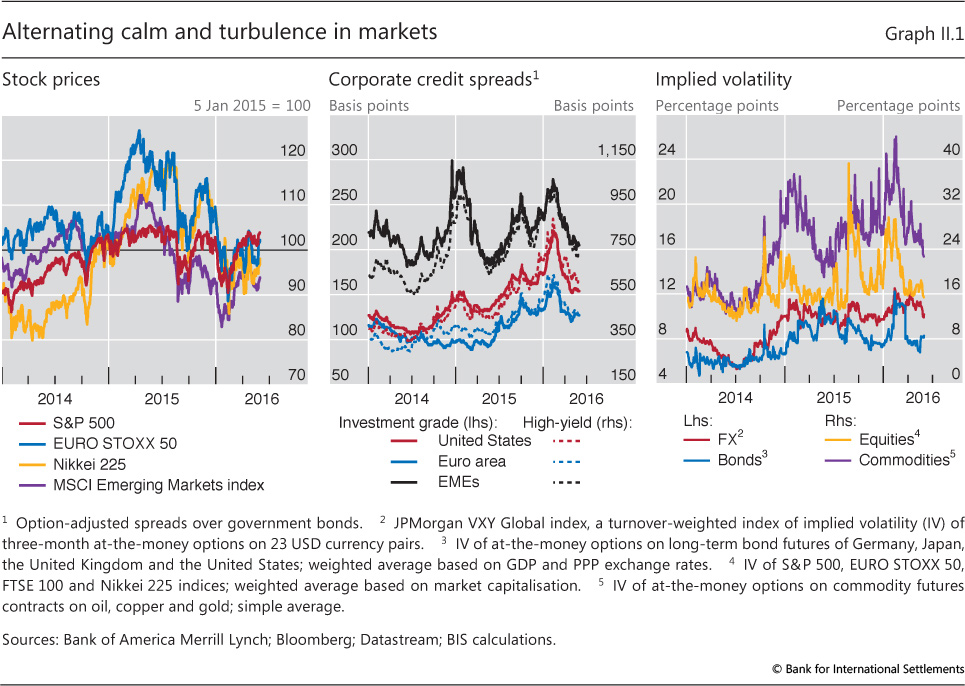
| II.1 | Alternating calm and turbulence in markets | p 26 |
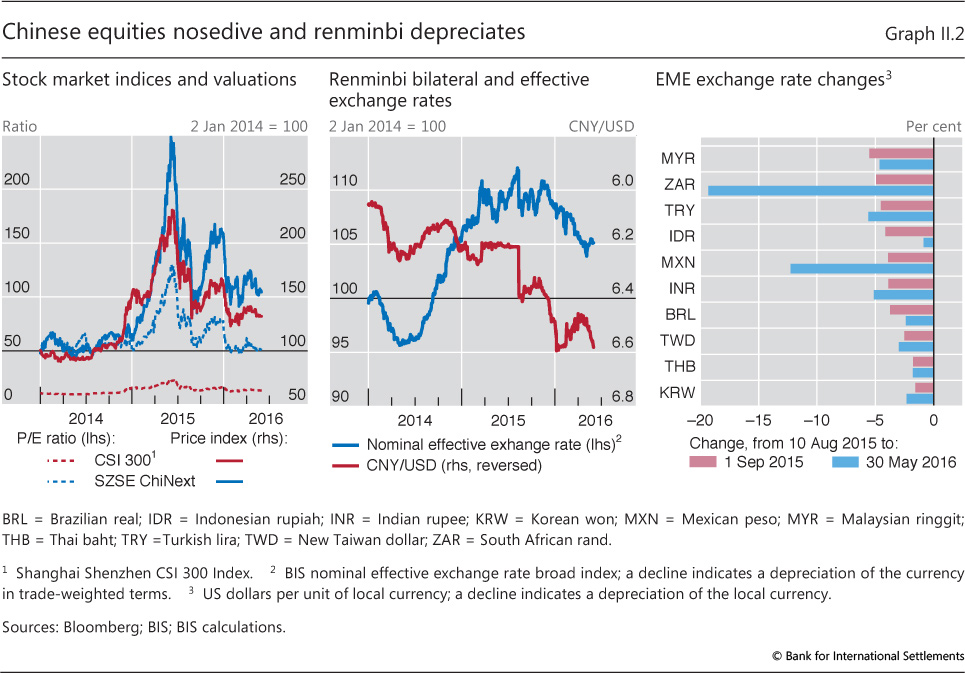
| II.2 | Chinese equities nosedive and renminbi depreciates | p 27 |
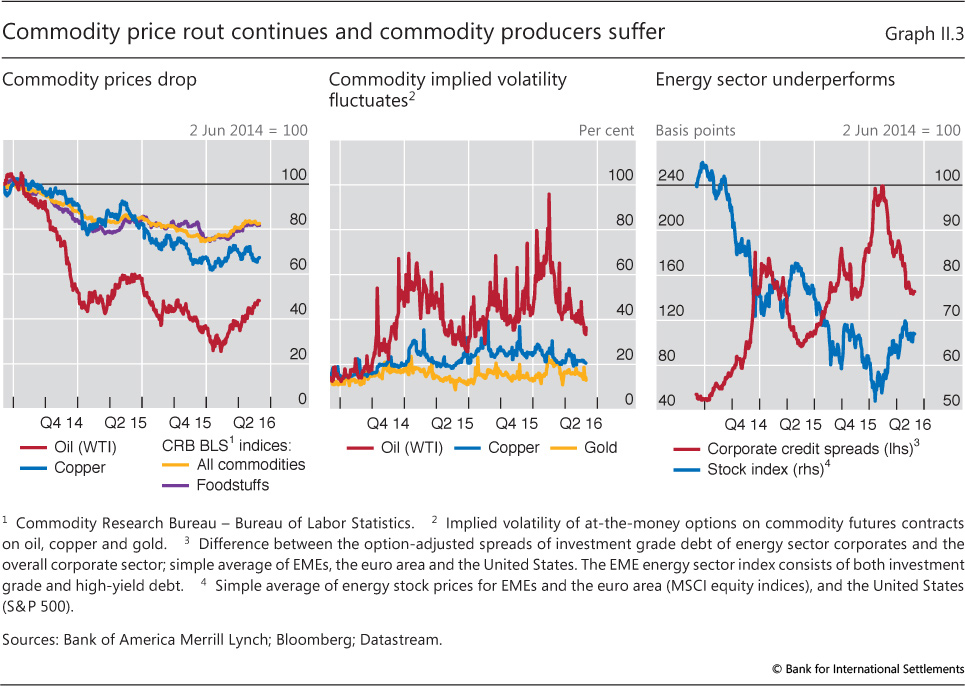
| II.3 | Commodity price rout continues and commodity producers suffer | p 27 |
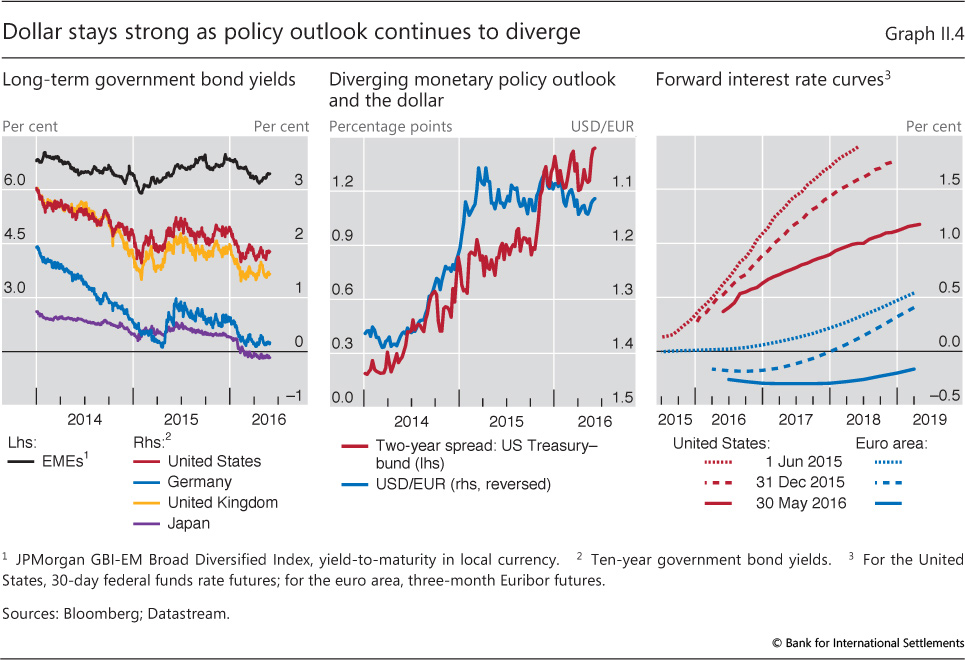
| II.4 | Dollar stays strong as policy outlook continues to diverge | p 28 |
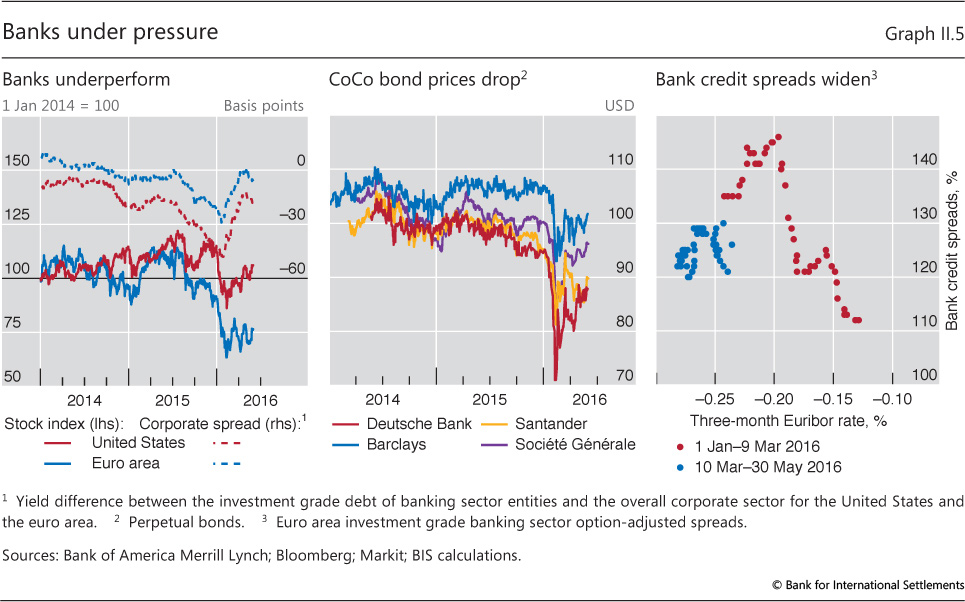
| II.5 | Banks under pressure | p 29 |
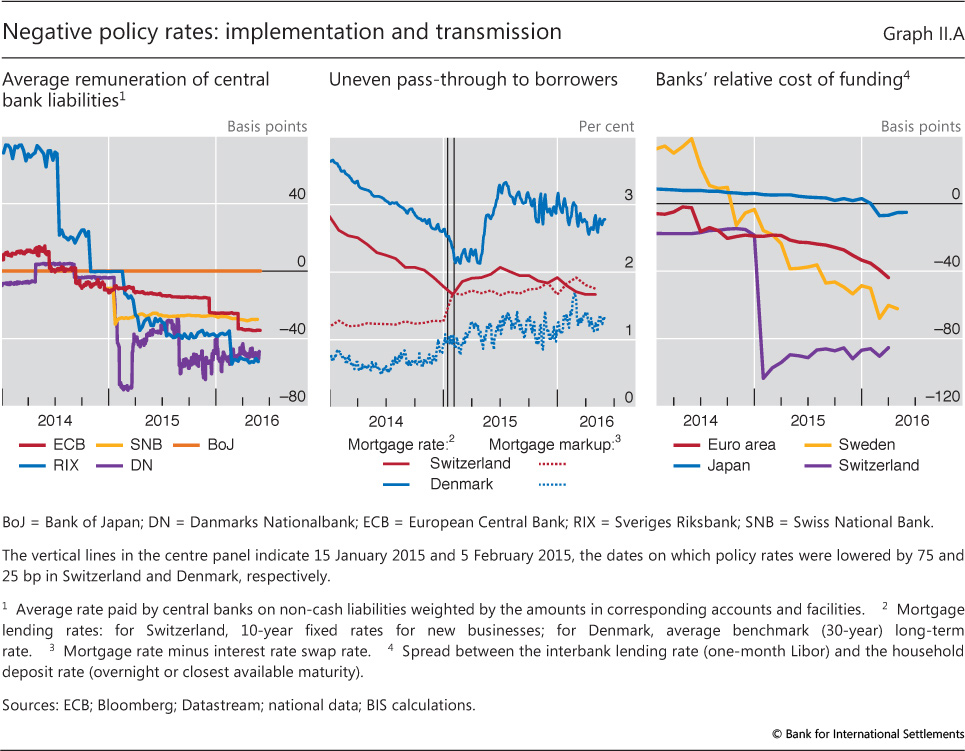
| II.A | Negative policy rates: implementation and transmission | p 30 |
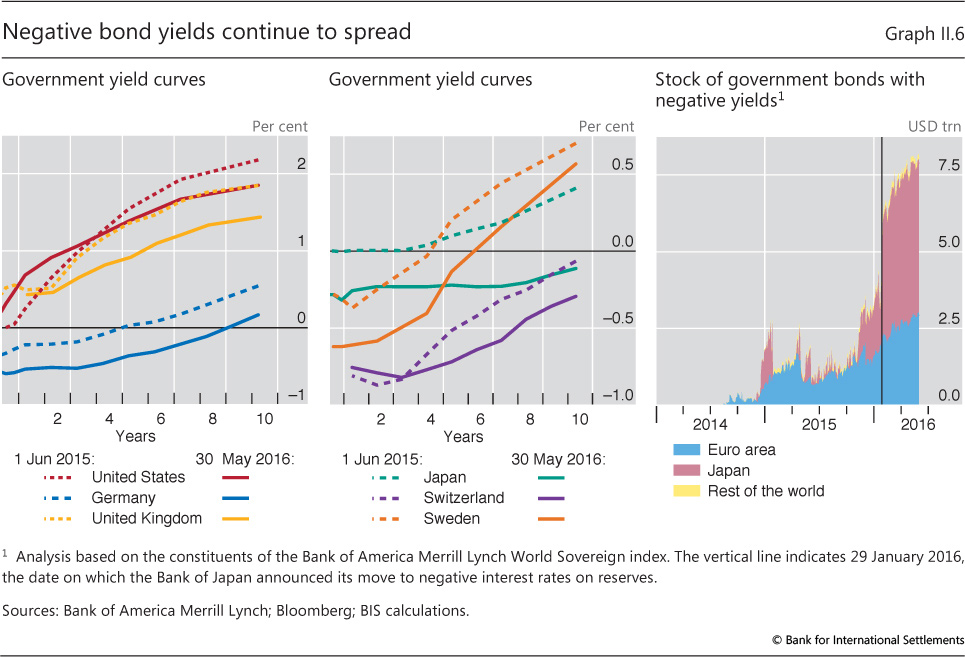
| II.6 | Negative bond yields continue to spread | p 31 |
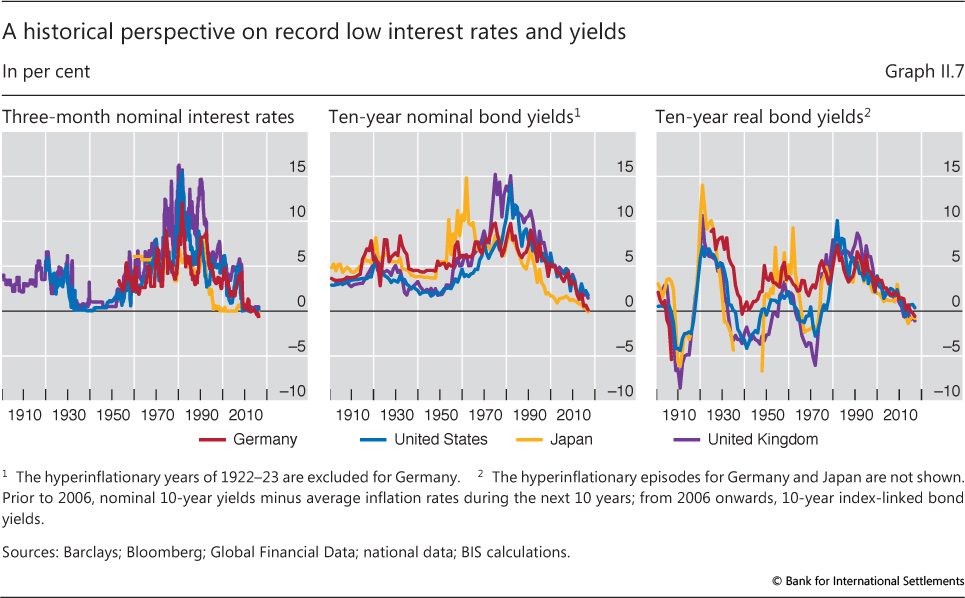
| II.7 | A historical perspective on record low interest rates and yields | p 32 |
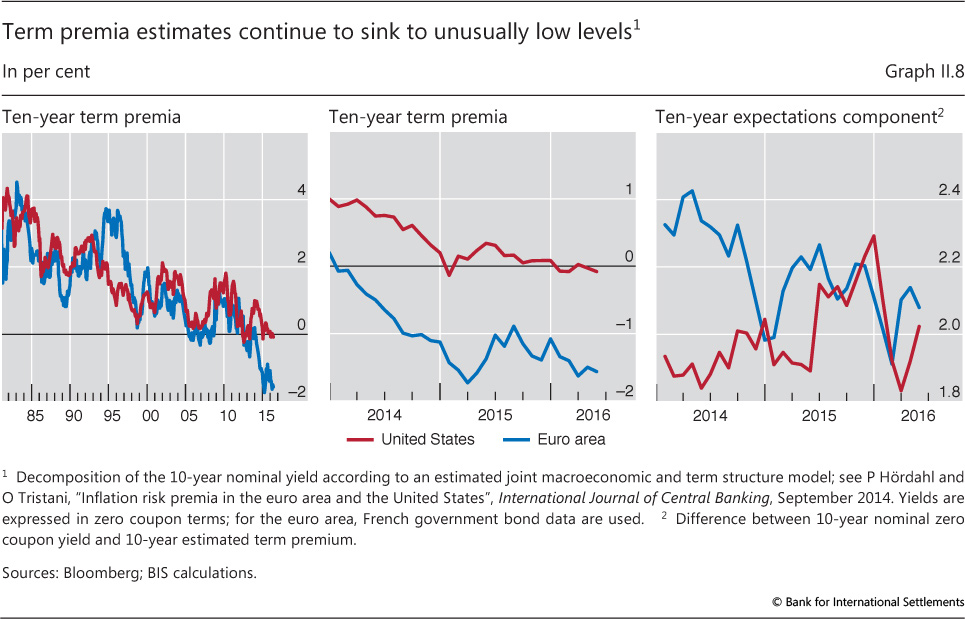
| II.8 | Term premia estimates continue to sink to unusually low levels | p 33 |
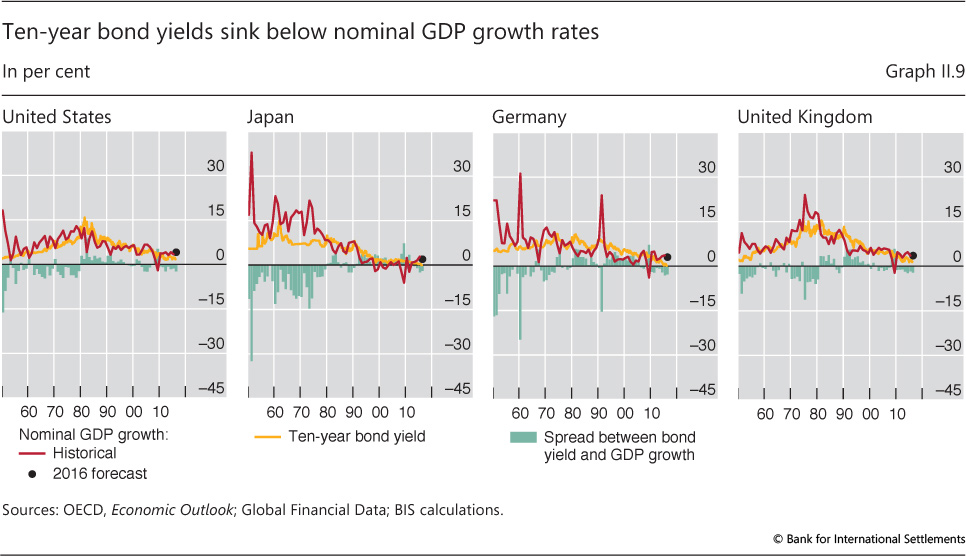
| II.9 | Ten-year bond yields sink below nominal GDP growth rates | p 34 |
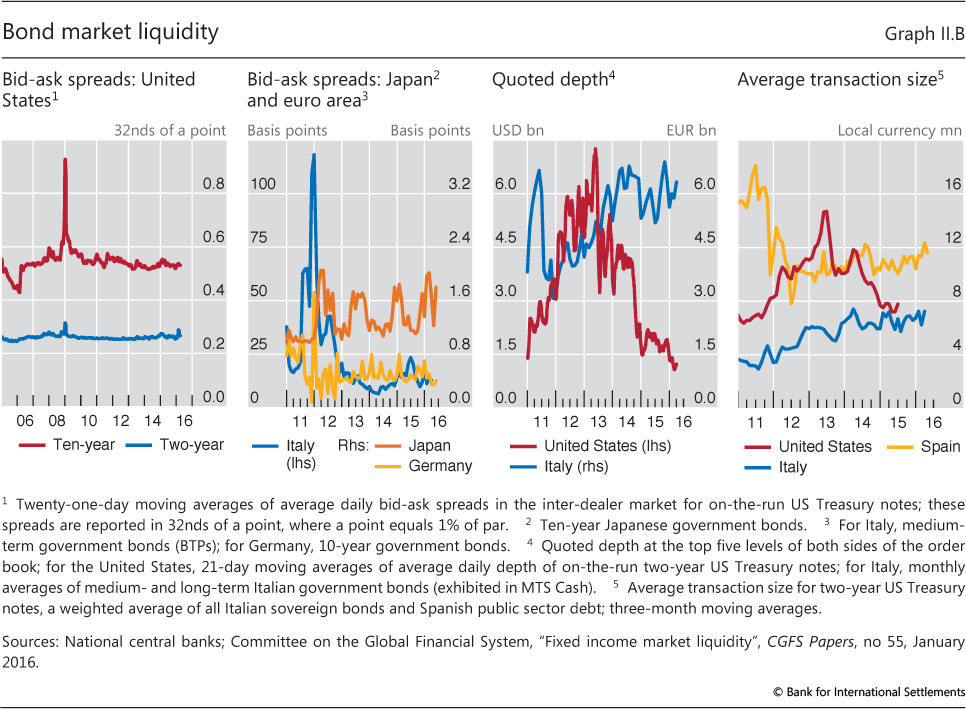
| II.B | Bond market liquidity | p 35 |
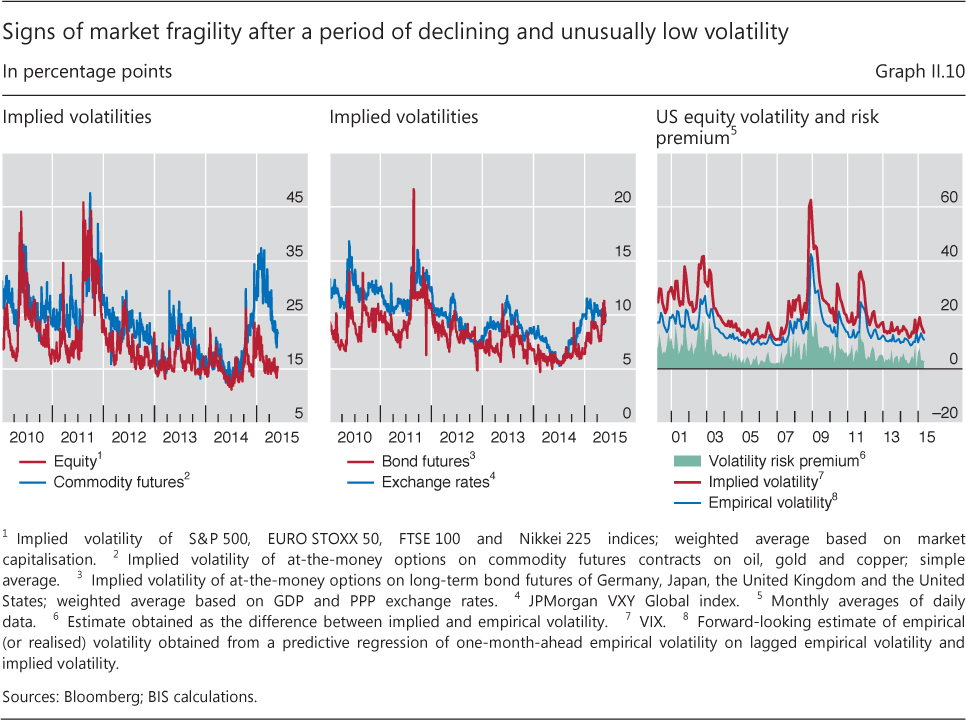
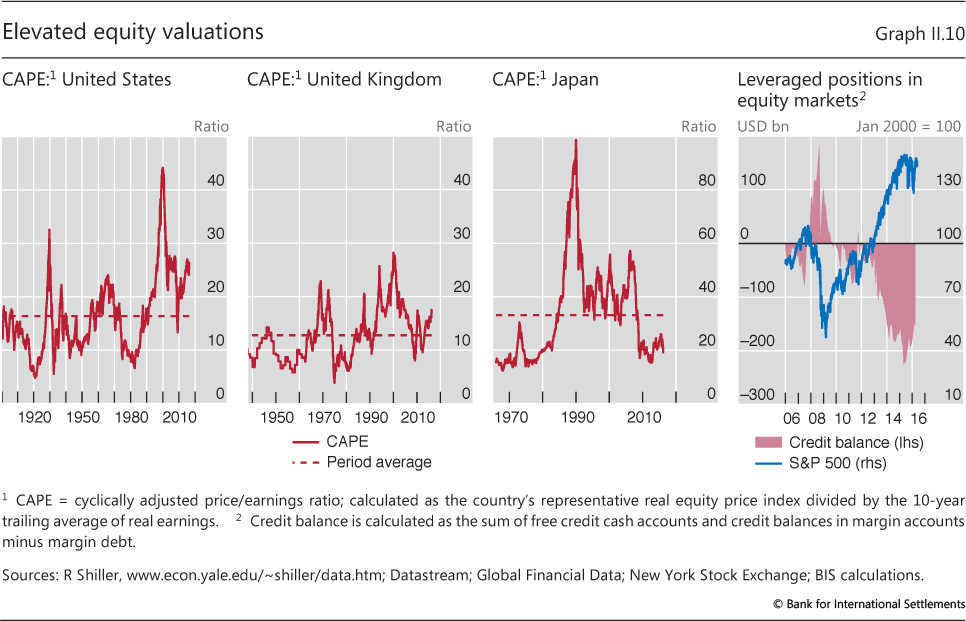
| II.10 | Elevated equity valuations | p 36 |
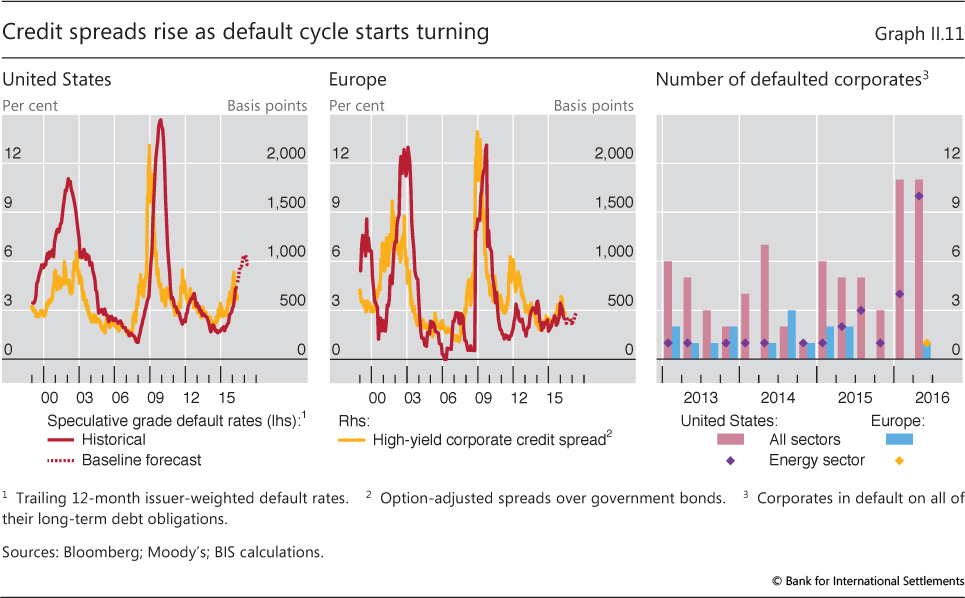
| II.11 | Credit spreads rise as default cycle starts turning | p 37 |
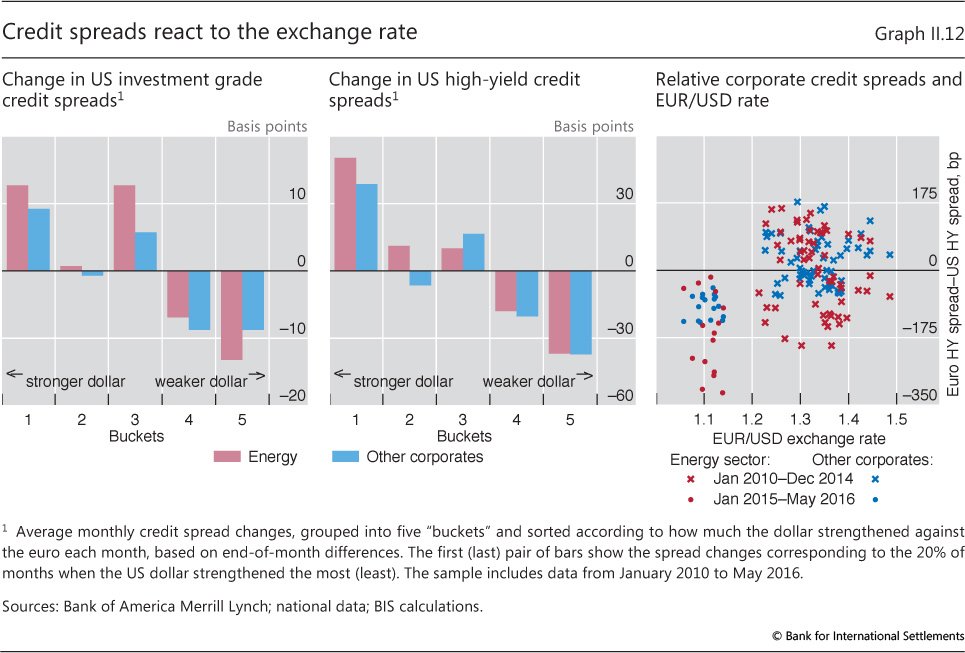
| II.12 | Credit spreads react to the exchange rate | p 38 |
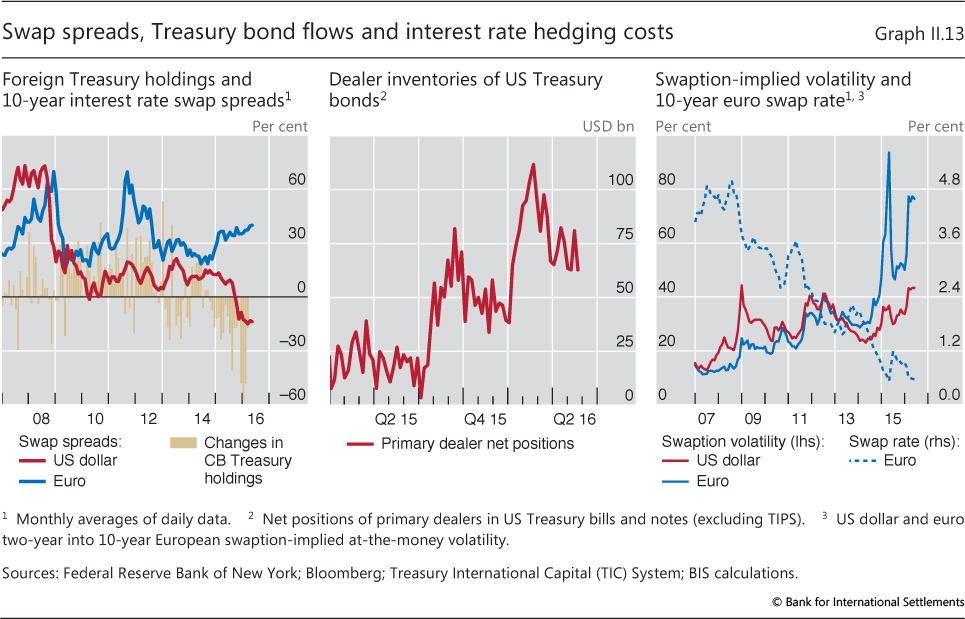
| II.13 | Swap spreads, Treasury bond flows and interest rate hedging costs | p 39 |
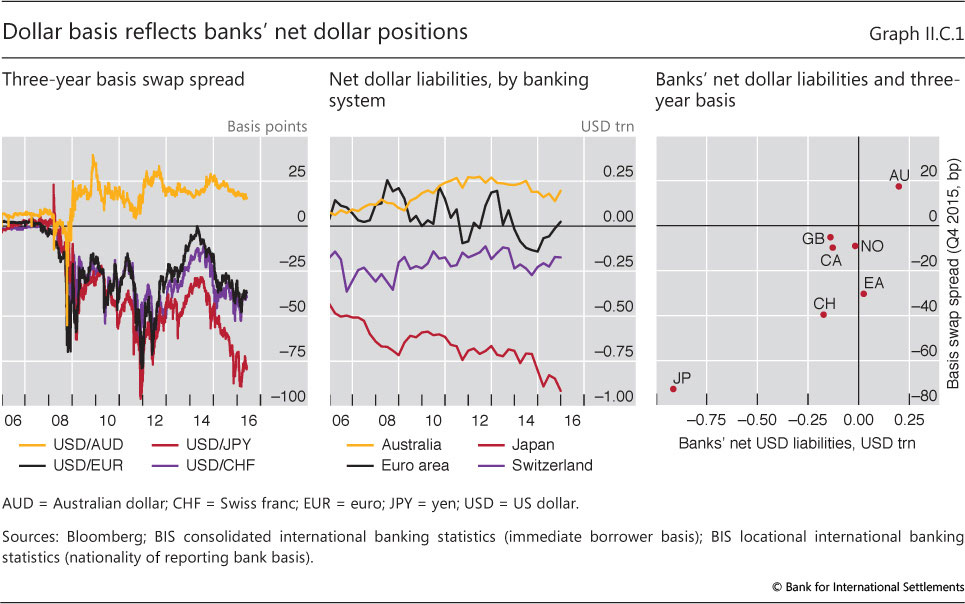
| II.C.1 | Dollar basis reflects banks' net dollar positions | p 40 |
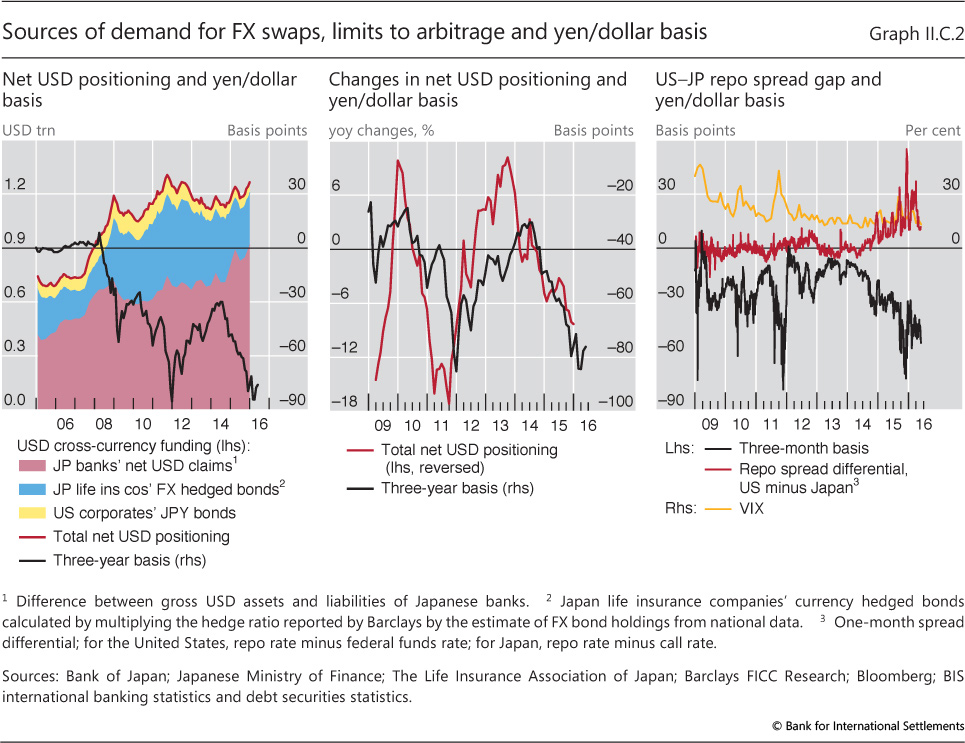
| II.C.2 | Sources of demand for FX swaps, limits to arbitrage and yen/dollar basis | p 41 |
| Chapter III: data behind the graphs (xlsx) | ||
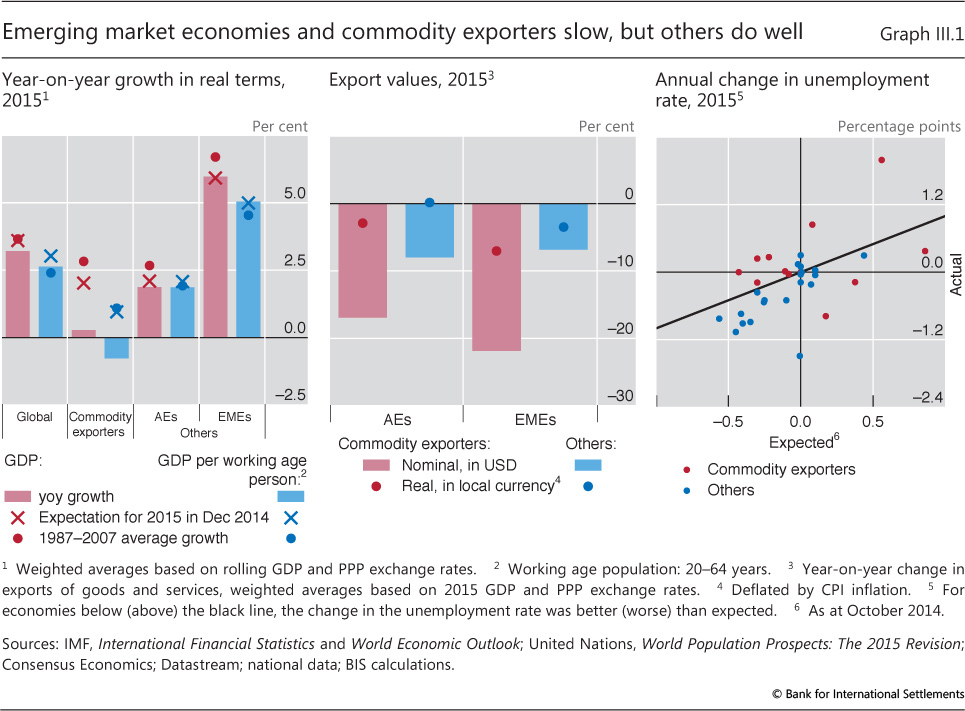
| III.1 | Emerging market economies and commodity exporters slow, but others do well | p 44 |
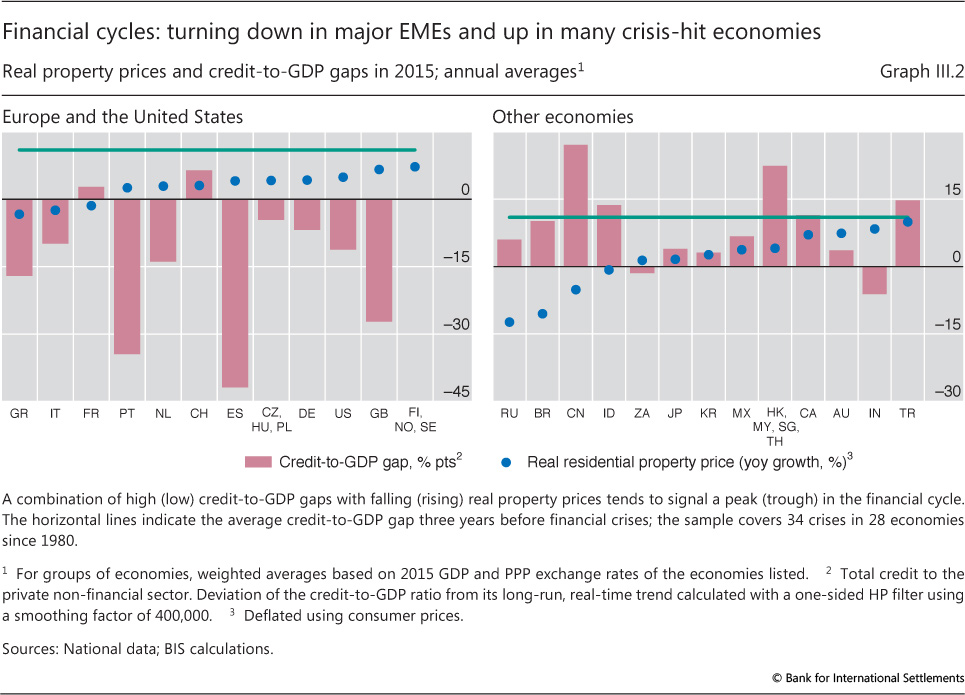
| III.2 | Financial cycles: turning down in major EMEs and up in many crisis-hit economies | p 45 |
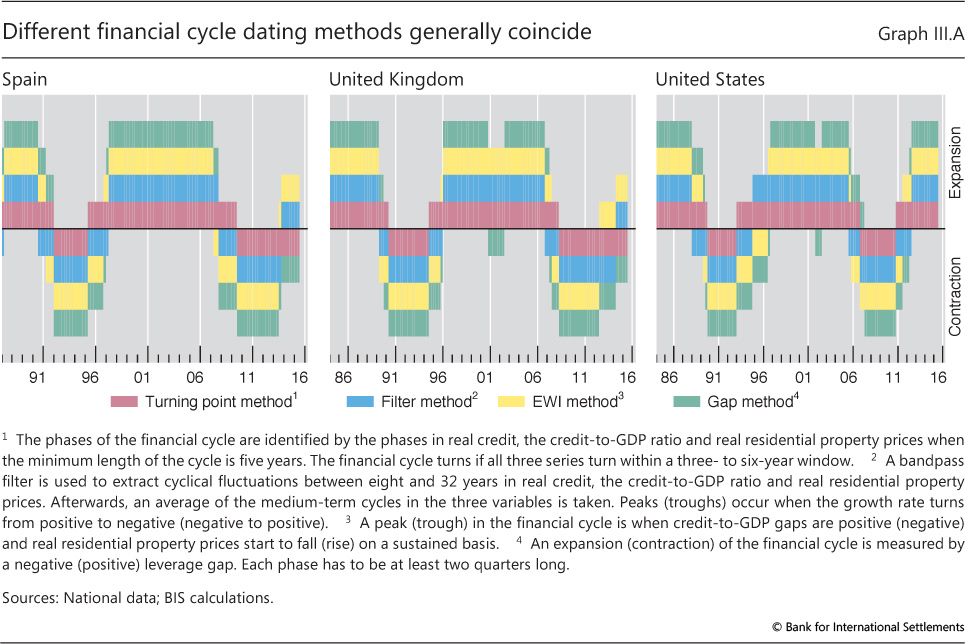
| III.A | Different financial cycle dating methods generally coincide | p 46 |
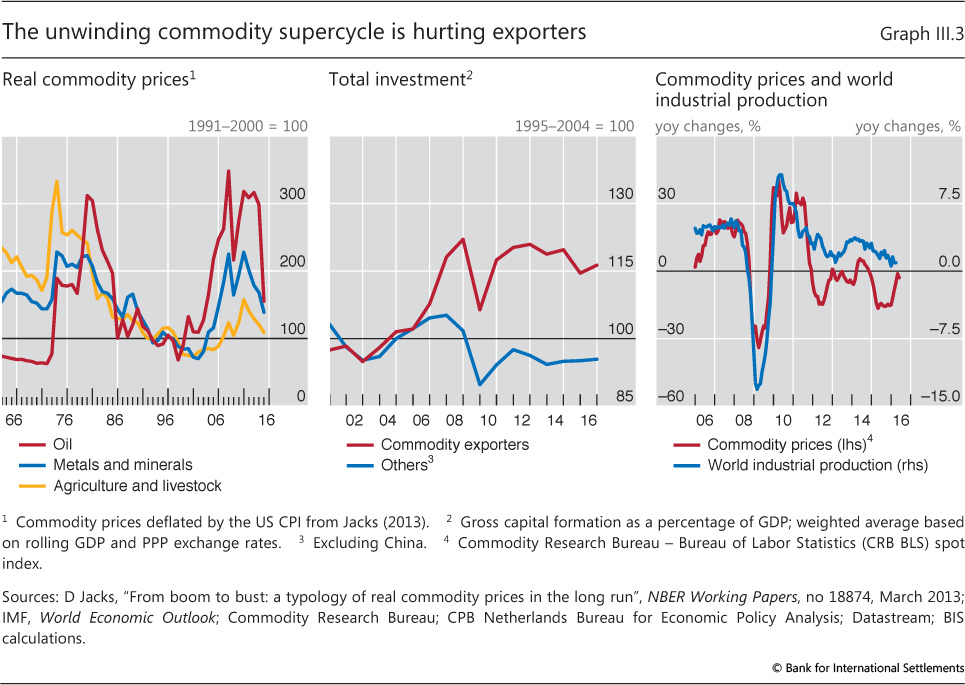
| III.3 | The unwinding commodity supercycle is hurting exporters | p 48 |
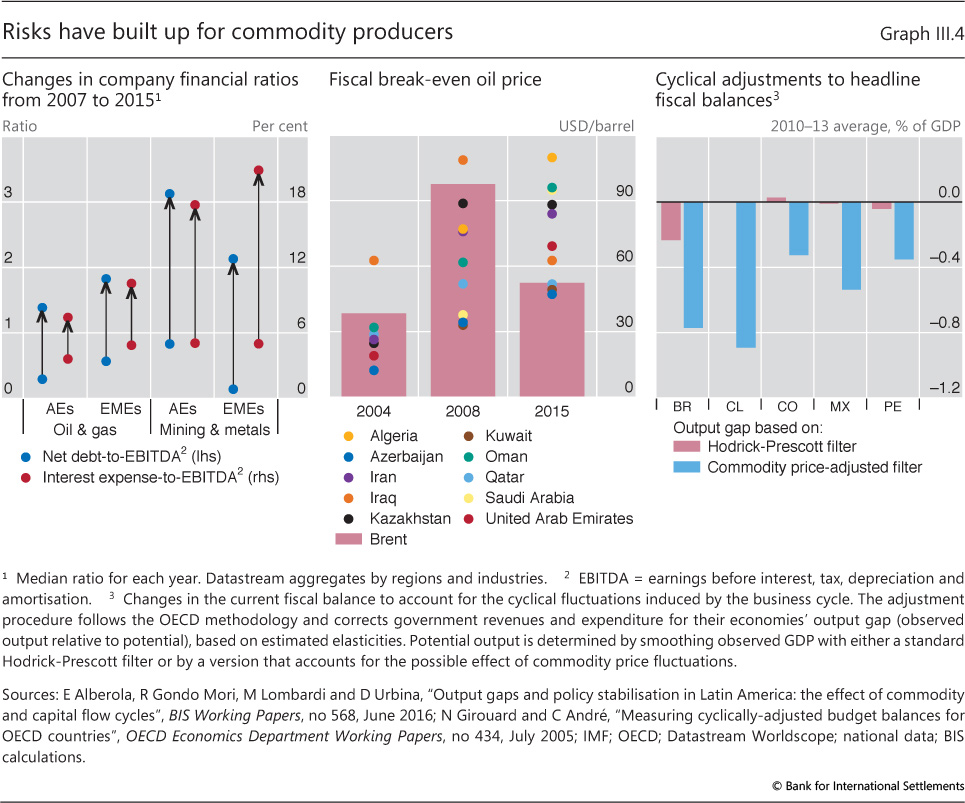
| III.4 | Risks have built up for commodity producers | p 50 |
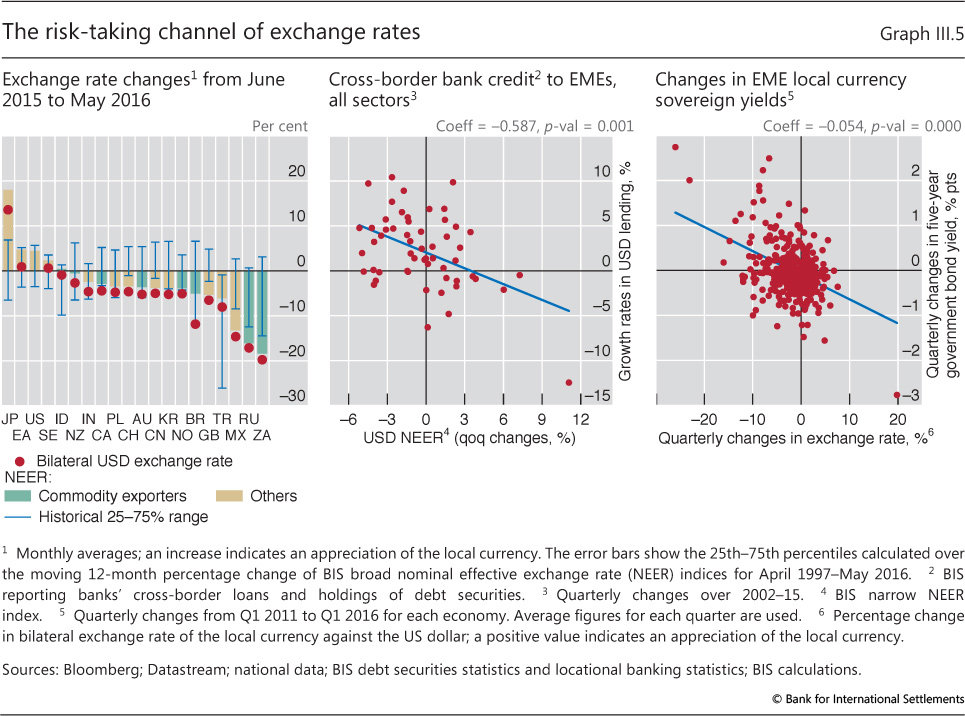
| III.5 | The risk-taking channel of exchange rates | p 52 |
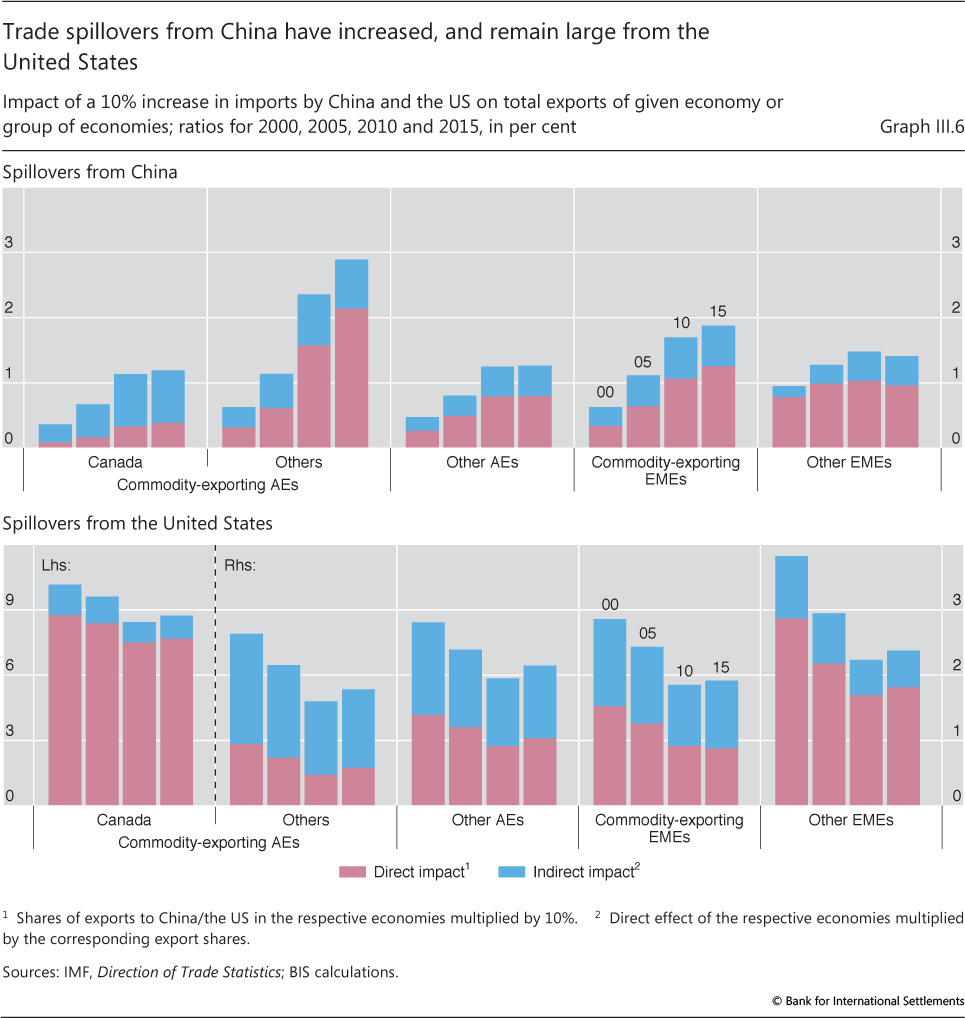
| III.6 | Trade spillovers from China have increased, and remain large from the United States | p 56 |
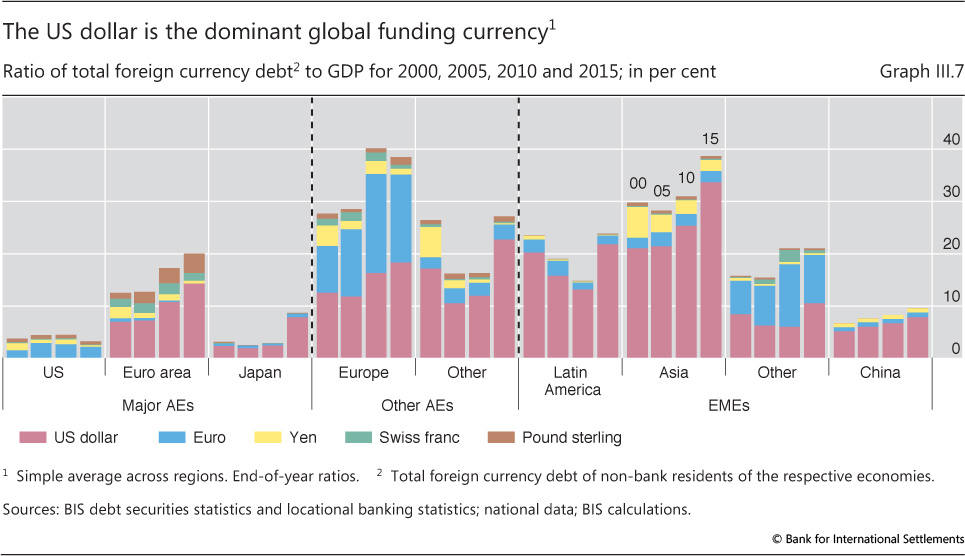
| III.7 | The US dollar is the dominant global funding currency | p 57 |
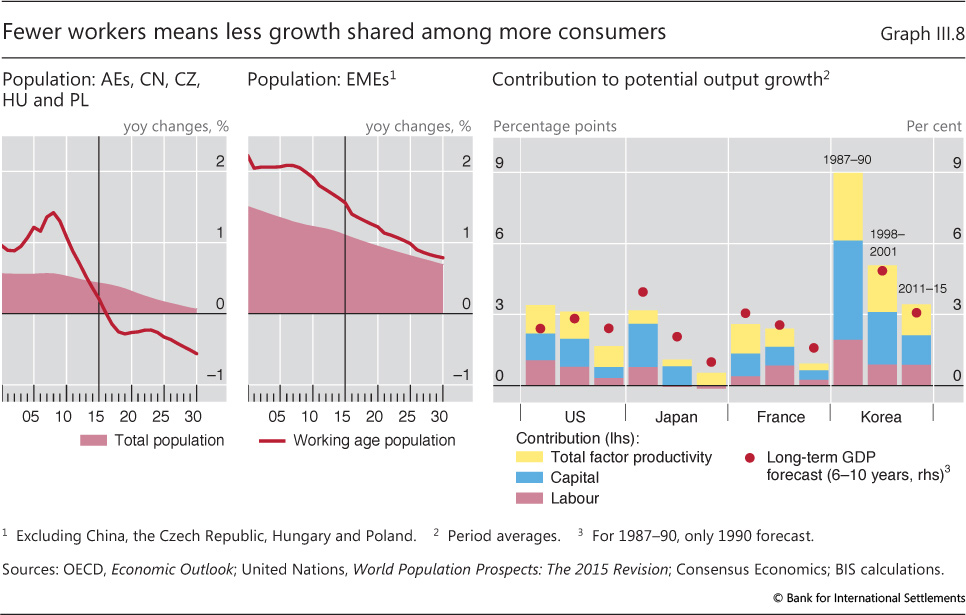
| III.8 | Fewer workers means less growth shared among more consumers | p 59 |
| Chapter IV: data behind the graphs (xlsx) | ||
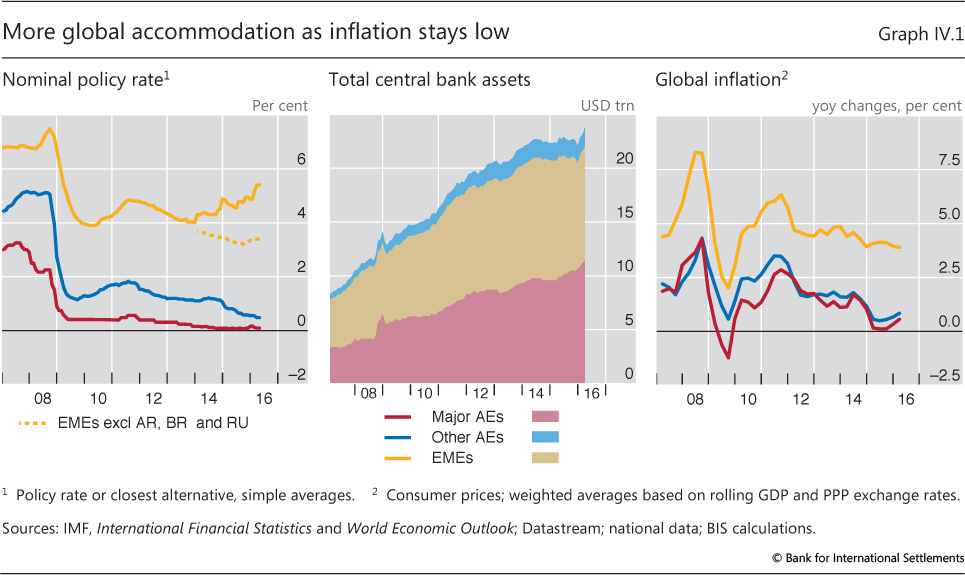
| IV.1 | More global accommodation as inflation stays low | p 64 |
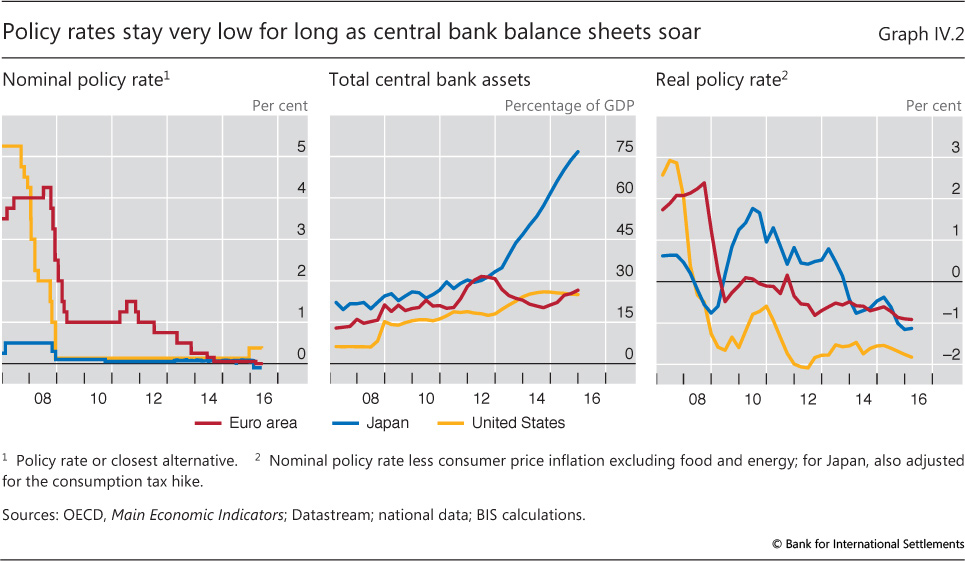
| IV.2 | Policy rates stay very low for long as central bank balance sheets soar | p 64 |
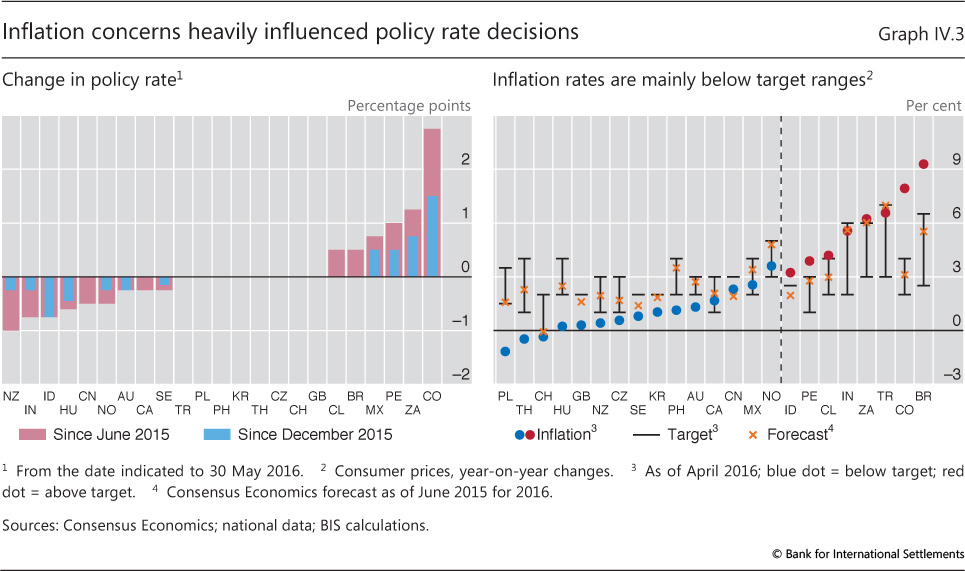
| IV.3 | Inflation concerns heavily influenced policy rate decisions | p 65 |
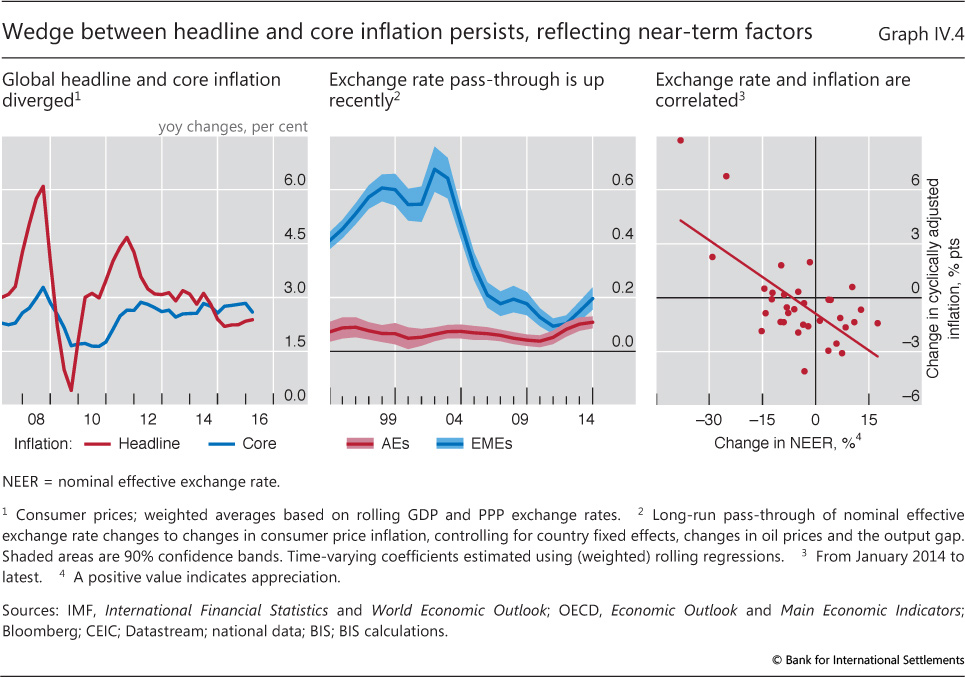
| IV.4 | Wedge between headline and core inflation persists, reflecting near-term factors | p 67 |
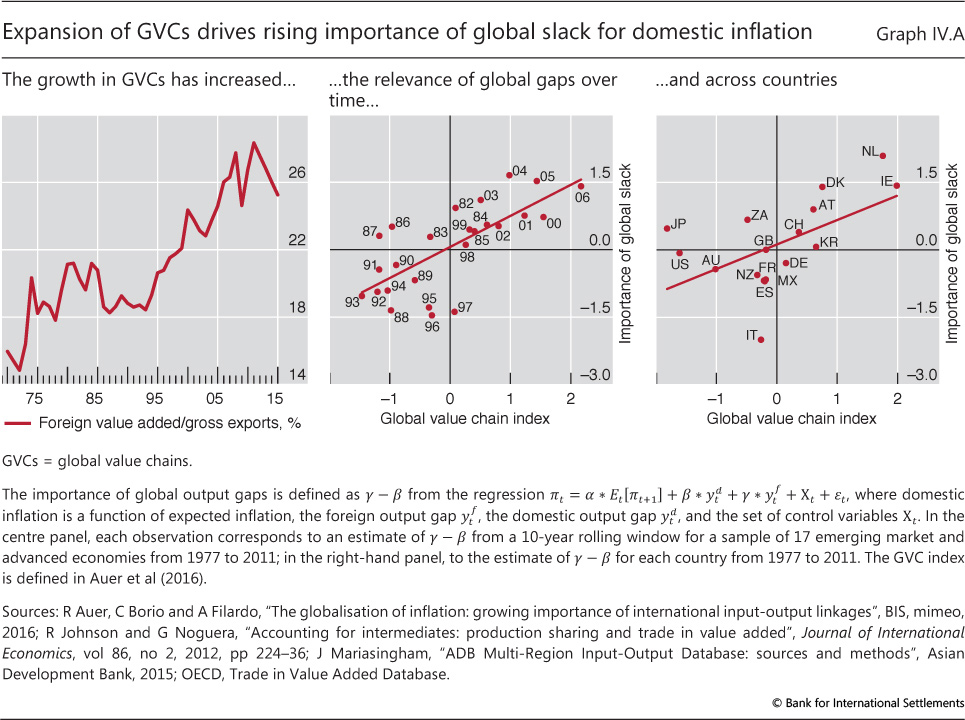
| IV.A | Expansion of GVCs drives rising importance of global slack for domestic inflation | p 68 |
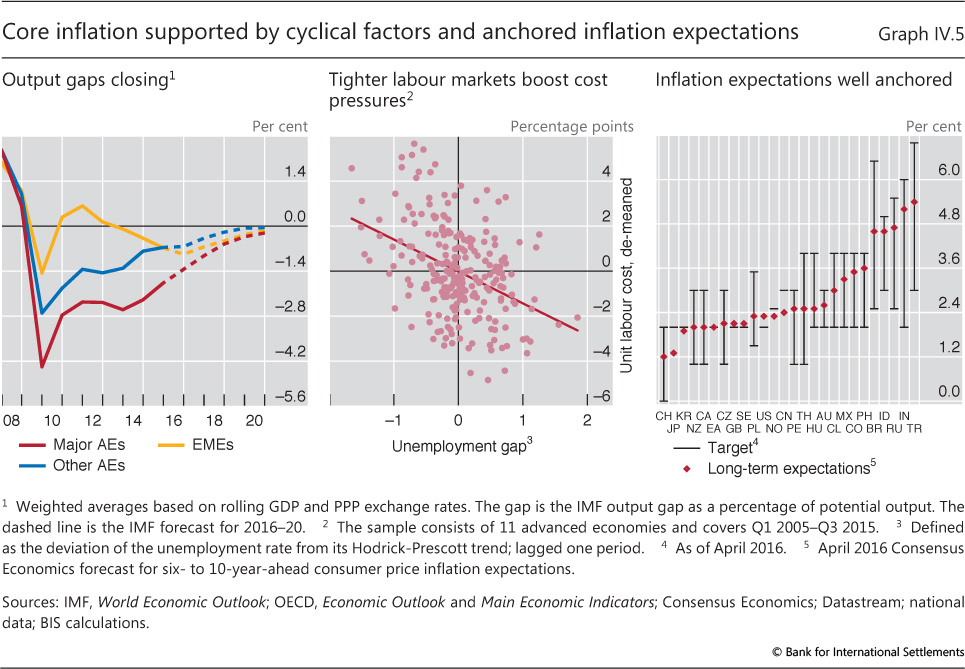
| IV.5 | Core inflation supported by cyclical factors and anchored inflation expectationsis changing | p 69 |
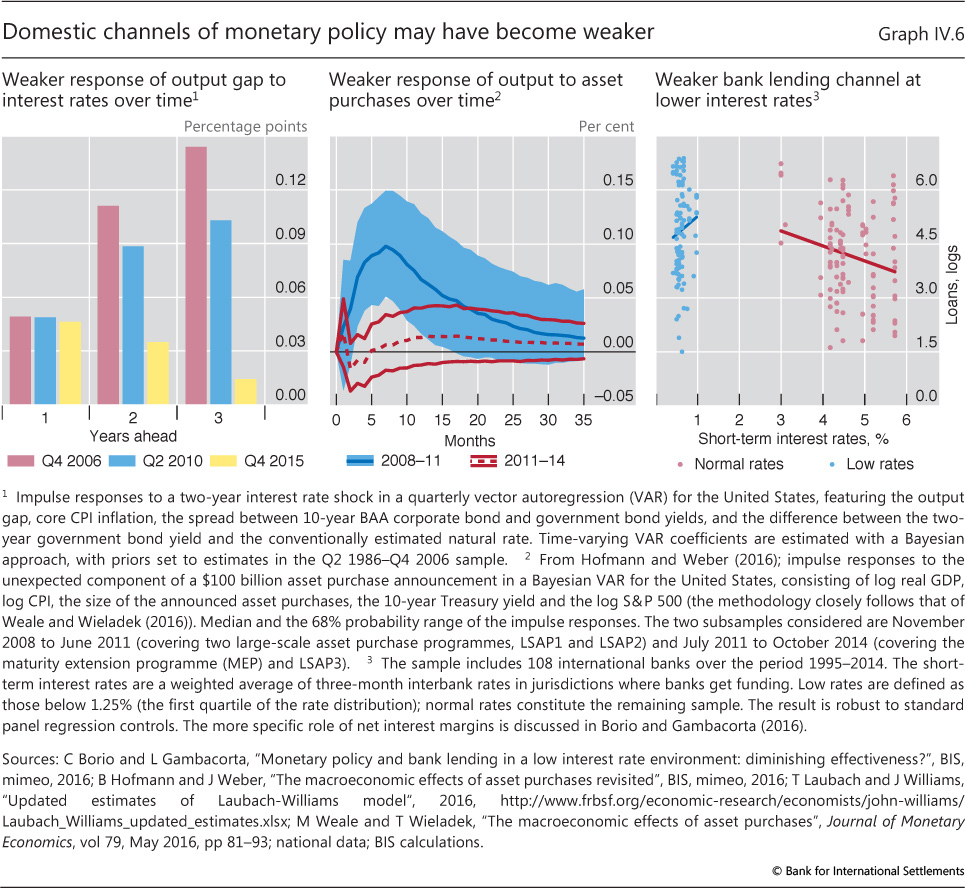
| IV.6 | Domestic channels of monetary policy may have become weaker | p 70 |
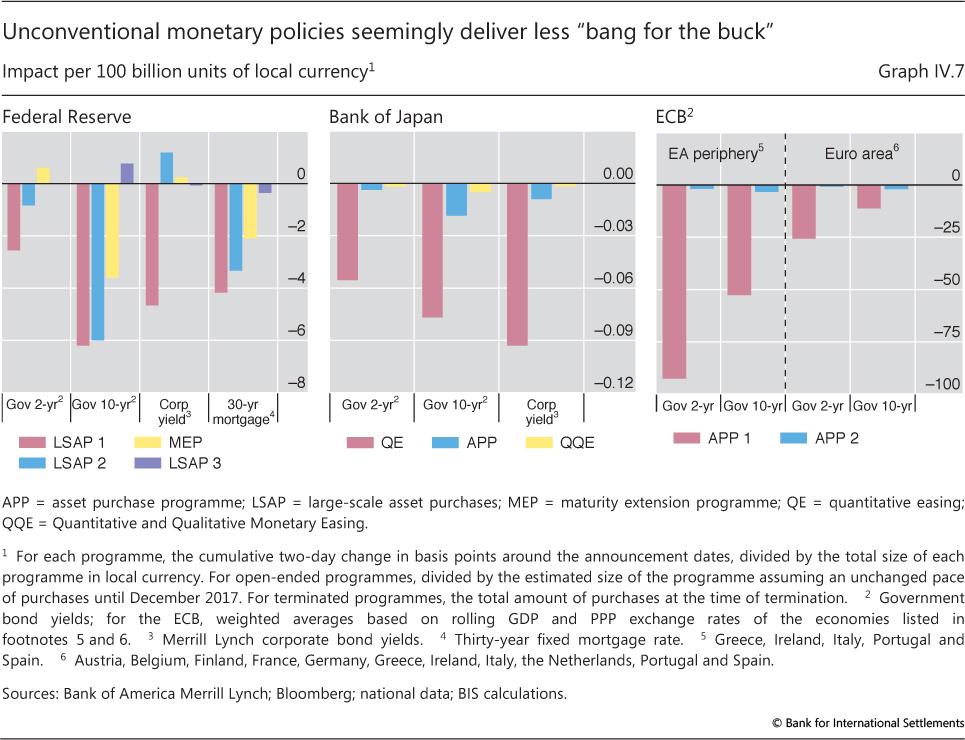
| IV.7 | Unconventional monetary policies seemingly deliver less "bang for the buck" | p 72 |
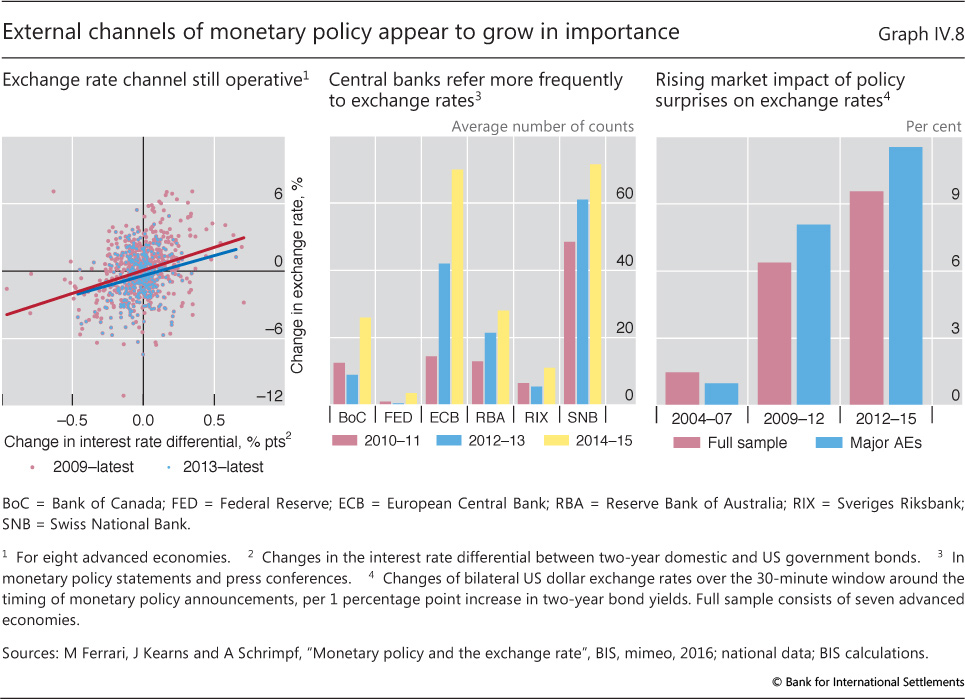
| IV.8 | External channels of monetary policy appear to grow in importance | p 73 |
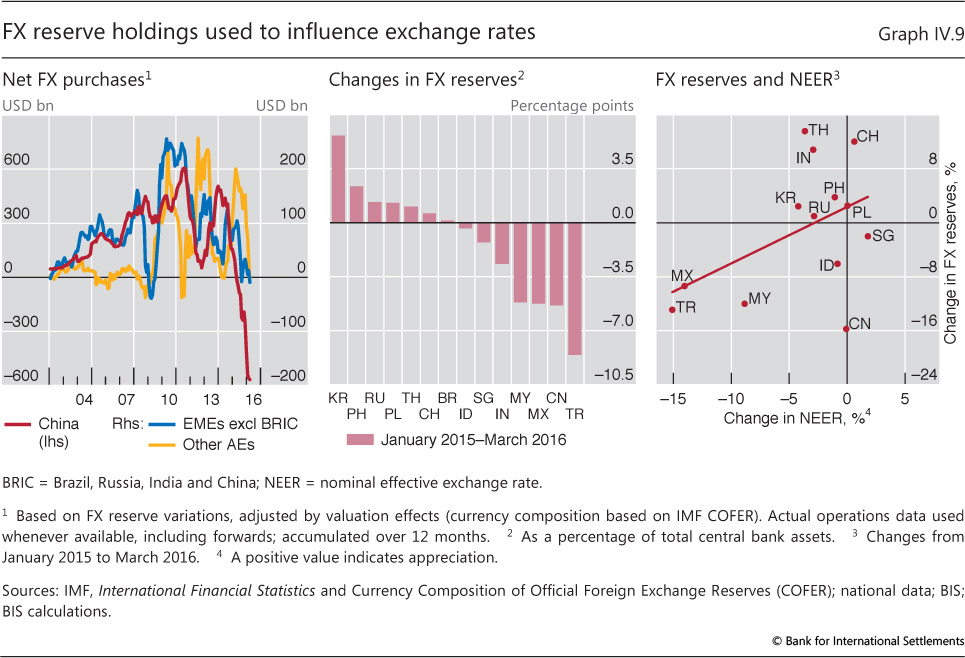
| IV.9 | FX reserve holdings used to influence exchange rates | p 74 |
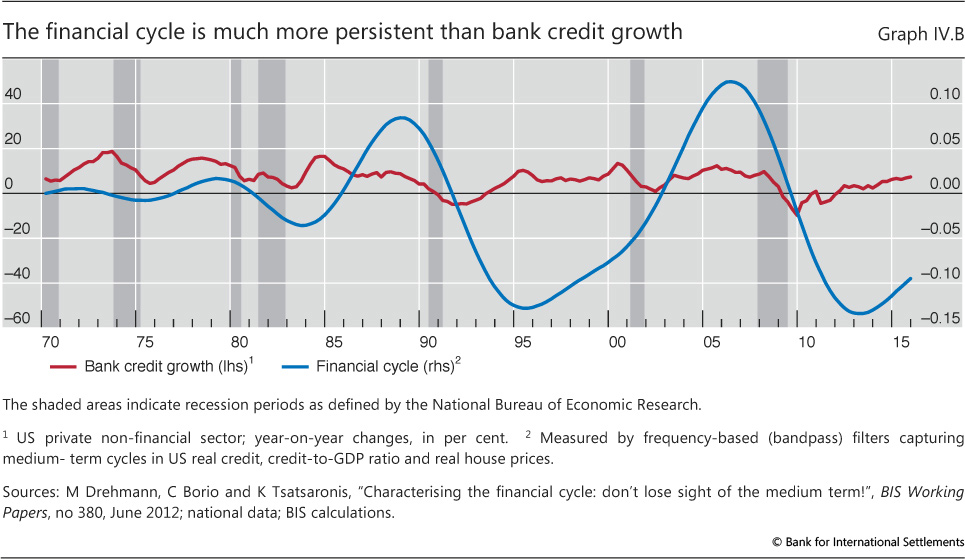
| IV.B | The financial cycle is much more persistent than bank credit growth | p 76 |
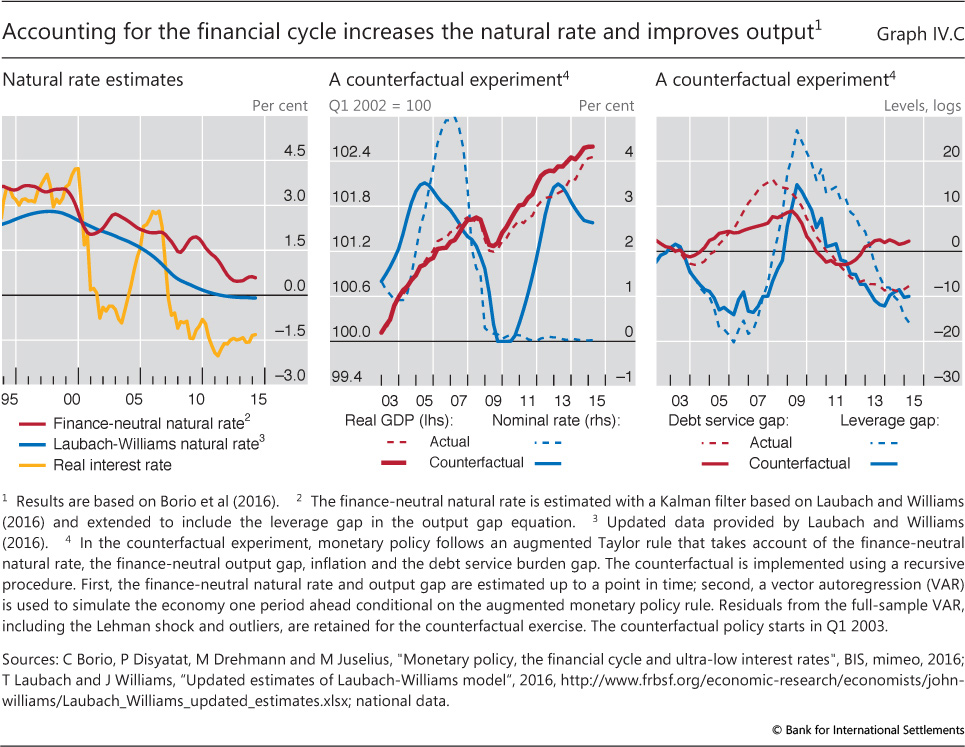
| IV.C | Accounting for the financial cycle increases the natural rate and improves output | p 79 |
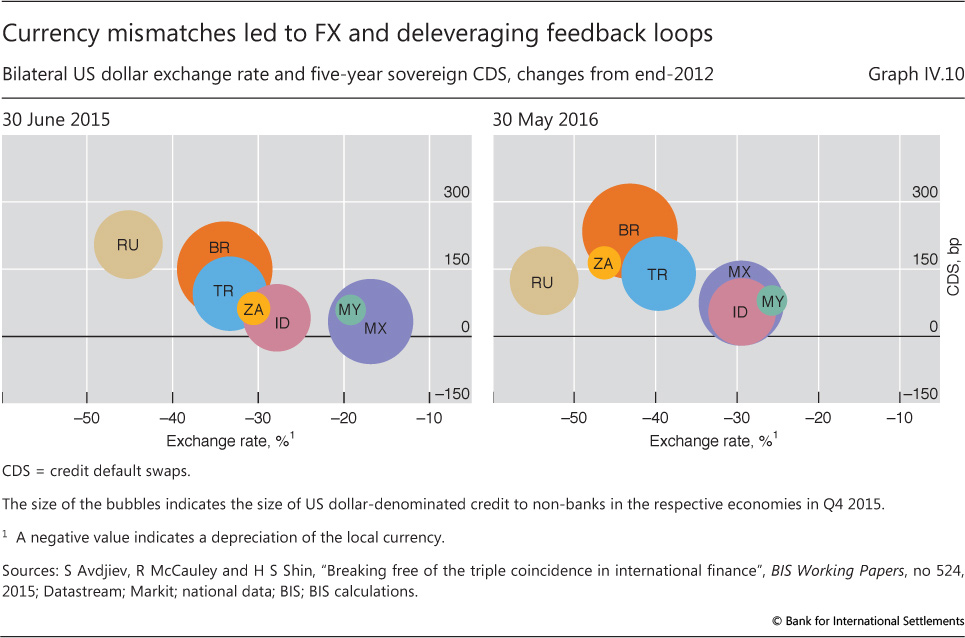
| IV.10 | Currency mismatches led to FX and deleveraging feedback loops | p 81 |
| Chapter V: data behind the graphs (xlsx) | ||
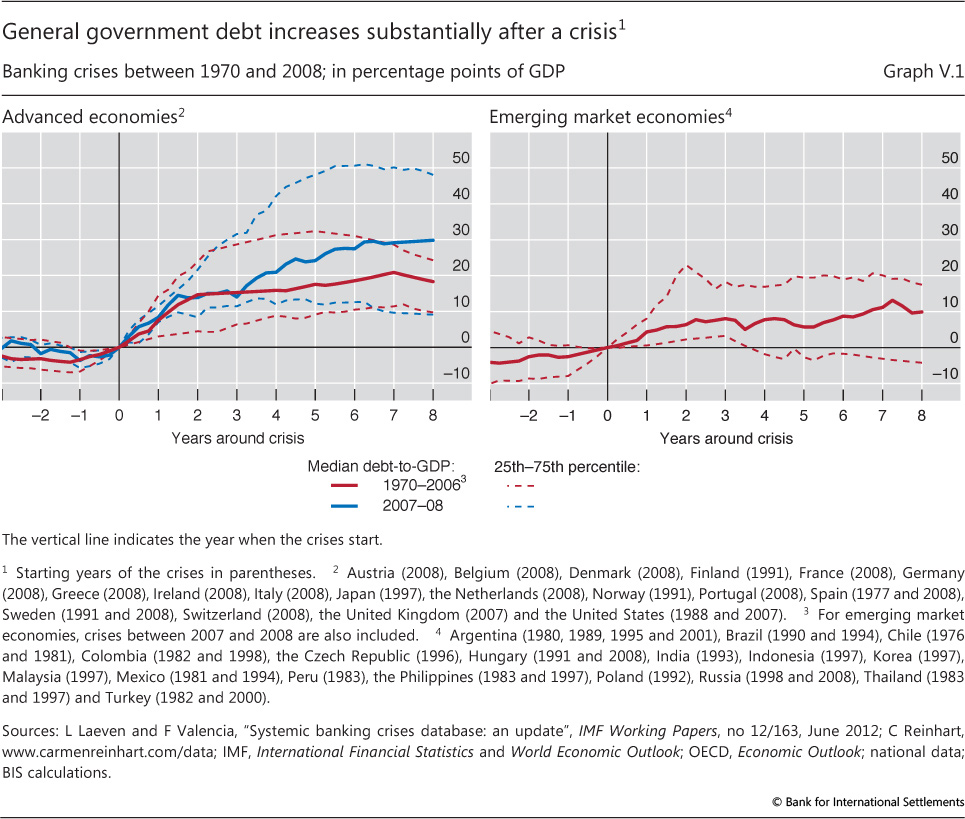
| V.1 | General government debt increases substantially after a crisis | p 85 |
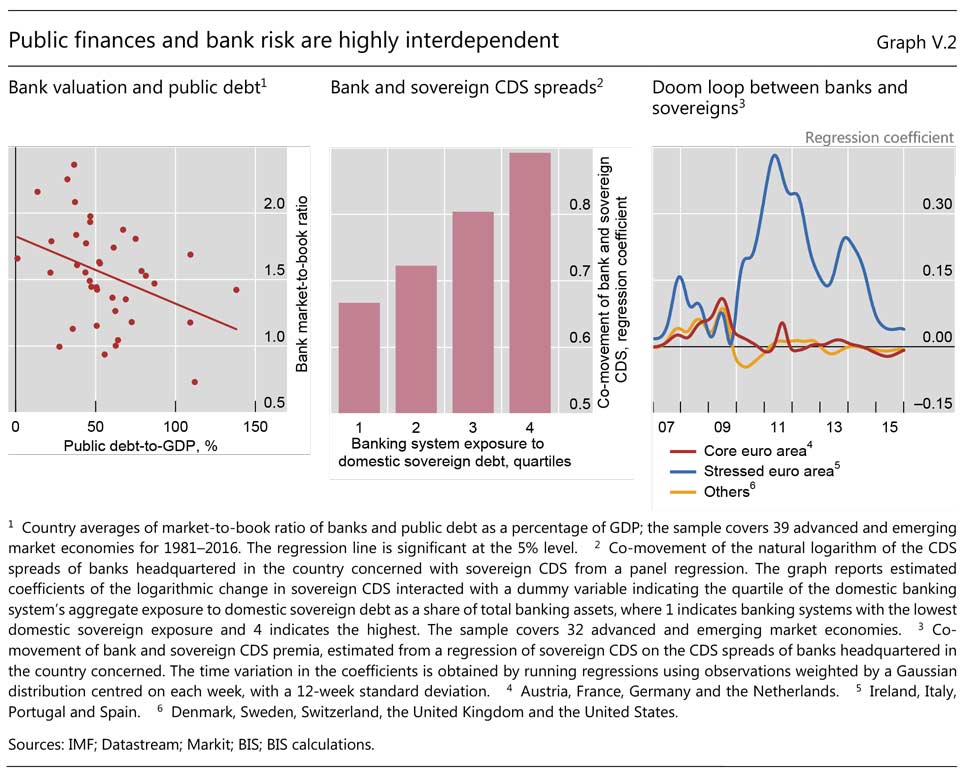
| V.2 | Public finances and bank risk are highly interdependent | p 88 |
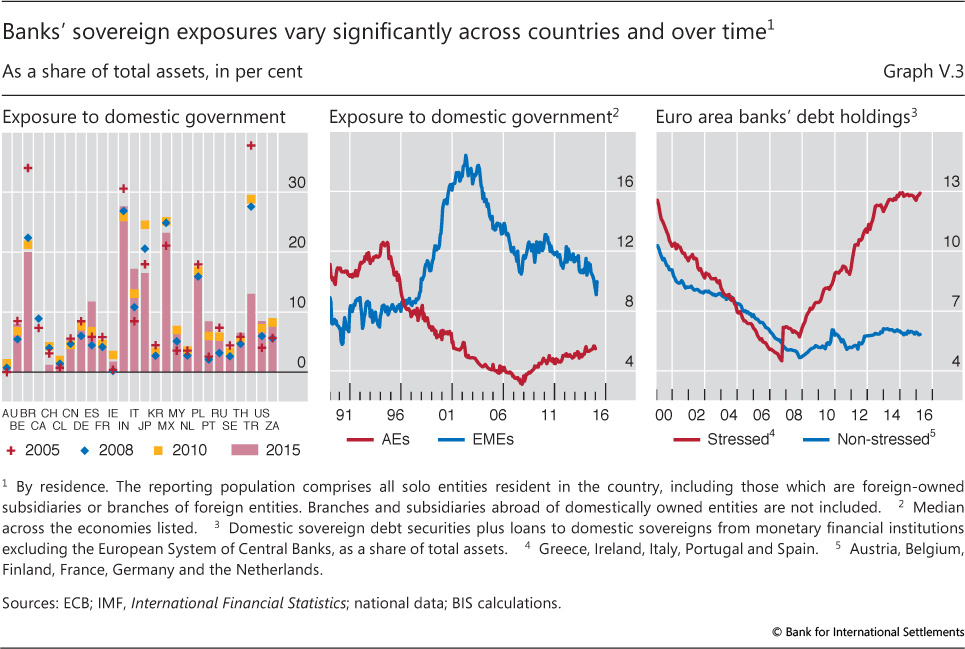
| V.3 | Banks' sovereign exposures vary significantly across countries and over time | p 89 |
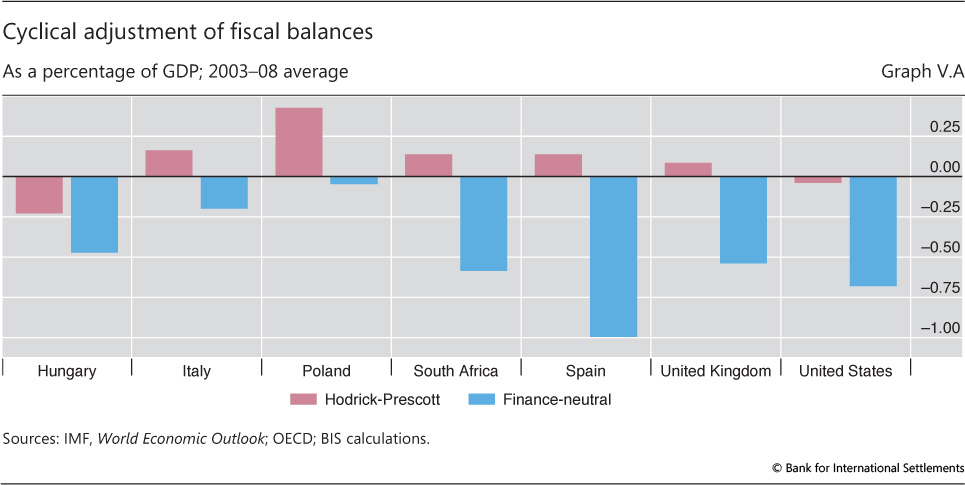
| V.A | Cyclical adjustment of fiscal balances | p 94 |
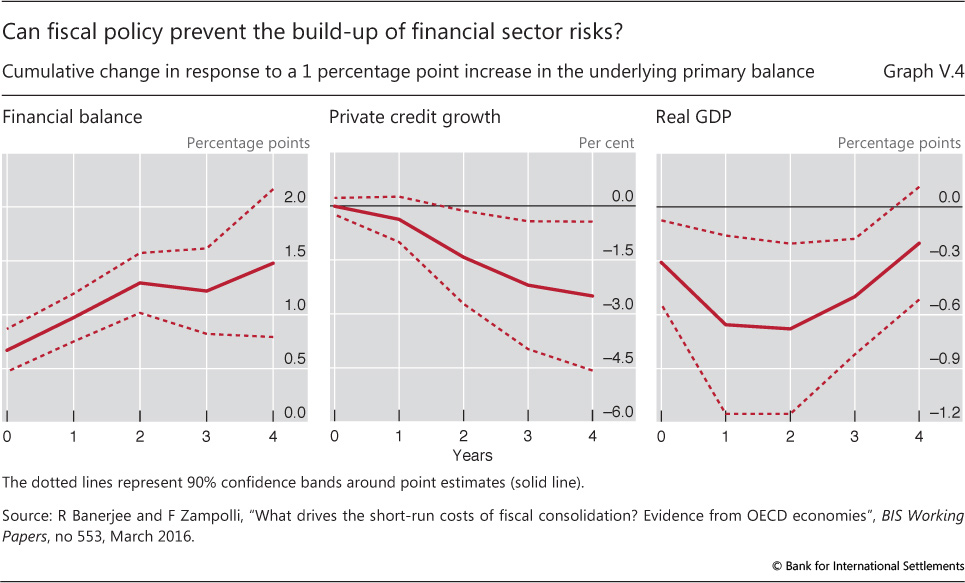
| V.4 | Can fiscal policy prevent the build-up of financial sector risks? | p 98 |
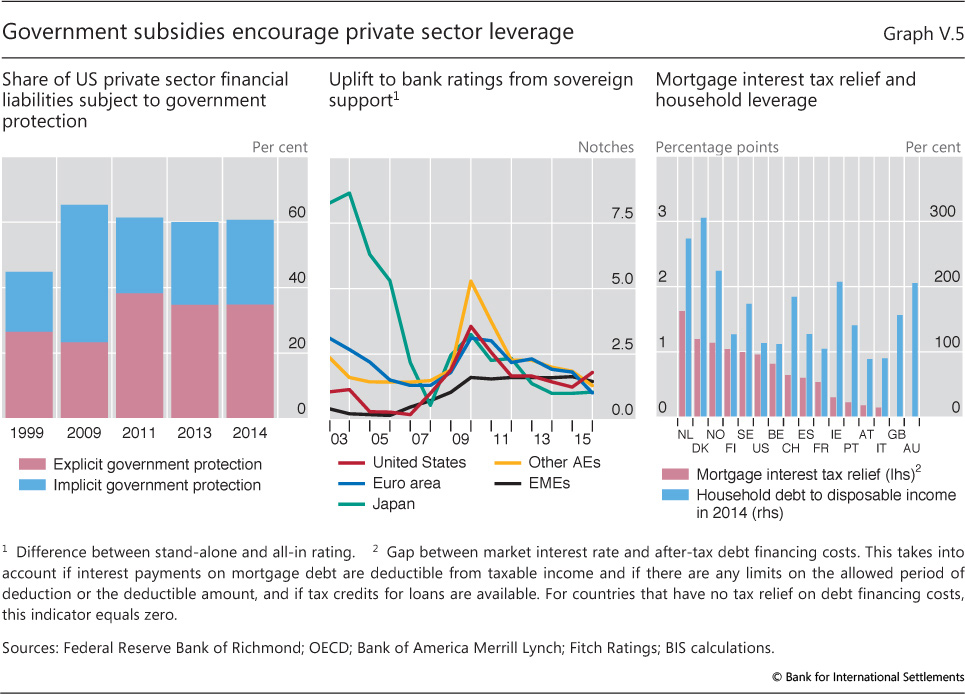
| V.5 | Government subsidies encourage private sector leverage | p 99 |
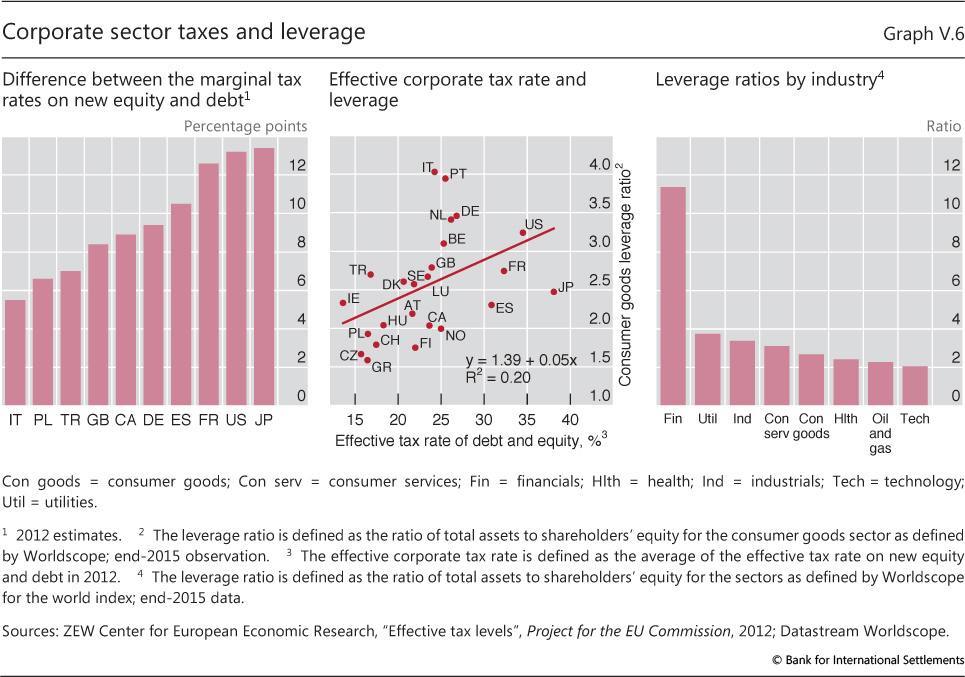
| V.6 | Corporate sector taxes and leverage | p 101 |
| Chapter VI: data behind the graphs (xlsx) | ||
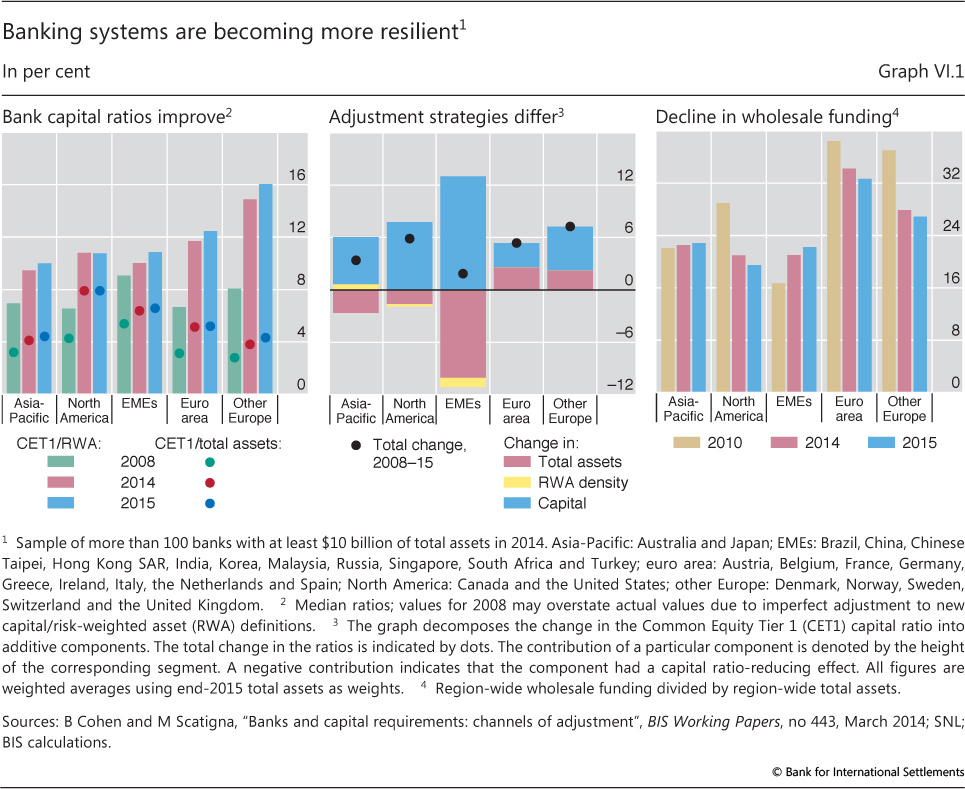
| VI.1 | Banking systems are becoming more resilient | p 104 |
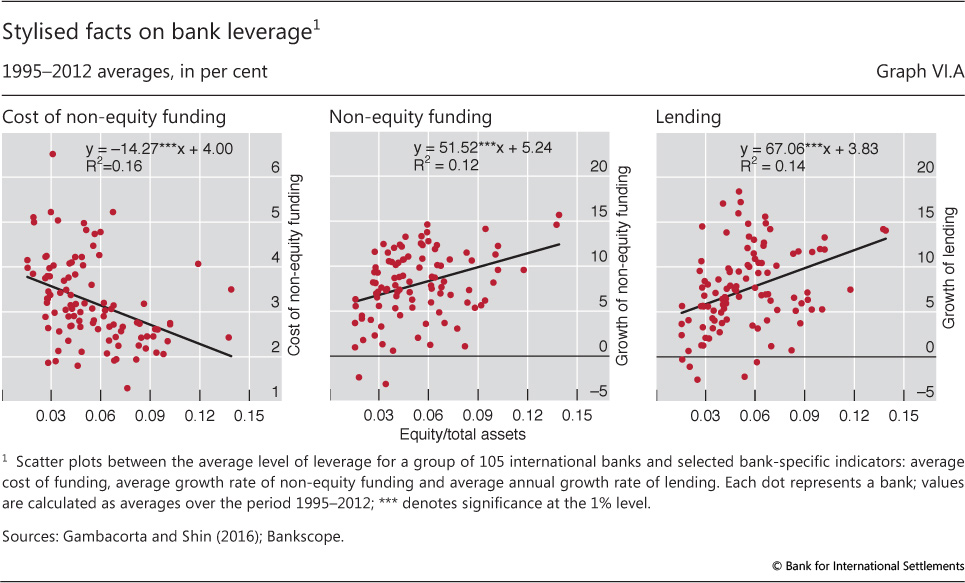
| VI.A | Stylised facts on bank leverage | p 105 |
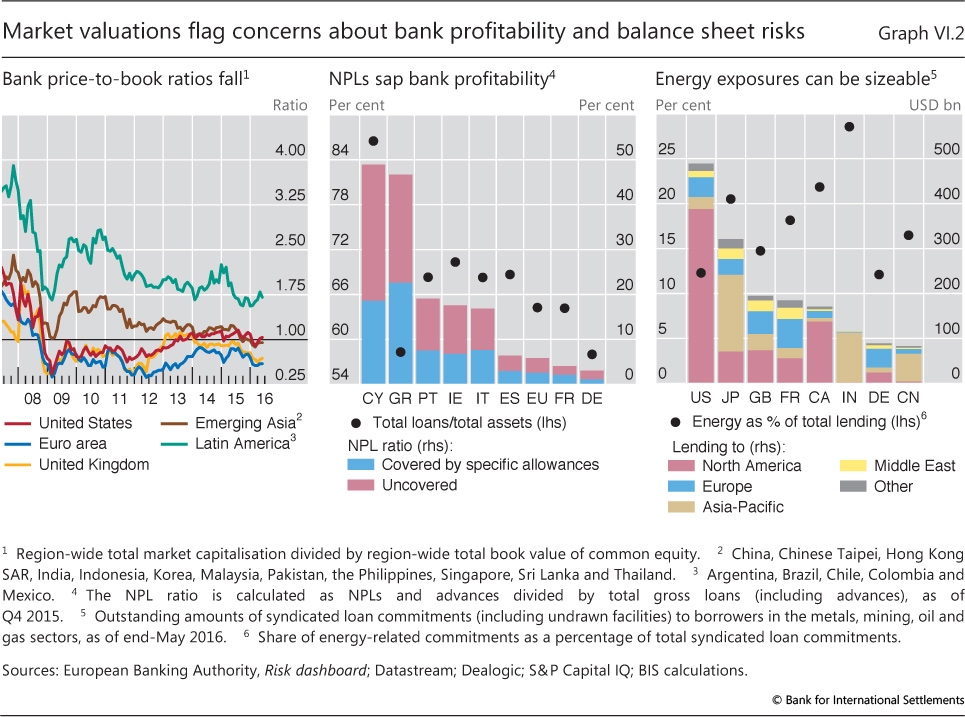
| VI.2 | Market valuations flag concerns about bank profitability and balance sheet risks | p 106 |
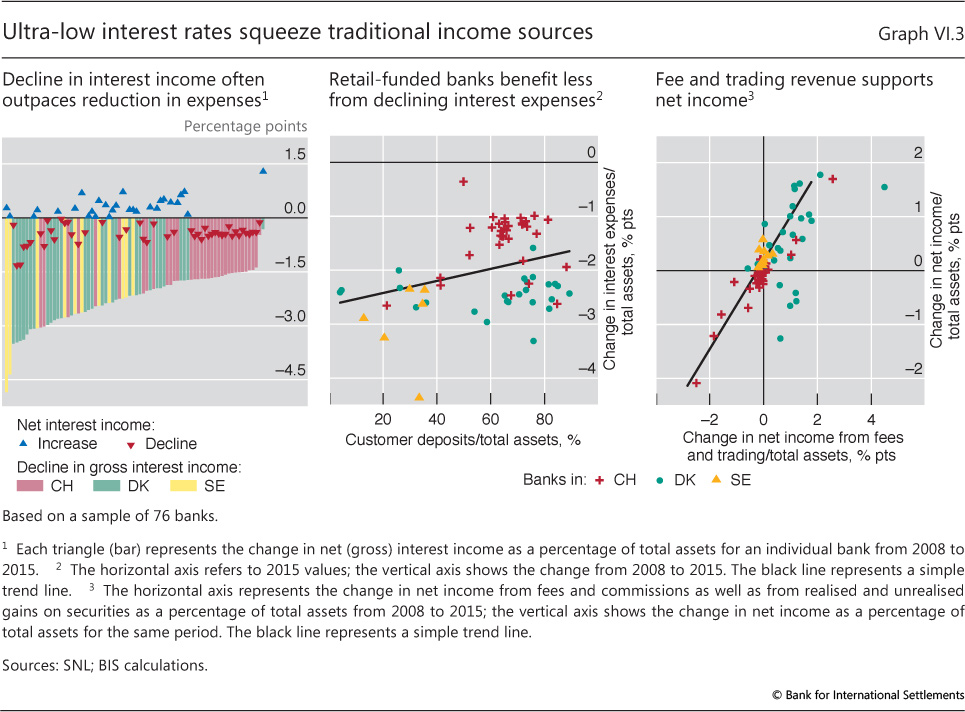
| VI.3 | Ultra-low interest rates squeeze traditional income sources | p 108 |
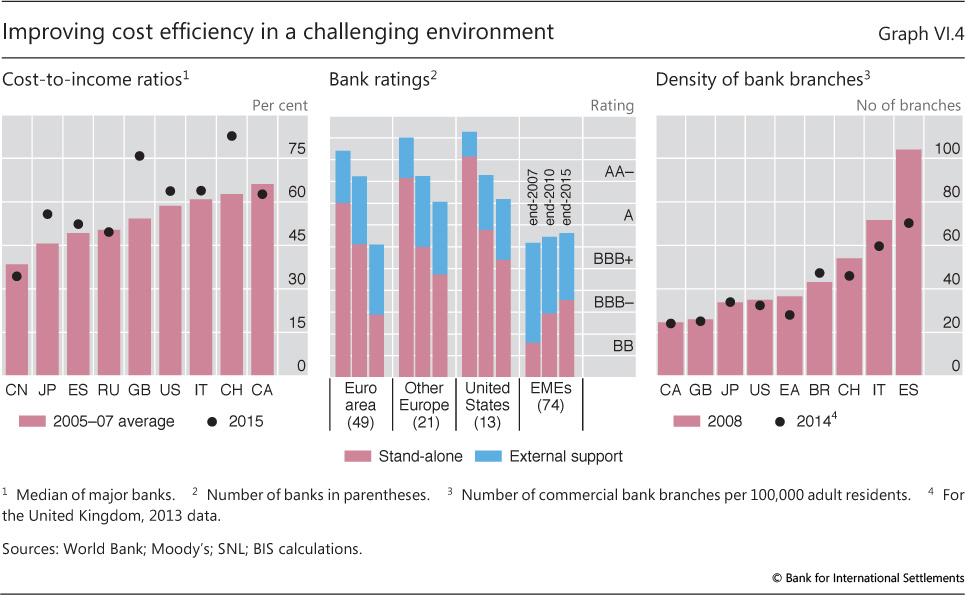
| VI.4 | Improving cost efficiency in a challenging environment | p 109 |
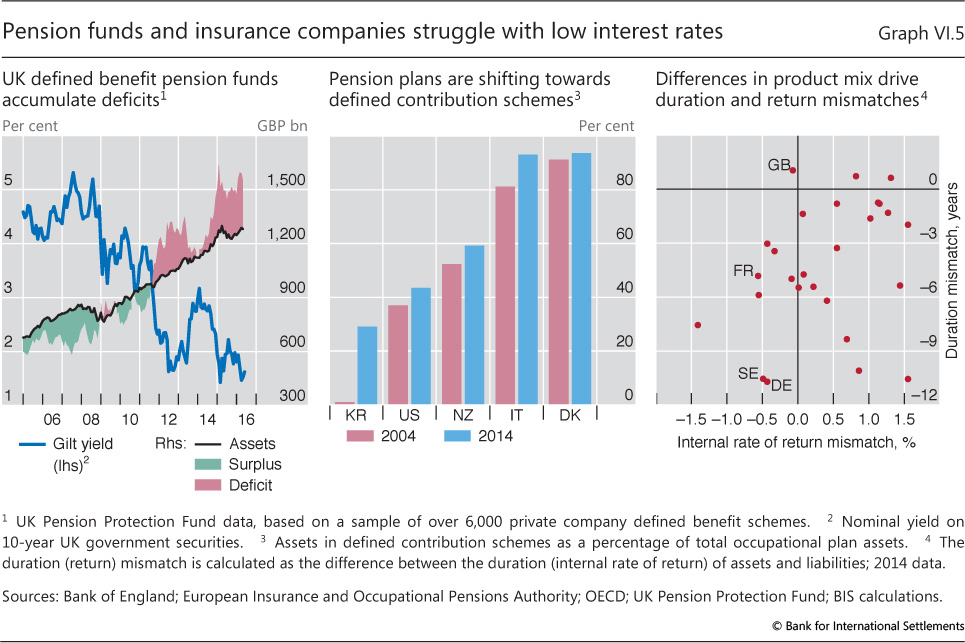
| VI.5 | Pension funds and insurance companies struggle with low interest rates | p 112 |
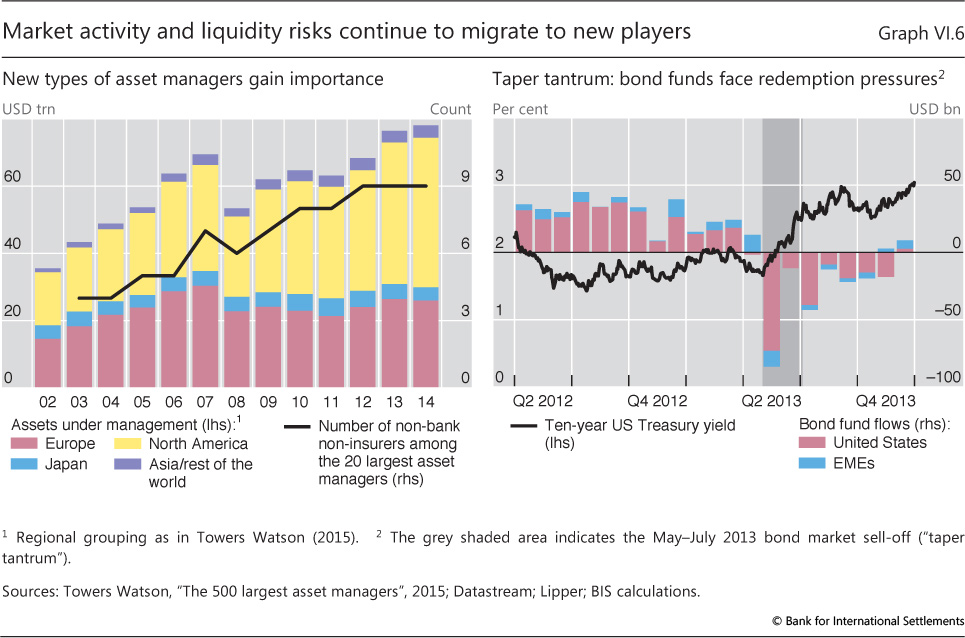
| VI.6 | Market activity and liquidity risks continue to migrate to new players | p 113 |
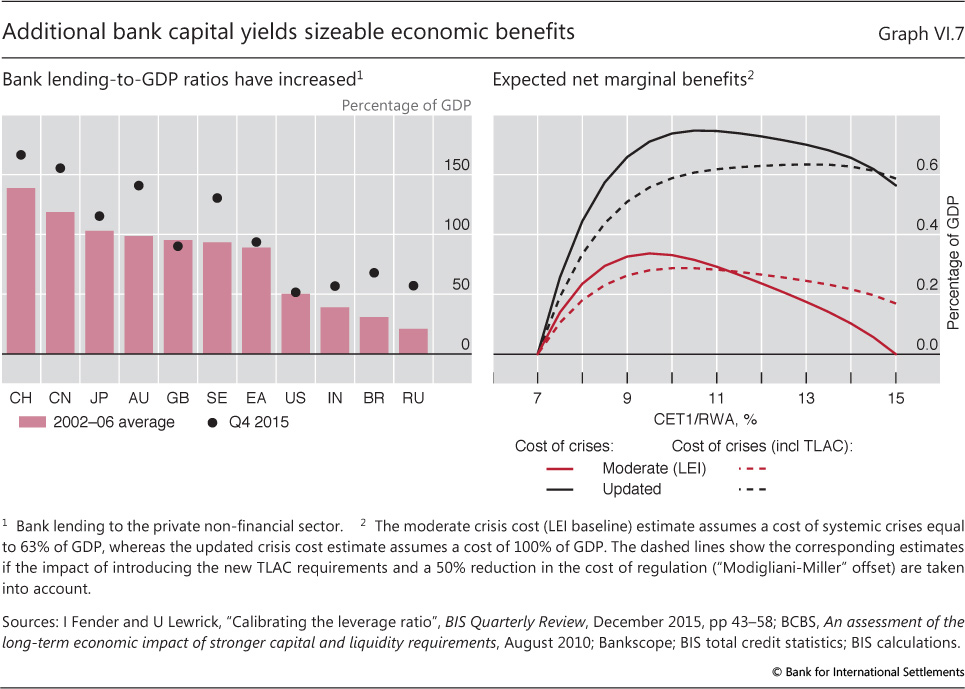
| VI.7 | Additional bank capital yields sizeable economic benefits | p 118 |