Graeme Wheeler: Reflections on the stewardship of the Reserve Bank
Speech by Mr Graeme Wheeler, Governor of the Reserve Bank of New Zealand, to The Northern Club, Auckland, 30 August 2017.
The views expressed in this speech are those of the speaker and not the view of the BIS.
Background
Thank you for the invitation to join you, it's a pleasure to speak again at the Northern Club.
Today, I will offer thoughts on the stewardship of the Reserve Bank over the past five years in meeting its price stability and financial stability objectives, and discuss some policy challenges the Bank may face in the future.1
It's been a remarkable five years, especially with the challenges thrown up by the global economy and an over- heated domestic housing market.
A challenging international and domestic environment
As a small open economy, developments beyond our shores have a large influence on New Zealand's economic outcomes. The global expansion, which is about to enter its ninth year, is the weakest in 70 years. Until recently, output growth in the advanced economies has been below trend, and headline and core inflation continue to be low despite unprecedented monetary stimulus.
Several factors account for the weak recovery: corporate and household deleveraging following the Global Financial Crisis (GFC) has been more prolonged than expected - especially in the euro area; productivity and business investment in the advanced economies have been weak; and trade has been much less of a catalyst than normal. Increasingly, the gravitational centre for the global economy is shifting away from the US and Europe to the East Asia region.
Each five year window brings its own set of risks and challenges. Over the past five years on the international front we've seen:
- Increasing use of unconventional monetary policies (including negative interest rates and unprecedented amounts of quantitative easing) to deliver the cheapest financing the world has experienced.2 While aimed at stimulating spending, it also led to rapid increases in asset valuations (bonds, equities, and real estate) and a sharp compression in credit spreads and risk premia.
- The largest slowdown in global trade since the early 1980s, which has seen countries seeking to boost domestic growth through lower exchange rates.3
- Sharp swings in commodity prices with peak to trough movements of 75 percent in oil and other commodities.4
- A continued build up in global debt that is now at record highs relative to global output.5
- Unexpected political developments in Europe, the UK and the US that substantially increased uncertainty, although measures of financial market volatility remain close to 25 year lows.6
Back home, New Zealand experienced:
- The strongest migration surge since the 1860s (equivalent to a 6 percent increase in the working-age population since 2012) and the labour force participation rate reached historically high levels.7,8
- A long period of negative tradables inflation - probably the longest since the Great Depression.9
- A 75 percent decline in dairy prices before recovering partially.10
- A major switching of expenditure and production to the non-tradables sector, in part to free up resources for the Canterbury rebuild.11
- Annual house price inflation that reached 30 percent in Auckland and spread rapidly throughout the country.
In a world of unconventional monetary policy and unprecedented liquidity, investors' bid up asset prices and, in doing so, compressed risk premia. In these settings, New Zealand, with its stronger output growth, higher interest rates, and impressive international rankings on numerous business and governance-related surveys attracted portfolio flows from the rest of the world.12,13 These flows put upward pressure on the exchange rate, and lowered long term interest rates.
The appreciating exchange rate made it more difficult for our exporters to compete on global markets (if not matched by rising export prices) and skewed growth away from the tradables sector. By lowering tradables inflation, it also increased the risk that headline inflation would remain low and feed through into falling long-term inflation expectations. Lower long term interest rates reduced the funding costs for New Zealand banks and led to historically low mortgage rates. These, in conjunction with constraints on housing supply and strong population growth, stimulated rapid house price inflation-initially in Auckland and later across the country.
New Zealand's recent macro-economic performance
Despite the difficult international backdrop, New Zealand's economy has generally performed well over the past five years. As shown in table 1, compared to the period 1990 - 2012 (that is the 22 year period since flexible inflation targeting was first introduced) the five years from the beginning of 2013 have seen slightly faster GDP growth and much stronger employment growth. Over the past five years, headline CPI inflation has been weaker, our current account deficit has been smaller as a share of GDP, while the unemployment rate has been around its average for the period since the mid-1990s even with record increases in migration and labour force participation. Labour productivity has been disappointing, a challenge we share with many other advanced economies.14
Some of these outcomes lie well beyond the influence of the Reserve Bank's policy levers. For example, monetary policy cannot directly influence the supply of labour, the productivity of labour and capital, the innovation that takes place within the economy, or the country's external position.
Table 1: New Zealand Indicators (annual average percentage change)
|
Global GDP Growth |
NZ's Real GDP Growth |
Employment Growth |
Headline Inflation |
Core Inflation |
|
|
1990 - 2012 |
3.6 |
2.6 |
1.6 |
2.5 |
2.215 |
|
2013 - current |
3.3 |
2.8 |
2.5 |
1.0 |
1.4 |
Source: Stats NZ, RBNZ estimates, IMF World Economic Outlook
Over the past five years, the Bank's monetary policy has been an important driver behind the rate of output and employment growth, and the path of non-tradable inflation and inflation expectations. During this time monetary policy has been stimulatory, with the Official Cash Rate averaging 2-3 percentage points below the neutral interest rate (the interest rate at which monetary policy is neither stimulatory nor contractionary). Monetary policy isn't however, the only driver of growth in output and employment - the pent up demand for investment in construction and infrastructure, the rise in the terms of trade and the rapid increase in population are also important factors.
Our low annual rate of headline inflation (1 percent over the past five years) has mainly been due to the 4½ years of negative tradables inflation experienced from mid-2012 until late-2016. Tradables inflation, much of which lies beyond the Bank's control, averaged minus 1.2 percent during this period. Annual non-tradables inflation, which the Bank has considerable influence over, averaged 2.3 percent since 2013 and core inflation averaged 1.4 percent and remained within the 1 to 3 percent target band established for headline inflation.16
Looking at the key relative prices in the economy we would have preferred a lower exchange rate over this period. The TWI remains 4 percent higher than it was prior to the seven cuts in the Official Cash Rate that commenced in June 2015. To a large extent the high exchange rate reflects the favourable performance of the economy, the high terms of trade, and weakness in the US dollar. The appreciation in the exchange rate has been a headwind for the tradables sector and, by reducing already weak tradables inflation, made it more difficult to reach the Bank's inflation goals. A lower New Zealand dollar is needed to increase tradables inflation and help deliver more balanced growth.
The impact of macro-prudential policy
With low interest rates unable to constrain credit growth, rapid house price inflation was creating financial stability risks for the banking system and, given the very high levels of household debt, increasing the risk that a rapid fall in house prices could have a severe economic impact.
We were conscious that the introduction of LVR restrictions would make life difficult for the Bank, given the sensitivities around housing.
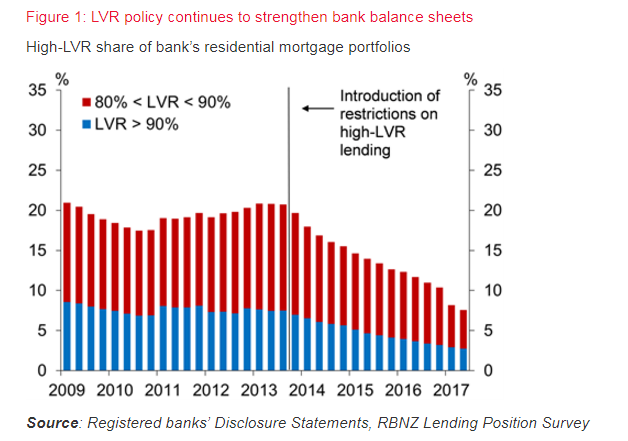
Loan-to-value ratio restrictions (LVRs) reduced the systemic risk to the banking system flowing from the rapid increase in house prices. Requiring new borrowers to have a greater equity contribution in their house purchases reduced the overall riskiness of banks' mortgage portfolios.
When LVRs were introduced in October 2013, 21 percent of the stock of mortgage lending across the banking system was at LVRs of 80 percent or higher. With a third of new mortgage lending at that time taking place at LVRs of 80 percent or higher, the overall stock of high LVR mortgages was likely to approach 25 percent. As a result of the LVR restrictions, the stock of highly leveraged loans across the banks' mortgage portfolios is now around 8 percent.
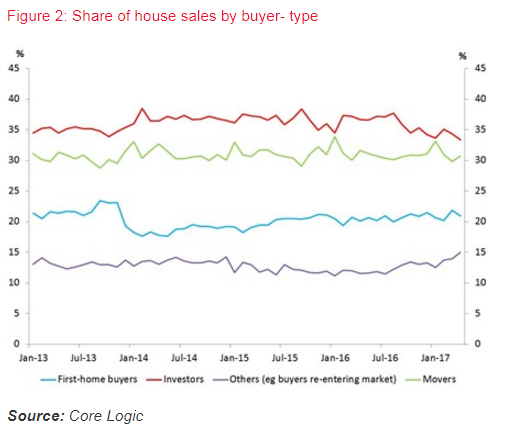
Some commentators expected the LVR restrictions to fall heavily on first home borrowers. While some first home buyers wanting high LVR loans have been affected by the restrictions, banks have given priority to first home buyers within their 10 percent speed limit. Figure 3 shows that over the past 2½ years the share of first home buyers in real estate transactions has been around 21 percent-its level in early 2013. Over this period, first home buyers have taken out nearly $21 billion of mortgage loans from the banking system, with 28 percent of that lending at LVRs greater than 80 percent.
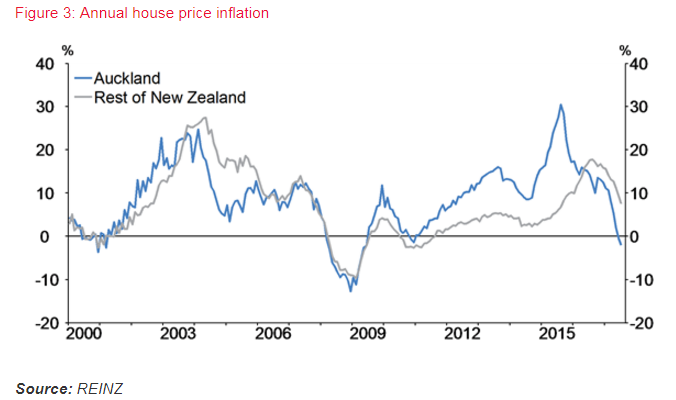
It's encouraging that nation-wide annual house price inflation has fallen from its peak of 21 percent in August 2015 to 1 percent currently (figure 4). Several factors contributed to the slowdown including the tightening of investor LVRs in October 2016, more restrictive lending conditions by banks, the rise in mortgage rates in early 2017 and increasing concerns about housing affordability.
LVR policy has been aimed at reducing financial stability risks as house prices became increasingly stretched. LVRs are not expected to be a permanent measure and the conditions for their removal would be: signs that financial stability risks have eased; and a degree of confidence that these risks won't worsen again when LVRs are removed.
On the former measure, the financial risk picture is improving. Banks are carrying a lower share of high LVR mortgages as a result of the LVR limits having been in place, and the slowdown in house price inflation is positive - although prices remain very elevated relative to incomes and rents.
However, the underlying drivers of housing demand (population growth, low interest rates) remain strong with housing demand still outstripping supply. There is a risk of a housing market resurgence (and a sharp lift in high LVR lending) if LVRs were removed at this time. The Bank will continue to review developments, bearing in mind that removal could be made in stages as a safeguard to a resurgent market.
The outlook for the New Zealand Economy
In the absence of major unanticipated shocks, prospects look promising for continued robust economic growth over the next two years. If this occurs, the current expansion would be the longest in 50 years17. Our forecasts suggest that GDP growth will exceed the growth rate of potential output and be driven by continued accommodative monetary policy, population growth, high terms of trade and, in the outer period, by the budgetary stimulus announced in the 2017 Budget. A positive output gap is forecast with inflation gradually approaching the mid-point of the target band.18
i) Domestic risks
The main domestic risks we face lie with migration and the housing market.
A sharp decline in net immigration
Since early 2012 net permanent and long-term working age immigration has totaled 220,000 - equivalent to a 6 percent increase in the working age population. Migrants have mainly been in the 15-29 year age group. This migration has increased the demand for housing and goods and services, while also increasing labour supply (and hence potential output). Migration has had a positive net demand effect, although its impact has been weaker than in previous migration cycles, and is one factor moderating wage outcomes.
Our forecasts assume net immigration of 140,000 people over the next three years - a further 3.5 percent boost to the working age population. A much sharper reduction in arrivals or increase in departures, absent an increase in global growth, would slow domestic economic growth by reducing employment and demand growth.
A resurgence in house price inflation
House price to income ratios are high in New Zealand, and especially in Auckland. Although house price inflation has slowed markedly, a further surge in house prices can't be ruled out as mortgage rates are low, net migration flows are strong and large supply and demand imbalances remain in the housing market.
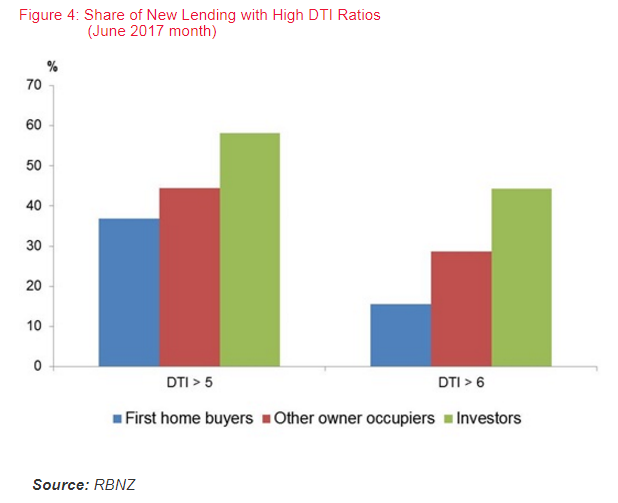
A strong resurgence in house price inflation would increase the risk of a subsequent future correction. With a debt to income ratio of 167 percent (up from the 2009 peak of 159 percent) households are already heavily exposed to the risk of rising interest rates or falling house prices. In addition, the share of high Debt-to-Income (DTI) lending to first home buyers, other owner occupiers and investors is high, making borrowers more vulnerable to rises in interest rates and/or reductions in income (e.g. associated with unemployment). This increases the risk of forced sales in a downturn leading to falls in house prices and flow-on effects on bank balance sheets and the broader economy. This is why we have been consulting on whether a DTI instrument should be included in the macro-prudential toolkit. We wouldn't seek to use it while the housing market continues to moderate.
ii) International risks
Other than unanticipated major geo-political developments, the main risk on the international side lies with the build-up of global debt.
If one examines why the large advanced economies move into recession it has generally been because of inflationary shocks (and the policy response to them) or problems in their financial sectors. For example, since the early 1970s the US economy has experienced five recessions. Three had their origins in sharp spikes in oil prices, and the last two resulted from asset price corrections that affected financial market stability.19
The likelihood of central banks having to lean hard against a rapid burst in global inflation looks to be low. Structural factors are playing a dominant role in the low inflation environment. These factors include: ongoing declines in the cost of information technology and capital goods; increasing global competition in the services sector (e.g. in education, health care, construction, retailing and distribution); the emergence of the gig economy;20 the technological revolution in the oil and gas industry that has dramatically lowered production costs and enabled new sources of supply; and the wage moderation that is taking place across the advanced economies. Wage moderation seems to be linked to several factors, such as the diminished bargaining power of labour, technological change, global outsourcing, demographics, and changes in labour market composition.
The greater risk lies in a large correction in asset prices that leaves investors with little or no equity in their investments at a time when the broader economy is under pressure. Two aspects are of concern in this regard:
- The global stock of non-financial sector debt is at a historical high of 220 percent of GDP - up from 180 percent in 2007.
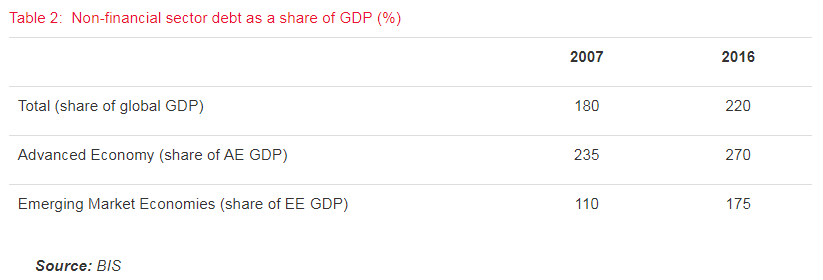
Most of the growth in debt has occurred in the emerging markets especially on the corporate side (which has increased from 55 percent to 95 percent of EE GDP) and household sector (from 20 percent to 35 percent). Most of the growth in advanced economy debt occurred in the general government sector - which rose from 70 percent to 115 percent of AE GDP).
- Asset valuations (e.g. fixed income, equities) are high relative to a variety of benchmarks. Whether current prices represent fair value depends a great deal on the outlook for future inflation and interest rates, particularly in the advanced economies.
On this front, financial markets remain confident that central banks will continue to maintain highly stimulatory monetary policy settings for the foreseeable future. Measures of financial market volatility remain close to historic lows. However, investors are acutely conscious that the major central banks are large holders of long- dated Government securities, (and some have corporate debt and equities in their portfolios), and are highly attuned to any hint of a possible tightening in policy rates or winding back in the scale of quantitative easing.
If growth in the global economy slows because of debt-related or other issues, our economy will be affected. However, there is scope to help buffer against such shocks. We have greater room for monetary policy manoeuvre than central banks in many advanced economies. Our Official Cash Rate is 1.75 percent - above the zero and negative policy rates of several advanced country central banks - and the Bank has not grossed up its balance sheet by buying domestic assets. Similarly, with budget surpluses and low net Government debt relative to GDP, the Government has flexibility on the fiscal policy side.
New Zealand's Monetary Policy Framework
i) Flexible inflation targeting remains highly relevant
Flexible inflation targeting was introduced by the RBNZ in 1990 and has been adopted by most central banks in the advanced economies and several emerging market economies.21 With inflation below target in nearly all advanced economies, there have been questions from time to time whether flexible inflation targeting is still an appropriate framework for monetary policy.
We believe that it is still the best monetary policy framework for New Zealand. It has helped to deliver low inflation while enabling the Bank to take account of domestic and external developments in framing its monetary policy responses. No country has abandoned flexible inflation targeting, nor has any country adopted nominal income targeting or price level targeting that are sometimes suggested as alternatives.22
ii) Maintaining flexibility in specifying the inflation goal
Central banks make monetary policy decisions by drawing on the data available, research, models, forecasts and judgement. At a technical level it involves estimating potential output, output gaps, and the neutral interest rate, and assessing the transmission mechanisms through which interest rate changes affect output growth and inflation, and the time lags involved.
Structural changes in the economy can have important effects on factors that are central to monetary policy decision making. We've seen the relationship between the output gap and inflation change with Philips curves flattening across the advanced economies, even in countries with rapid employment growth and low unemployment rates. The fact that the Reserve Bank has much less control over tradables inflation did not matter as much when the annual percentage change in import prices in world terms was 2.6 percent in the five years prior to the GFC, but it does when they have averaged minus 1.4 percent since March 2013.
The specification of a target range for CPI inflation should be the main focus of the Policy Targets Agreement (PTA). It's important that the PTA also recognise that several factors can cause inflation to move outside the target range and require the Bank to provide analysis and explanations in the Monetary Policy Statement when this occurs. Specifying a single inflation rate that the central bank should seek to achieve at all times should be avoided - it suggests a spurious accuracy that central banks are unable to deliver. A reference to the mid-point of the target range however, is appropriate - our research indicates this was a useful factor in reducing inflation expectations. 23
Some offshore commentators have suggested that central banks should raise their inflation targets, perhaps to around 4 percent, in order to move policy rates away from the effective lower bound and give central banks more policy flexibility to respond to any marked slowdown in activity. It is not clear that central banks could readily increase inflation to these levels and attempting to do so would further stimulate asset markets, at least in the short run. Raising an inflation target when productivity growth is weak makes little economic sense.
Some have suggested that the inflation goal should be specified in terms of core inflation rather than headline CPI inflation. A CPI benchmark has many benefits - it's easier to communicate because it more closely resonates with people's experience of living costs, and headline CPI inflation affects real rates of return and real wage outcomes that in turn influence household labour supply and spending decisions.
iii) The importance of continually reassessing policy settings
Monetary policy decisions involve balancing various risks facing the economy, while recognising that inflation outcomes and policy choices are often shaped by decisions that lie beyond the influence of the central bank.
Inevitably, central bank forecasts and assumptions require modification as new information becomes available. For example, the Bank raised the OCR four times in the first half of 2014. At that time the IMF were forecasting higher global growth and the New Zealand economy was growing rapidly, with the latter due to the terms of trade being at a 40-year high, strong construction activity, rising net immigration and highly accommodative monetary policy. We forecast a positive output gap and rising inflationary pressures. This view was shared by private sector forecasters and the IMF, and market pricing built in increases in the OCR.
By late 2014, the global economy was not strengthening as anticipated, oil prices had almost halved since June 2014 and whole milk powder prices were down by 40 percent. Faced with the prospect of a weaker economy and lower inflation pressures, the Bank moved to a neutral bias and then began the first of seven OCR cuts in June 2015.
Central banks do not expect to be able to accurately forecast commodity prices. What matters is that central banks make sensible decisions on the basis of the information available, reflect carefully on the views held by financial markets and key institutions, remain open-minded, carefully assess new information as it becomes available, and change their forecasts and policy settings when it considers it appropriate. We are satisfied that the Bank met these tests.
iv) Macro-prudential policy is valuable in addressing financial stability risks
Experience in several countries indicates that monetary policy is generally not a good vehicle for leaning against inflated asset prices. In these situations interest rates would have to increase very substantially in order to dampen asset prices and the rise in interest rates could do substantial damage to the economy by depressing spending, reducing risk taking, and undermining the competitiveness of the tradables sector.
Prudential and macro-prudential policies can play a valuable role in reducing the systemic risks to the banking system associated with inflated asset markets. We are likely to see macro-prudential instruments become even more important and widely deployed by countries in years to come.
Prudential regulation
On the prudential side, over the last five years we tightened prudential standards, adjusted inefficient or poorly targeted regulation and took steps to lower compliance costs. We completed the licensing of nearly 100 insurers. A year-long review of bank regulation, with a particular focus on policy development and regulatory processes, was undertaken with extensive consultation with the banking sector. We clarified and tightened the policy on outsourcing of banks' key functions and systems, and obtained Government approval for the regulation of key financial market infrastructures. We are currently reviewing the quality of bank capital instruments and assessing whether banks are adequately capitalised, and reviewing the effectiveness of the Insurance (Prudential Supervision) Act, 2010.
The IMF's Financial Sector Assessment Programme (FSAP) conducted last year identified the types of banking sector risks (high exposure to housing and inflated house prices, heavy reliance on external funding, exposure to commodity price fluctuations) that are regularly discussed in our Financial Stability Reports. It concluded that the banking system is well placed to withstand large but plausible shocks, as judged by a range of stress tests.
However, the IMF recommended, among other things, strengthening the macro-prudential regime to include a debt-to-income instrument, and addressing weaknesses in the approach to financial market infrastructures regulation and bank crisis resolution. There were no particular surprises in the IMF's recommendations, although they did comment that the Bank is not adequately resourced to support its existing low-intensity approach to banking regulation and supervision. We are reviewing the IMF's recommendations.
Operational business
In addition to meeting its responsibilities in respect of price stability and financial stability, the Bank manages a $27 billion balance sheet and runs several businesses that include treasury operations, payments systems, and currency and custody management. These businesses are undergoing major technology renewals and/or changes to their business models. A highlight of the last five years was the delivery of a new series of bank notes with enhanced security features that were well-received by the public and international bank note producers. A disappointing element was the failure of negotiations to sell New Zealand Clear.
Considerable emphasis has been placed on increasing the management strength across the Bank, benchmarking performance, testing back-up systems with the Auckland office and managing enterprise risk. This emphasis is essential as the Bank has broad responsibilities, conducted with only 260 staff, and needs to manage multiple business and policy-related risks.
Concluding comments
Every five year window brings its own set of challenges. On the international front we've seen increasing use of unconventional monetary policies, sluggish international trade, sharp swings in commodity prices, a continued rapid build-up in global debt, and unexpected political developments in Europe, the UK and the US.
Back home we've experienced the strongest migration surge since the 1800s, probably the longest period of negative tradables inflation since the Great Depression, a 75 percent decline in dairy prices before recovering, a major shift in resources to the non-tradables sector to support the Canterbury rebuild, and annual national house price inflation reached 21 percent.
Despite these challenges, the New Zealand economy has generally performed well during this time. Since 2012, GDP growth has averaged 2.8 percent and employment growth 2.5 percent. Both exceed the trend rate of growth. Headline CPI inflation averaged 1 percent due to 4½ years of negative tradables inflation, while core inflation averaged 1.4 percent.
Over the past five years, the Bank's monetary policy has been an important driver behind the rate of output and employment growth, and the path of non-tradable inflation and inflation expectations. Long term inflation expectations remain well anchored at the target mid-point of 2 percent.
We have also had a stable financial system. Nationwide annual house price inflation has declined to 1 percent due to LVR restrictions, the tightening in bank lending, the rise in mortgage rates and increasing concerns about housing affordability. LVR restrictions have been effective in reducing financial stability risks as house prices became increasingly stretched.
LVRs are not expected to be a permanent measure, but their removal would require a degree of confidence that financial stability risks won't deteriorate again. However, debt to income ratios have risen in recent years, and with the underlying drivers of housing demand (population growth, low interest rates) remaining strong and demand outstripping supply, there's a risk of a housing market resurgence (and a sharp lift in high LVR lending) if LVRs were removed at this time.
In the absence of major unanticipated shocks, prospects look promising for continued robust economic growth in New Zealand over the next two years. The greatest risk we face at this stage relates to the inflated global asset prices and the continuing build up in global debt.
If growth in the global economy slows, we have some scope to buffer our economy. We've greater room for monetary policy manoeuvre than central banks in many advanced economies. Our official cash rate is 1.75 percent - above the zero and negative interest rates of several advanced country central banks - and the Bank has not grossed up its balance sheet by buying domestic assets. With a budget surplus and low net debt relative to GDP, there's also flexibility on the fiscal policy side.
I wish to thank the Board of the Bank for their intensive scrutiny, support and advice over the past five years. The Board plays a critical role in monitoring the performance of the Bank and the Governor. I have been fortunate to work closely with three excellent and insightful chairs in Dr Grimes, Dr Carr and Dr Quigley.
Above all, I wish to thank my colleagues in the Bank. It has been a great pleasure to work with my fellow governors on the Governing Committee and with the Senior Management Group. The fact that the Bank continues to maintain a strong international reputation is due to the high calibre, dedication and commitment of colleagues throughout the institution.
1 The Reserve Bank is mandated by the Reserve Bank of New Zealand Act to contribute to New Zealand's economic growth by maintaining stable prices, promoting financial systems soundness and efficiency, and meeting the currency demands of the public
2 Major central banks in advanced economies have conducted around USD12 trillion of quantitative easing since 2008. Countries whose central banks currently have their main policy rate below ½ percent, account for around 1/3rd of world output.
3 Merchandise trade growth over the 5 years to 2017 was the slowest period of 5 year growth since the early 1980s. Protectionist measures and trade disputes in 2016 were at their highest level since the GFC.
4 The price of Brent Crude averaged USD 115/barrel from early 2011 to mid-2014 and fell to USD 28/barrel in January 2016. Over the past 12 months it has averaged around USD 50/barrel.
5 Global non-financial sector debt was 220 percent of global GDP in 2016, up from 180 percent in 2007.
6 Financial market volatility remains close to historic lows in equity, bond and fx markets (as shown by the MOVE index of US Treasury options, the VIX index of S and P options and the CVIX index of FX options).
7 Net permanent long-term migration of working age entrants has totalled 220,000 since 2012. This is equivalent to a 6 percent increase in the working-age population.
8 The labour force participation rate currently stands at 70 percent. The participation rate over the past 25 years has averaged 67 percent.
9 Tradables inflation was negative over the period 2012 Q2 to 2016 Q4, and averaged minus 1.2 percent per annum during that time.
10 Whole milk powder prices fall from USD 5208 per metric tonne in October 2013 and fell to USD 1590 per metric tonne in August 2015. They have averaged around USD 3100 per metric tonne in 2017.
11 The cost of Canterbury reconstruction following the four earthquakes is expected to be around NZD 40 billion in 2015 dollars. The insurance payout, expected to be around NZD 36 to 40 billion, is the 5th largest global insurance payout.
12 Average daily foreign exchange turnover in the NZ dollar averaged USD105 billion in April 2016, of which USD 40 billion were spot transactions.
13 New Zealand is ranked number 1 on the following international surveys: World Bank Group 'Doing Business Report, Transparency International's, 'Corruption Perceptions Index'; and is number 2 on the Institute for Economics and Peace's 'Global Peace Index'.
14 Labour productivity growth (real GDP/total hours worked) has been flat for the period since the beginning of 2013.
15 From 1993 Q3 to 2012 Q4 the Reserve Bank's sectoral factor model suggests annual core inflation was 2.2 percent.
16 As measured by the Reserve Bank's sectoral factor model. The target band is specified in terms of annual CPI inflation, not 'core' inflation.
17 Williams, R (2017) 'Business Cycle Review: 2008 to present day' RBNZ Bulletin Vol 80, No. 2, March 2017
18 Potential output refers to the sustainable long term growth path of the economy when resources are fully employed and price stability is achieved. The output gap reflects the difference between the level of output in the economy and potential output and, as such, indicates the degree of excess capacity or capacity constraints in the economy and the implications for inflationary pressures. We regard the neutral interest rate as the policy rate consistent with the economy growing at its potential in the medium term and having inflation expectations matching the price stability objective.
19 In the US the 1973-5, 1981-2, and 1990-91 recessions were triggered to a significant extent by sharp rises in oil prices in 1973 (OPECI), 1979 (OPEC2) and 1990 (Iraqi invasion of Kuwait). The 2001 recession was related to the collapse of the high-tech bubble, and the 2008-9 recession was due to the range of financial market and regulator factors that led to the GFC.
20 i.e. an increase in the use of temporary labour and contractors for short-term engagements.
21 Flexible inflation targeting involves assigning the central bank the explicit goal of maintaining inflation in a range of consistent with overall price stability, giving the central bank the independence to pursue that goal and holding it accountable for reaching the price stability objective.
22 Around 30 countries have adopted flexible inflation targeting.
23 See for example https://www.rbnz.govt.nz/-/media/ReserveBank/Files/Publications/Discussion%20papers/2016/dp16-07.pdf.