John McDermott: Looking at the stars
Speech by Dr John McDermott, Assistant Governor and Head of Economics of the Reserve Bank of New Zealand, to HiFX, Auckland, 26 July 2017.
The views expressed in this speech are those of the speaker and not the view of the BIS.
I would like to thank Jamie Culling for his help in the preparing this speech, along with assistance from Sarah Drought and other Bank colleagues.
Introduction
Thank you for inviting me to speak with you today; it is a pleasure to be here. Today I'm going to talk to you about the 'stars' I look at in the New Zealand economy. When looking at the stars, it is not a desperate attempt to adopt astrology to aid my understanding of the economy. Rather, I am looking at the trends in our economy. I will expand on this in a moment.
The Reserve Bank of New Zealand has operated a flexible inflation-targeting framework for nearly 30 years.1 Over time, the practice of inflation targeting has become more systematic and transparent. Transparency improves the understanding of our goals and policy intentions, which makes policy more effective and allows for more rational evaluations of the Bank's decisions. Today's speech adds to this transparency by outlining how we think about the trends of the New Zealand economy, and how knowing these trends helps us implement the flexible inflation targeting framework.
Our inflation targeting framework focuses on keeping future annual CPI inflation outcomes between 1 percent and 3 percent on average, over the medium term, with a focus on keeping future average inflation near the 2 percent target midpoint. Key to this is the notion that there is an equilibrium level at which the economy could operate that would be consistent with inflation remaining stable at 2 percent. In practice, the economy faces a range of shocks (such as a rise in the price of our exports, or an increase in net immigration) that push output away from its equilibrium. This would not be such an issue if there were no frictions in the economy and prices could adjust seamlessly - prices and wages would rise and fall across sectors, as required to re-allocate resources efficiently and move output back to its equilibrium level.
But the world is not so simple. Many frictions exist in the economy, which prevent or slow the adjustment in prices and output.2 For example, wages and prices are typically only reset periodically, and labour is often not quickly transferable across sectors and locations. These frictions create a role for monetary policy in stabilising the rate of inflation over the business cycle, while also seeking to moderate the swings in output away from its equilibrium level.3 To do this, the Bank influences interest rates across the economy, to stimulate or dampen output, and move inflation back towards its target level. The Bank lowers the Official Cash Rate (OCR) when inflation is weak, which encourages households and businesses to bring forward spending, thereby stimulating output leading to higher inflation. Conversely, when inflation is too strong, higher interest rates encourage savings and a delay in spending plans, which dampens output growth leading to lower inflation. In addition, changes in interest rates may alter the exchange rate and hence the relative price of domestic and foreign goods.
When we model the economy, the concept of a frictionless economy is represented, somewhat imperfectly, by a collection of interrelated and unobservable trends of key macroeconomic variables.4 These trends are the anchors around which we aim to stabilise the economy, and thereby inflation over the medium-term. While the Bank cannot influence many of these trends, estimating and understanding them is crucial for monetary policy to be set appropriately. As such, we devote a significant amount of time and effort to it.
In our economic models, these unobserved trends are conventionally denoted with the superscript 'star' (*). Three particularly important trends are: r* - the neutral interest rate; Y*- potential output; and e*- the equilibrium real exchange rate.
Another important unobservable variable is core inflation, or π*. Core inflation, along with future expectations of it, is a key variable we can influence. Although we target headline inflation, there are components of inflation we cannot control, such as commodity prices (e.g. oil), and changes in central and local government charges (e.g. changes in GST). Core inflation is useful because by filtering out temporary or unusual features, it provides a better guide to future medium-term inflation.
The framework we use, assessing output relative to trend and the OCR relative to the neutral interest rate, is an approach adopted by many of the flexible inflation-targeting central banks.5 As such, numerous central bank publications refer either directly to one of the trends mentioned above, or imply the concept of trends in their framework.6
In a number of speeches and publications over the past few years we have explained our thinking behind the important trends, or 'stars' if you like. This speech draws on recent work to provide an update on how we think about the trends in the New Zealand economy.
r* - The Neutral Interest Rate
First, we look at the neutral interest rate, r*.7 While there are a range of interest rates of different maturities and different levels of risk, each with their own trend, the benchmark neutral rate we estimate is the nominal neutral Official Cash Rate (OCR).8 The neutral interest rate is the rate of interest where desired savings equal desired investment, and can be thought of as the level of the OCR that is neither contractionary nor expansionary for the economy.9, 10 To put this another way, an OCR above neutral provides a headwind for output and inflation, while an OCR below neutral provides a boost to output and inflation.
Because the neutral OCR rate is unobservable, the Bank uses a range of models, surveys, and financial market prices to help form our estimate of neutral. We also care about real interest rates, and use a suite of models for inflation expectations (which also have a wide range of measures) alongside our neutral interest rate.11
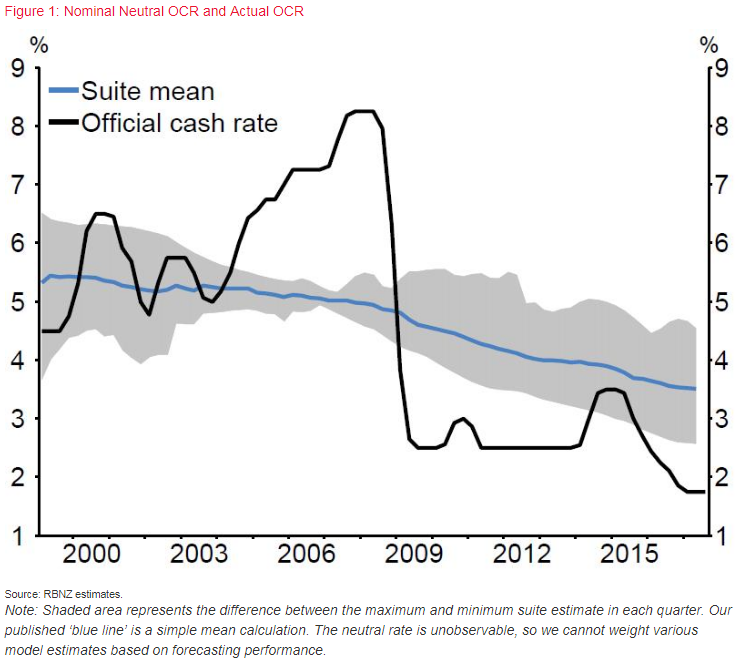
Over time, the neutral interest rate has been slowly falling; a trend that has been seen in many countries around the world. Economic theory tells us that changes in neutral real interest rates reflect changes in real economic factors such as population growth, productivity growth, preferences for savings, and world conditions.12 A combination of these factors appears to have been contributing to the fall in neutral, both in New Zealand and abroad.13
Currently, we estimate that the neutral interest rate has moved below 4 percent, with the median of the indicator suite currently sitting around 3 ½ percent (figure 1). Given the neutral rate is an unobservable long-run variable; it is very difficult to estimate precisely. The estimates in the models from our indicator suite currently range between 2.6 and 4.6 percent, highlighting the significant uncertainty around our estimate. Overall, a neutral rate of around 3 ½ percent implies that monetary policy is stimulatory at present, given an OCR of 1.75 percent. Upcoming projections will incorporate an assumption of a 3.5 percent neutral rate into our modelling frameworks. We have been factoring in this on-going decline in the neutral interest rate for some time, so the overall impact on the outlook for interest rates over our projection horizon from this particular update will be modest.
Y* - Potential output
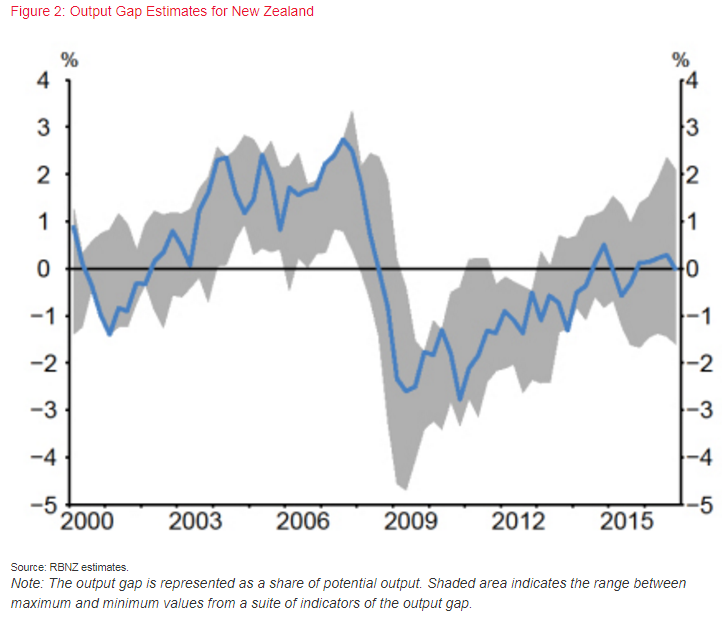
The neutral interest rate and the economy's potential output are interrelated, with both factors sharing common drivers. Potential output, or Y*, is the level of output that is sustainable, and is a useful conceptual tool in gauging aggregate output consistent with stable inflation.14 In our framework, the difference between the actual level of output and the level of potential output - the output gap (figure 2) - is a key influence on inflation.
In the short-run, frictions such as stickiness of nominal wages and other prices can prevent the economy from achieving its potential output when it is hit by a shock. When an economy is running ahead of its potential, a positive 'output gap' is said to exist, where pricing pressure increases in order to ration demand on scarce resources (such as capital and labour), boosting general inflation. The longer output is away from its potential, the greater the adjustments costs incurred as output converges back to potential. Sustaining growth and minimising these adjustment costs is highly desirable, given how much recessions hurt social and economic outcomes.15
Neither potential output nor the output gap can be directly observed. Ultimately, estimating potential requires determining whether movements in observed output are temporary cyclical movements, or permanent changes to the economy's structure. To estimate potential output, we use a production function approach that combines the inputs of production - labour and capital - along with total factor productivity.16
We have a range of uncertainty with respect to the output gap; around ± 2 percent of potential output. Given the challenges in estimating potential output in real time,17 we cross-check the results from this approach against a number of other potential output estimates, including estimates from time-series models, and fully-estimated structural models.18 Moreover, the estimate for the output gap is checked against a range of measures, including indicators from the labour market and business surveys.19 Given the important role that the potential output estimate (and thereby the output gap) plays in influencing inflation pressure, these estimates garner considerable discussion and scrutiny as part of the policy process, and are judgementally-adjusted as necessary.
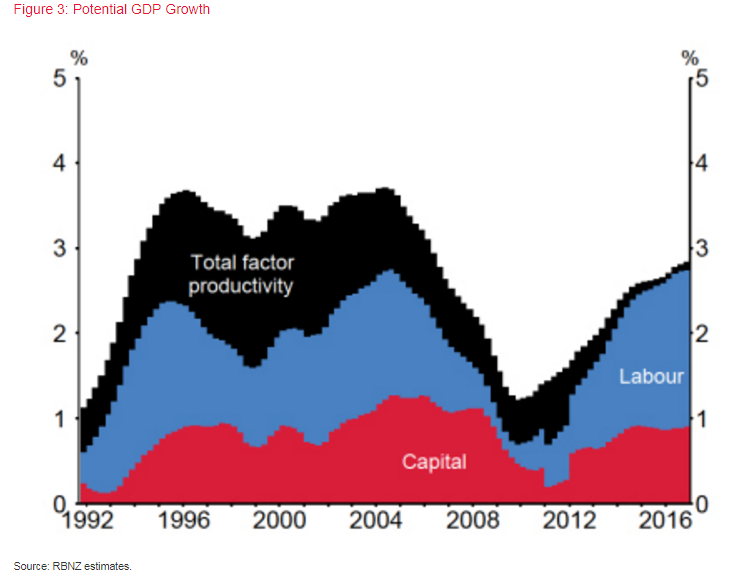
Potential output growth in New Zealand is currently estimated to be 2.9 percent per annum (figure 3). The current strength of potential output growth has been driven by growth in the labour supply (especially strong net immigration flows) and the capital stock. There has been almost no contribution from productivity growth in recent years.20 This is not unique to New Zealand, and is a heavily-debated topic internationally. There are multiple ideas behind waning productivity growth. Firstly, there could simply be less innovation now than in the past.21 Or, it may be the case that we just have not utilised recent innovations yet.22 Alternatively, measurement errors may be at play; for example, it is hard to measure efficiency gains from use of the internet or ICT services.23
e* - Equilibrium real exchange rate24
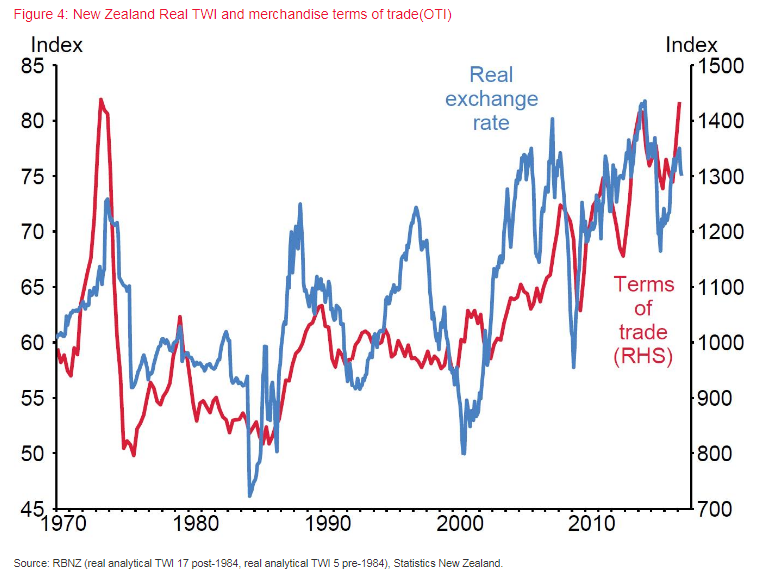
Of all the prices within our economy, the real exchange rate is one that is not subject to short-run rigidities. Indeed, the real exchange rate can and does move rapidly over time, as economic developments such as a rise in the terms of trade (figure 4) - the ratio of our export prices to import prices - are quickly reflected in its relative price. The fast-moving nature of the real exchange rate means it plays an important role in absorbing shocks to our economy.25 But while part of the movement in the real exchange rate over time reflects persistent fundamental developments (such as structural improvements in the terms of trade or changes in relative productivity), much of the movement in the real exchange rate reflects deviations away from its medium-term equilibrium level, e*. This feature of the exchange rate to 'overshoot' or 'undershoot' its equilibrium stems from the fact that currencies can react to incoming news instantly, while other prices (besides interest rates) are slower to adjust. These deviations may result in mis-allocation of resources between tradable and non-tradable goods.
There are various definitions of the equilibrium real exchange rate, which tend to focus on the drivers of the exchange rate over a given time horizon.26 The medium-term notion of equilibrium tends to be based on the value of the real exchange rate that would be consistent with internal balance (output at potential) and external balance (the current account sustainably financed).
One of the several models that the Bank uses is the macro-balance model, which assesses the degree to which the exchange rate is currently too high or too low in order to stabilise the net foreign liabilities (NFL) to GDP ratio at its current level.27 This model indicates that the current level of the real exchange rate is consistent with NFL remaining at about 60 percent of GDP, given the Bank's medium-term outlook for key economic variables (such as the terms of trade). However, it yields no further reduction in NFL-GDP from its current level. A lower New Zealand dollar would be needed to lower NFL-GDP and our external vulnerabilities further. Indeed, from a growth point of view, a lower real exchange rate would help rebalance growth towards the tradables sector, especially as not all traded industries are benefiting from the current high terms of trade.28
π* - Core inflation
As noted earlier, monetary policy typically has little influence on many underlying trends in the economy. But it does influence inflation, and expectations about future inflation, even if we cannot influence every price. A useful concept for a flexible inflation-targeting central bank is core inflation, which abstracts from one-off or highly volatile price movements, like large changes in the price of an individual product (e.g. oil). This is important because while idiosyncratic price movements can materially affect headline CPI inflation, they may not reflect fundamental or persistent sources of inflation pressure. Consequently, central banks often use core inflation as an important measure of inflation over which it has some control.29 Specifically, core inflation abstracts from noise and provides a clearer picture of how far inflation is from our objective under the Policy Targets Agreement. Because inflation is affected by factors outside of the Bank's control, and people's expectations need not coincide perfectly with the Bank's medium-term objective, we monitor a range of core inflation measures to gauge current inflation pressure.
The measures of core inflation we examine include, among others, model-based measures and exclusion-based measures.30 The model- and exclusion-based measures reflect the current central tendency of price movements, while other measures focus more directly on future (beliefs about) inflation outcomes. Our sectoral factor model reflects, in part, both concepts of core inflation.31
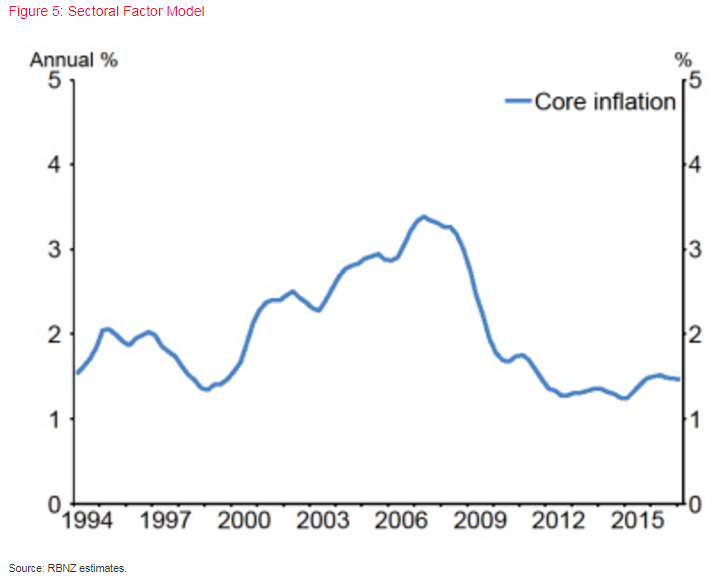
The sectoral factor model is our preferred measure of core inflation because it best predicts where headline inflation will converge to in the future once the transient noise dissipates, and is smoother than our other (relatively) more volatile core inflation measures.32 Based on this measure, core inflation is currently estimated to be 1.4 percent (figure 5), and has broadly tracked sideways over the past year. So while inflation pressures have lifted from the lows seen in early 2015, they still appear to be relatively moderate. Revisions to this measure occur from time to time, but the sectoral factor model is only one measure in our suite of inflation indicators, so changes to a single measure are unlikely to materially alter the overall assessment of inflation pressures at any particular period.
Conclusion
To set monetary policy we need to know where the key macroeconomic factors (such as interest rates, output, and the exchange rate) are tracking relative to their equilibrium levels, denoted by our 'stars'. These stars are unobservable and complex to estimate, so we use a range of techniques to help form our view of their values over time
Like the night sky, our stars keep moving. To respond to an evolving macroeconomic environment and set monetary policy appropriately, we keep track of the changes in the underlying state of the economy. Regularly explaining our view of the stars helps financial market participants and others better understand our analytical framework and policy decisions.
References
Adler, G., Duval, M. R. A., Furceri, D., Sinem, K., Koloskova, K., & Poplawski-Ribeiro, M. (2017). Gone with the Headwinds: Global Productivity. International Monetary Fund.
Archibald, J., & Hunter, L. (2001). What is the neutral real interest rate, and how can we use it? Reserve Bank of New Zealand Bulletin, 64(3), 15-28.
Armstrong, J. (2015). The Reserve Bank of New Zealand's output gap indicator suite and its real-time properties. Reserve Bank of New Zealand Analytical Note AN2015/08. Reserve Bank of New Zealand.
Armstrong, J., & Karagedikli, O. (2017). The role of non-participants in labour market dynamics. Reserve Bank of New Zealand Analytical Note. AN2017/01. Reserve Bank of New Zealand.
Armstrong, J., Kamber, G., & Karagedikli, O. (2016). Developing a labour utilisation composite index for New Zealand. Reserve Bank of New Zealand Analytical Note. AN2016/04. Reserve Bank of New Zealand.
Barro, R., & Sala-i-Martin, X. (2003). Economic Growth, Second Edition. MIT Press. ISBN: 9780262025539.
Bascand, G. (2017). New Zealand's net foreign liabilities: What lies beneath, and ahead?. A speech delivered to MOTU, at the Royal Society of New Zealand, Wellington on 17 July 2017. Reserve Bank of New Zealand.
Berkmen, S. P., Gelos, G., Rennhack, R., & Walsh, J. P. (2012). The global financial crisis: Explaining cross-country differences in the output impact. Journal of International Money and Finance, 31(1), 42-59.
Bernanke, B. S. (2005). The global saving glut and the US current account deficit (No. 77). Sandridge Lecture, Virginia Association of Economists.
BoE. (2017) Inflation Report. May 2017. Bank of England
Brynjolfsson, E., & McAfee, A. (2014). The second machine age: Work, progress, and prosperity in a time of brilliant technologies. WW Norton & Company.
Chetwin, W., & Wood, A. (2013). Neutral interest rates in the post-crisis period. Reserve Bank of New Zealand Analytical Note AN2013/07. Reserve Bank of New Zealand.
Conway, P. (2016). Achieving New Zealand's Productivity Potential. Productivity Commission Research Paper 2016/1. Productivity Commission.
FOMC. (2017). Minutes of the Federal Open Market Committee. May 2-3, 2017.
Gordon, R. J. (2016). The rise and fall of American growth: The US standard of living since the civil war. Princeton University Press.
Graham, J., & Steenkamp, D. (2012). Extending the Reserve Bank's macroeconomic balance model of the exchange rate Reserve Bank of New Zealand Analytical Note AN2012/08. Reserve Bank of New Zealand.
Jarocinski, M., & Lenza, M. (2016). How large is the output gap in the euro area. ECB Research Bulletin, 24(1).
Kamber, G., & Wong, B. (2016). Testing an Interpretation of Core Inflation Measures in New Zealand. Reserve bank of New Zealand Analytical Note AN2016/06. Reserve Bank of New Zealand.
Karagedikli, O., Ryan, M., Steenkamp, D., & Vehbi, T. (2013) What happens when the Kiwi flies? Sectoral Effects of the Exchange Rate Shocks. Reserve Bank of New Zealand Discussion Paper DP2013/05. Reserve Bank of New Zealand.
Kato, T. (2009). Impact of the Global Financial Crisis and Its Implications for the East Asian Economy. In keynote speech, Korea International Financial Association, First International Conference, Seoul, Korea.
Kirker, M. (2010). What drives core inflation? A dynamic factor model analysis of tradable and non-tradable prices. Reserve Bank of New Zealand Discussion Paper DP2010/13. Reserve Bank of New Zealand.
Lewis, M. (2016). Inflation expectations curve: a tool for monitoring inflation expectations. Reserve Bank Analytical Note, AN2016/01. Reserve Bank of New Zealand.
Lienert, A., & Gillmore, D. (2015). The Reserve Bank's method of estimating "potential output". Reserve Bank of New Zealand Analytical Note AN2015/01. Reserve Bank of New Zealand.
McDonald, C. (2012). Kiwi drivers: the New Zealand dollar experience. Reserve Bank of New Zealand Analytical Note AN2012/02. Reserve Bank of New Zealand.
Okun, A. M. (1963). Potential GNP: its measurement and significance (pp. 98-103). Yale University, Cowles Foundation for Research in Economics.
Parker, M. (2016). Price-setting behaviour in New Zealand. New Zealand Economic Papers, 1-20.
Pescatori, A., & Turunen, J. (2015). Lower for longer: Neutral Rates in the United States. IMF Working Paper. WP/15/135.
Price, G. (2013). Some revisions to the sectoral factor model of core inflation. Reserve Bank of New Zealand Analytical Note AN2013/06. Reserve Bank of New Zealand.
Ranchhod, S. (2013). Measures of New Zealand core inflation. Reserve Bank of New Zealand Bulletin, 76(1). Reserve Bank of New Zealand.
RBA. (2017). Minutes of the Monetary Policy Meeting of the Reserve Bank Board. 4 July 2017. Reserve Bank of Australia.
Richardson, A., & Williams, R. (2015). Estimating New Zealand's neutral interest rate. Reserve Bank of New Zealand Analytical Note, AN2015/05.
Steenkamp, D. (2016). Factor substitution and productivity in New Zealand. Reserve Bank of New Zealand Discussion Paper DP2016/12. Reserve Bank of New Zealand.
Summers, L. H. (2014). US economic prospects: Secular stagnation, hysteresis, and the zero lower bound. Business Economics, 49(2), 65-73.
Svensson, L (1999) 'Inflation targeting: Some extensions'. Scandinavian Journal of Economics 101(3), pp 337-361.
Williams, J. (2016). Monetary Policy in a Low R-star World. FRBSF Economic Letter. 2016-23.
Woodford, M. (2003). Interest and Prices: Foundations of a Theory of Monetary Policy. Princeton University Press.
1 The Reserve Bank of New Zealand Act 1989 came into force on 1st February, 1990.
2 See Parker (2016) for a discussion of firms' price setting behaviour in New Zealand.
3 At its core, flexible inflation targeting highlights the objective of monetary policy - stable inflation - whilst also permitting flexibility in the short-run trade-off between inflation control and economic stability.
4 The frictionless economy referred to here is broadly consistent with a New Keynesian perspective outlined in Woodford (2003).
5 See Svensson (1999).
6 See, for example, RBA (2017); BoE (2017); FOMC (2017); Jarocinski & Lenza (2016).
7 In much academia and policy research, r* will denote the real neutral interest rate, which is the nominal neutral interest rate minus expected inflation. Here, I am referring to nominal rates, assuming inflation expectations are stable.
8 Richardson & Williams (2015) provide detail on estimation of the neutral interest rate.
9 For further detail on the definition of the neutral rate, see Chetwin & Wood (2013).
10 Savings in this context could be thought of as domestic or foreign savings, if referring to a closed or open economy, respectively.
11 Lewis (2016) uses various surveyed measures of inflation expectations and yield curve modelling techniques to develop a framework for monitoring inflation expectations.
12 For example, a sustained fall in productivity growth lowers the returns to investment, making it less desirable to invest. If the desire to invest falls and the desire to save remains unchanged, a lower neutral rate will be required to reconcile savings and investment plans. For further discussion of factors that can affect the neutral rate, see Archibald & Hunter (2001), and Williams (2016).
13 For a discussion on the lower neutral rate, see Pescatori & Turunen (2015); return on investment, see Summers (2014); the "global savings glut" hypothesis, see Bernanke (2005); demographics, see Barro & Sala-i-Martin (2003).
14 This definition of potential output follows Okun (1963). Potential output here refers to the goods market. A related concept in the labour market is the natural rate of unemployment (NAIRU). Like the other trend variables presented here, it is unobservable and subject to uncertainty.
15 For example, Kato (2009) and Beckman et al. (2009) both discuss the effects of the Global Financial Crisis on Asia and developing economies, respectively.
16 For details surrounding our estimations of potential output, see Lienert & Gillmore (2015).
17 Challenges arise on a number of fronts, including that potential output can vary substantially over time and that data revisions to GDP in particular can result in substantial revisions to our estimates of potential output in "real-time" versus ex-post.
18 For details on our estimation of the output gap, see Armstrong (2015).
19 For a discussion of labour market flows and dynamics, see Armstrong & Karagedikli (2017) or Armstrong, Kamber, & Karagedikli (2016).
20 For discussion on New Zealand's productivity performance, see Steenkamp (2016) or Conway (2016). Steenkamp produces aggregate TFP estimates for New Zealand, while Conway outlines why New Zealand has struggled to lift productivity in recent decades.
21 For example, OECD (2016) shows that government R&D budgets are receding in many countries.
22 There is debate as to whether the slowdown in innovation is permanent, or whether it is temporary as breakthroughs in Artificial Intelligence and robotics loom. See Gordon (2016), or Brynjolfsson, E., & McAfee, A. (2014).
23 Particular internet-based services (e.g. Google searches or Wikipedia) are largely not reflected in GDP measurements, as there is often no price attached to their use. See Box 1 in Adler, et al. (2017) for further information.
24 The real exchange rate is the nominal exchange rate, measured on a trade-weighted basis, adjusted for the relative prices between New Zealand and our trading partners. This captures the fact that New Zealand faces many exchange rates, and a weighted measure of individual bilateral exchange rates is necessary to summarise the country's exchange rate position.
25 For discussion on the role of the exchange rate as a shock absorber, see: Karagedikli, et al. (2013).
26 The drivers of New Zealand's exchange rate are examined in McDonald (2012).
27 Graham & Steenkamp (2012) outline the macroeconomic balance model.
28 For discussion on recent developments in New Zealand's NFL, see Bascand (2017).
29 For discussion surrounding drivers of core inflation in New Zealand, see Kirker (2010).
30 A number of core inflation measures are discussed in Ranchhod (2013).
31 "The sectoral factor model provides a measure of core inflation that distinguishes between price movements in the two major sectors of the economy, and hence helps to identify where inflationary pressures are coming from." (Price, 2013, pg. 2).
32 For further details on the econometric assessment of the sectoral factor model, among others, see Kamber & Wong (2016).