Sectoral price dynamics in the last mile of post-Covid-19 disinflation

The drivers of the Covid-19 inflation surge have evolved as demand has shifted, first from services to goods and then back from goods to services. We document the sectoral price growth patterns since the surge and discuss what the composition of inflation implies for the outlook. We find that the contribution of services has increased and has been slower to retreat than that of goods excluding food and energy ("core goods"). This could imply slower disinflation ahead, especially given the relative stickiness of services prices and past relative price trends. We then discuss the implications for monetary policy.1
JEL classification: E31, E52.
After reaching highs not seen in decades, inflation has receded while its drivers have evolved. In the earlier phases of the inflation surge associated with the Covid-19 pandemic, reports of rocketing prices for used cars and other durable goods dominated the news, along with eye-popping commodity prices. In the later phases, attention shifted to the increasing cost of shelter and restaurant meals.
The composition of inflation across goods and services can give indications about inflation dynamics. How have sectoral price growth patterns changed during the current episode? What do they imply for underlying inflationary pressures and the outlook? Answers to these questions matter for monetary policy as central banks navigate the last mile of the post-pandemic disinflation journey.
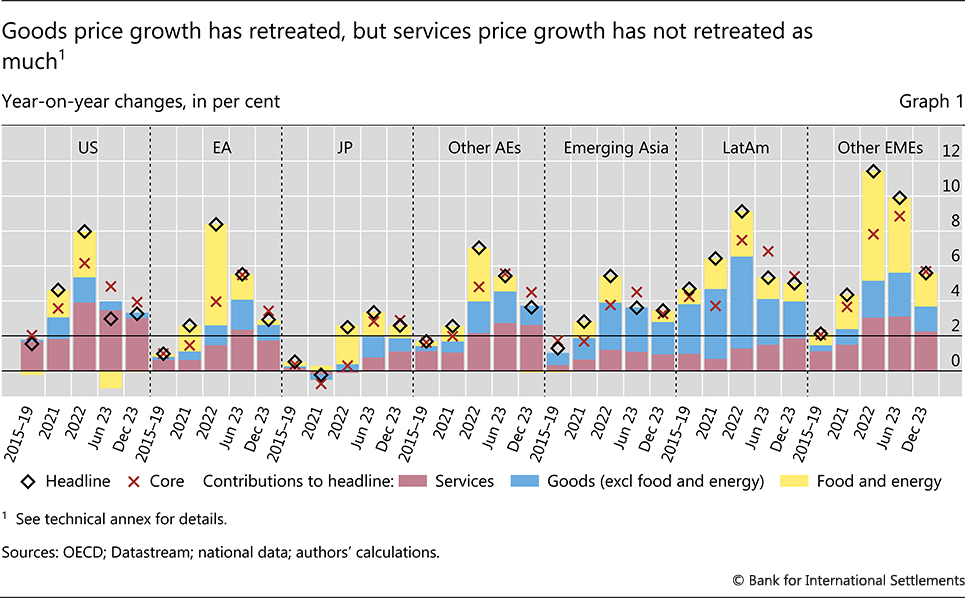
We document several noteworthy patterns. The initial surge in inflation in 2021 came largely from a spurt in the prices of food and energy and "core goods" (such as manufactured goods). Services prices picked up later, in 2022. The disinflation observed in 2023 largely resulted from a decline in the contributions of food and energy and, to a lesser extent, core goods. Services price growth proved more stubborn.
Going forward, this shift towards more services-driven inflation may imply slower disinflation. This is because of three factors. First, services prices are less sensitive to energy prices and, hence, may not respond strongly to their recent declines. Second, price growth in services tends to be more persistent than that in goods, in part because of the higher labour intensity of services. Third, the pandemic brought about substantial deviations in the relative price of services vis-à-vis core goods from its previously established trend; if this trend re-asserts itself, services prices could increase further to catch up. This possible slowdown of disinflation could prompt monetary policy to remain tighter for longer.
Key takeaways
- Services price growth played a smaller role than core goods price growth in the initial phases of the inflation surge, but its importance has grown over time.
- On balance, a larger contribution from services may make inflationary pressures more stubborn in the near term, as services inflation is structurally more persistent. This is even more likely if services prices increase faster to catch up with pre-pandemic relative price trends.
- Monetary policy may need to remain tight for longer to achieve a given inflation objective than if inflation mainly reflected faster growth in core goods prices.
The remainder of this special feature proceeds as follows. The next section breaks down headline inflation to reveal the contributions from goods and services. It then discusses possible reasons behind the evolution of these contributions. The feature then lays out what the changes in the composition of inflation may imply for its dynamics going forward. It concludes with a discussion of challenges for monetary policy in this context.
Goods vs services prices in the current inflation episode
Services price growth played a smaller role than goods price growth in the initial phases of the inflation surge, but its imprint has grown over time. The relative contribution to headline inflation of core goods as well as that of food and energy surged in 2021, while the marked increase in that of services came only later in 2022 (Graph 1; blue and yellow bars compared with red bars). These dynamics have played out in a similar way across countries and regions, but less so in Asian emerging market economies (EMEs) and Latin America.
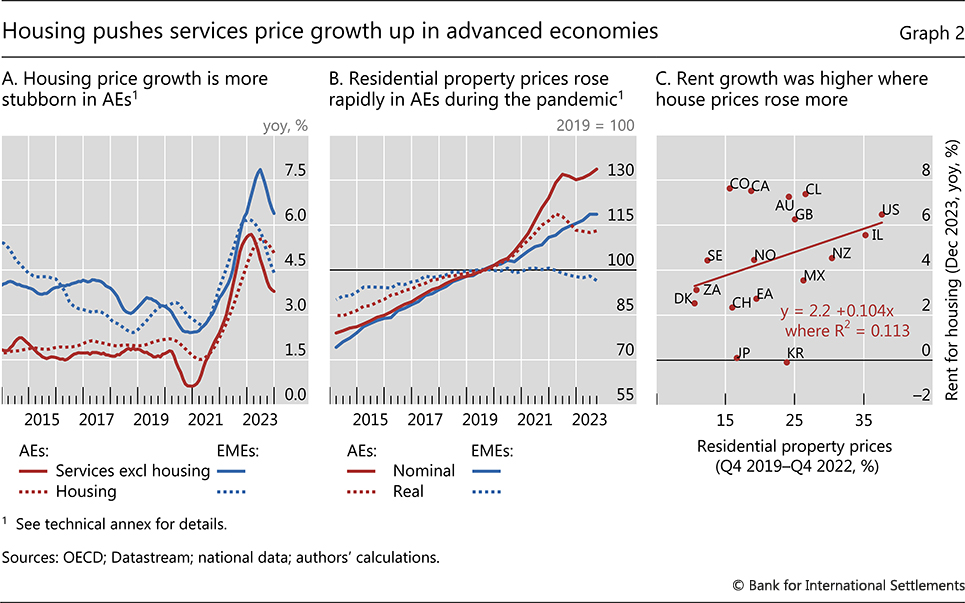
The dynamics within services have differed between advanced economies (AEs) and EMEs. The housing component has held its ground in AEs while the non-housing component has moderated. In EMEs, by contrast, the prices of housing-related services have led the decrease in services price growth (Graph 2.A). One possible reason for this is that house prices picked up much more in AEs than in EMEs during the pandemic (Graph 2.B).2 These increases percolate to the housing component of prices via their impact on new supply and rents, but only with a lag (Graph 2.C).3, 4 In some countries, a combination of strong household formation rates and subdued supply of new and existing homes due to higher financing costs has boosted the growth in the housing component of prices.
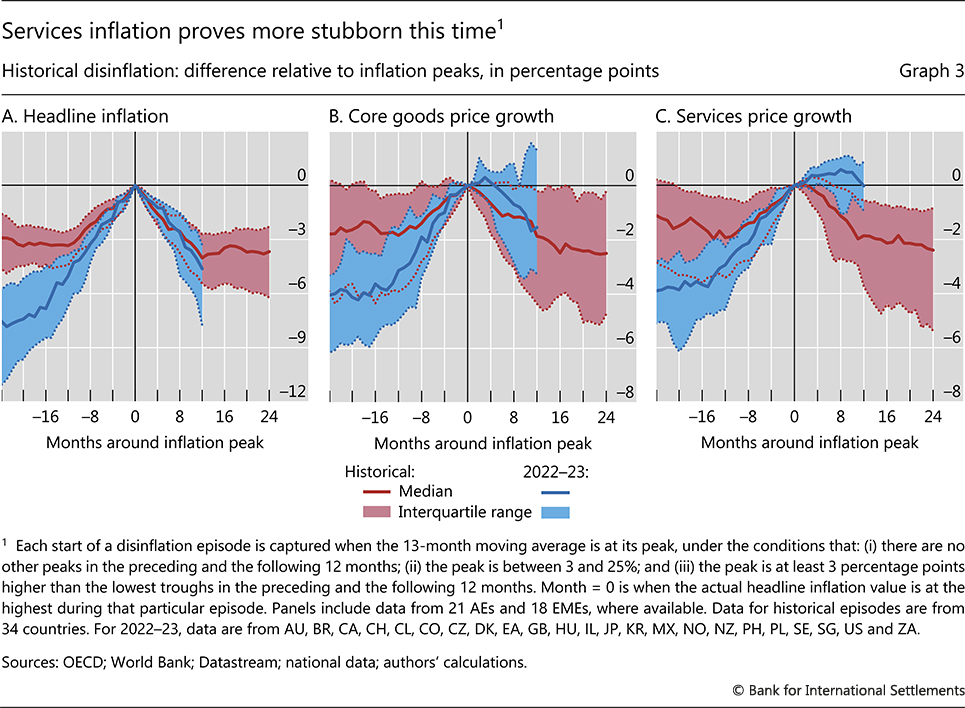
Compared with past inflation episodes, services price growth has been more stubborn. While the current pace of deceleration in both headline inflation and the core goods component matches the previous cases quite closely (Graphs 3.A and 3.B), services price growth has continued to rise even after headline inflation peaked (Graph 3.C).
These patterns reflect two factors that ignited the inflation burst and then partially reversed it (BIS (2022, 2023)).
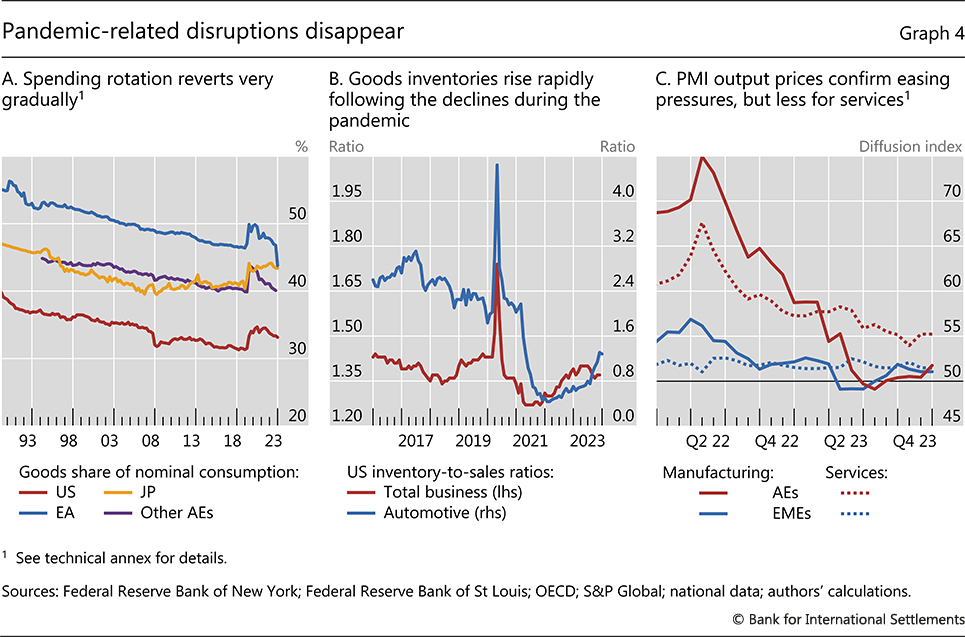
The first factor is the unusually sharp rotation of demand from services to goods and the associated unprecedented supply chain disruptions. As a result, the relative price of services vis-à-vis core goods initially declined, especially in AEs. However, as economies reopened, the rotation started to slowly revert (Graph 4.A). This back-and-forth shift alone can explain a considerable portion of the recent inflation dynamics.5 Eventually, supply chains normalised, and much of the surge in core goods price growth reversed. Amplification mechanisms were also at work, as firms along the supply chain first hoarded inventories and then unloaded them onto the market, magnifying price moves – the so-called bullwhip effect (Rees and Rungcharoenkitkul (2021)). Indeed, total business inventories rose throughout 2022 and started to decline recently (Graph 4.B). Accordingly, upward price pressures for both inputs and outputs in manufacturing dissipated, and core goods prices even fell for a brief period (Graph 4.C).
The second factor behind the inflation burst is the surge in energy prices related to the war in Ukraine. While this shock was common to both core goods and services, it had a larger and more immediate impact on the prices of core goods.6 The subsequent decline in energy prices set in motion the opposite process.
Implications for the inflation outlook
What does the change in the composition of inflation towards services imply for the outlook? On balance, it may make inflationary pressures more stubborn, for three reasons. First, services price growth is less sensitive to energy prices and will not benefit much from their recent declines. Second, services price growth is structurally more persistent than growth of goods prices. Third, the relative price of services may not have fully adjusted yet. On balance, these implications may matter more for AEs, which have higher shares of services in their consumer price indices.
Sensitivity to energy prices
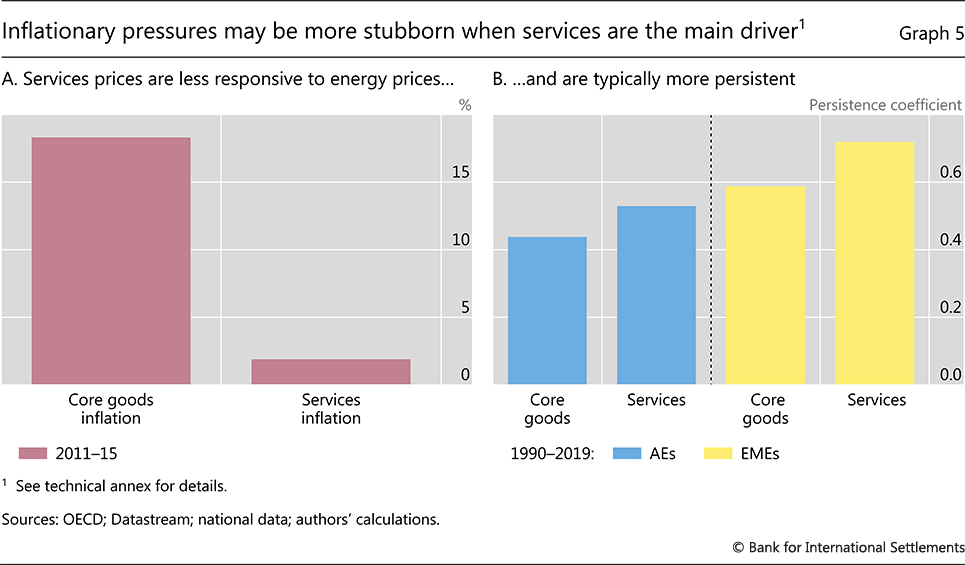
Services prices are less sensitive to energy prices than core goods prices. Following an energy price shock, core goods prices are estimated to increase about 10 times higher than services prices (Graph 5.A). This reflects in part the higher energy intensity of core goods: the quantity of energy needed to produce one unit of economic output in services is roughly a tenth of that in goods.7 As a result, the current disinflation in energy prices will have less impact on the overall inflation rate going forward.
Persistence
Services price growth is typically more persistent than core goods price growth, and this could slow down the deceleration of overall inflation going forward.8 The difference in persistence is noticeable across both AEs and EMEs (Graph 5.B). Of a given year's services price growth, roughly 50% in AEs and almost 70% in EMEs carry over to the next year, compared with 40% in AEs and 60% in EMEs for core goods price growth.9
Higher persistence is partly due to the much higher labour intensity of services. This makes services prices more sensitive to wage growth than core goods prices (Graph 6.A).10 Wage growth is the most persistent type of cost. This reflects the length of contracts and other institutional labour market characteristics.
The higher labour intensity of services puts the spotlight on the labour market. Indicators of wage growth have pointed to a notable acceleration after the acute phase of the pandemic and a moderation more recently (Graph 6.B). Still, it is quite plausible that wages are rising at rates inconsistent with inflation targets given sluggish productivity growth. Labour market tightness and real wages falling well below trends from before the inflation burst add to the risks ahead (Graph 6.C).11
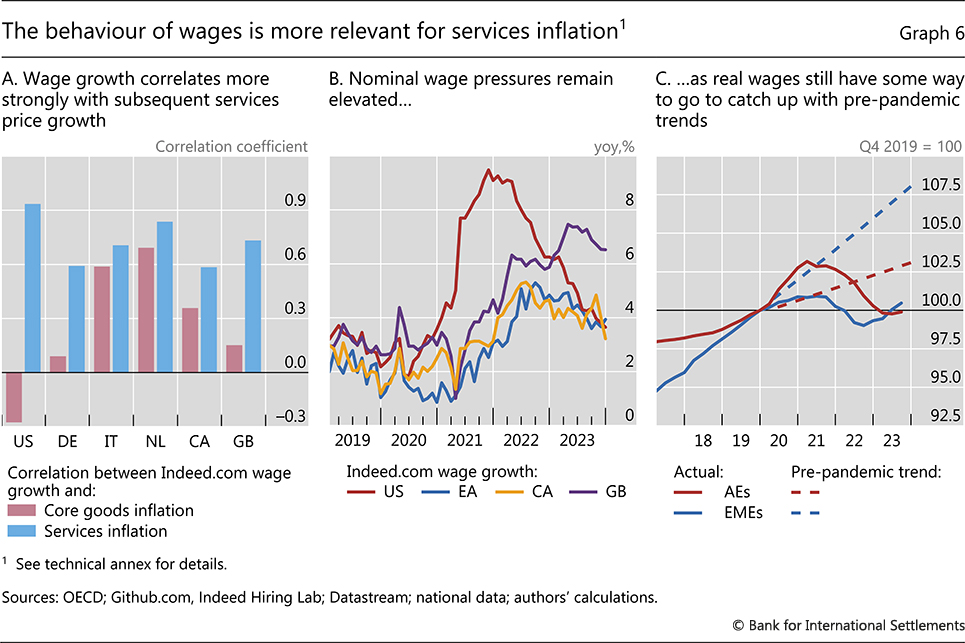
These risks increase the longer inflation remains above target, which could lead to an adjustment in wages.
Relative price adjustment
In the decades leading up to the pandemic, services price growth was about 1 percentage point higher than core goods price growth on average, which gave rise to an upward trend in the price of services relative to core goods. This trend had been well established and steady in pre-pandemic data for many countries and mainly reflected the confluence of two factors. First, a higher income elasticity of services: as income per capita rises, so does the relative demand for services and hence their relative price. Second, in what is commonly known as the Baumol cost disease, rising wages in higher productivity sectors push the costs in labour-intensive services sectors up, while lower productivity growth in the services sector then leads to higher services prices.12
The pandemic disrupted this trend with core goods prices growing much faster than usual and, in some cases, even faster than services prices. This disruption may have been only temporary, however, as the growth differential between core goods and services has reverted to the pre-pandemic pattern.
Further reading
Services price growth may continue to be significantly higher than core goods price growth for some time if the pre-pandemic relative price trends are restored. The price of services vis-à-vis core goods in EMEs is still well below its 2019 pre-pandemic level, while it is just barely back there in AEs (Graph 7.A). In both cases, the relative price remains below the previous trend. As the pandemic shock is unlikely to have produced a permanent shift in preferences and productivity patterns, the pre-pandemic trend could re-establish itself.
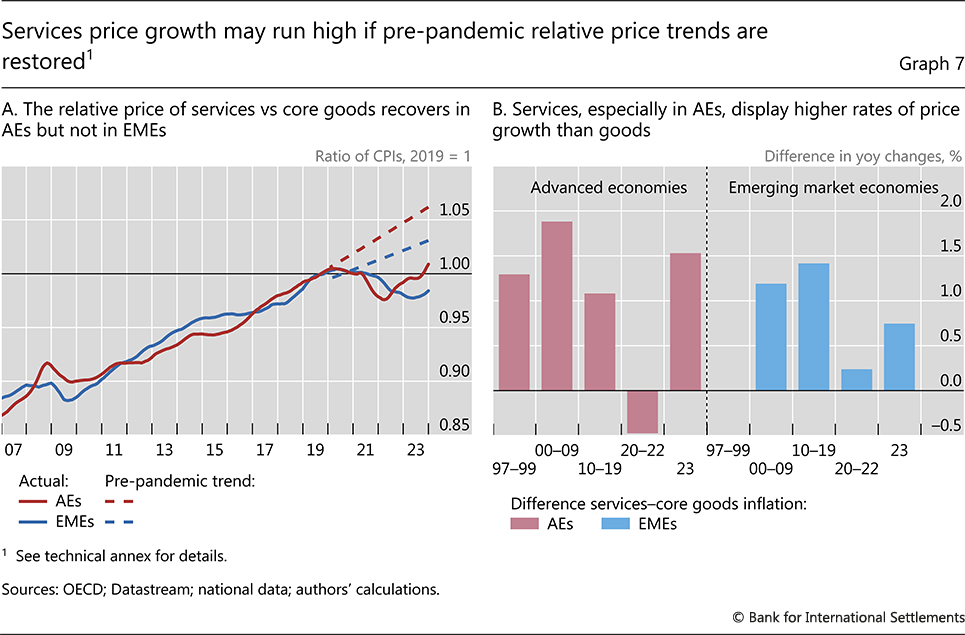
Should the trend re-assert itself, overall inflation could remain above central bank targets for longer. This would be the case unless core goods price growth slows to a rate well below the pre-pandemic one, as a back-of-the-envelope calculation suggests. Assuming core goods price growth goes back to its pre-pandemic rate of about 0.6% for AEs and 2.7% for EMEs, services prices would have to grow at an annual rate of 4.7% for AEs and 6.1% for EMEs over the next two years13 for the relative price of services to catch up with the pre-pandemic trend. To put these figures into perspective, average annual services price growth in the 2021–23 period was 3.8% for AEs and 5% for EMEs, compared with annual averages just below 2% for AEs and about 4% for EMEs in 2010–19 (Graph 7.B). Importantly, these scenario-based higher growth rates of services prices would imply overall inflation rates that are roughly 1 percentage point above inflation targets. However, the scenario embeds the implicit assumption that central banks will not react; this is not going to be the case if inflation remains above target.
Monetary policy challenges
Disinflation is in progress in 2024, but the job is not yet done. The analysis in this special feature suggests that the larger contribution of services to inflation could sustain underlying inflationary pressures in the short term. If so, monetary policy would have to stay tighter to achieve a given inflation objective than would be the case if inflation mainly reflected faster growth in goods prices.
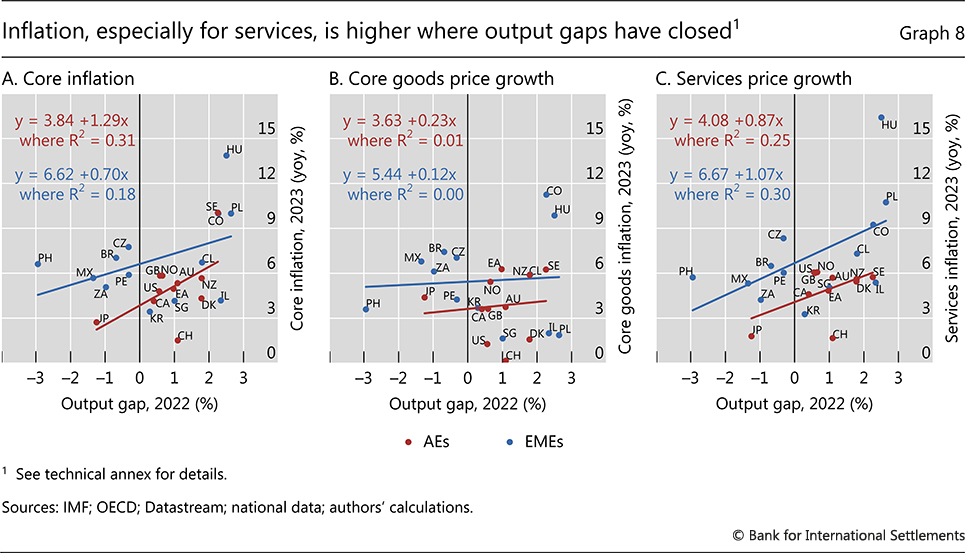
Still, with services-driven inflation, some factors could reduce the extent of monetary policy restrictiveness. In particular, monetary policy may be more impactful at this stage, as services price growth is much more responsive to domestic economic slack than core goods price growth; hence, the correlation of services price growth with domestic output gaps is higher in both AEs and EMEs (Graph 8).14 Consistent with this observation, a global services factor explains roughly 18% of services price growth since 1990, while the corresponding share for core goods price growth is higher, at 25%. The main reasons for the greater responsiveness of services price growth to domestic slack are lower tradability and the stronger dependence on domestic labour markets. To be sure, manufacturing prices are more sensitive than services prices to the exchange rate – another key channel of monetary policy. But this channel tends to be less powerful when central banks tighten collectively, as they have done in the current episode, since this limits adjustments in exchange rates.
While goods prices in some jurisdictions in late 2023 and early 2024 are below previous trends, global forces can structurally alter the dynamics of inflation in the longer term. Climate change could create upward pressures on goods prices through more severe disruptive weather events or drought-induced restrictions on freight shipping in waterways. Geopolitical tensions could add to these pressures, including through a reorganisation of global value chains. This means that, all else equal, services price growth may have to be much lower than it was in the decades that preceded the pandemic if inflation targets are to be achieved.
Whether structural forces could support lower services price growth is not clear. On one hand, artificial intelligence and digitalisation could increase productivity and lower costs, perhaps disproportionately in the services sector. On the other hand, ageing and labour scarcity could work in the opposite direction for this labour-intensive sector.
References
Altissimo, F, B Mojon and P Zaffaroni (2009): "Can aggregation explain the persistence of inflation?", Journal of Monetary Economics, vol 56, no 2, pp 231–41.
Angeloni, I, L Aucremanne, M Ehrmann, J Galí, A Levin and F Smets (2006): "New evidence on inflation persistence and price stickiness in the euro area: implications for macro modelling", Journal of the European Economic Association, vol 4, no 2/3, pp 562–74.
Babecký, J, F Coricelli and R Horváth (2009): "Assessing inflation persistence: micro evidence on an inflation targeting economy", Czech Journal of Economics and Finance, vol 59, no 2, pp 102–27.
Bank for International Settlements (BIS) (2022): Annual Economic Report, Chapter I.
----- (2023): Annual Economic Report, Chapter I.
Borio, C, M Lombardi, J Yetman and E Zakrajsek (2023): "The two-regime view of inflation", BIS Papers, no 133, March.
Clark, T (2006): "Disaggregate evidence on the persistence of consumer price inflation", Journal of Applied Econometrics, vol 21, no 5, pp 563–87.
Cœuré, B (2019): "The rise of services and the transmission of monetary policy", speech at the 21st Geneva Conference on the World Economy, 16 May.
Corsetti, G, J Duarte and S Mann (2022): "One money, many markets", Journal of the European Economic Association, vol 20, no 1, pp 513–48.
Di Giovanni, J, Ş Kalemli-Özcan, A Silva and M Yildirim (2022): "Global supply chain pressures, international trade, and inflation", National Bureau of Economic Research Working Papers, no 30240.
Dias, D and J Duarte (2019): "Monetary policy, housing rents and inflation dynamics", Board of Governors of the Federal Reserve System International Finance Discussion Papers, no 1248.
Eiglsperger, M, R Arioli, B Goldhammer, E Gonçalves and O Kouvavas (2022): "Owner-occupied housing and inflation measurement", ECB Economic Bulletin, issue 1/2022.
Federal Reserve Bank of New York (2023): "Multivariate core trend inflation", November update.
Ferrante, F, S Graves and M Iacoviello (2023): "The inflationary effects of sectoral reallocation", Board of Governors of the Federal Reserve System International Finance Discussion Papers, no 1369.
Igan, D, E Kohlscheen and P Rungcharoenkitkul (2022): "Housing market risks in the wake of the pandemic", BIS Bulletin, no 50, March.
Koeniger, W, B Lennartz and M-A Ramelet (2022): "On the transmission of monetary policy to the housing market", European Economic Review, vol 145, 104107.
Lazarowicz, T and M Richard (2023): "Winners and losers from monetary policy: evidence from the UK rental market", mimeo.
Liu, Z and M Pepper (2023): "Can monetary policy tame rent inflation?", Federal Reserve Bank of San Francisco Economic Letters, no 2023-04.
Rees, D and P Rungcharoenkitkul (2021): "Bottlenecks: causes and macroeconomic implications", BIS Bulletin, no 48, November.
Technical annex
Graph 1: Simple averages for the years. GDP-purchasing power parity (PPP) weighted averages for: other AEs = CA, CH, DK, GB, NO and SE; emerging Asia = KR, PH and SG; Latin America = BR, CL, CO, MX and PE; other EMEs = CZ, HU, IL, PL and ZA. Core inflation does not add up to the sum of services (red bar) and goods (blue bar) because the latter includes the contributions to headline inflation.
Graph 2.A: GDP-PPP weighted averages for 11 AEs and 13 EMEs (not including CN). Six-month moving averages.
Graph 2.B: GDP-PPP weighted averages for 11 AEs and 21 EMEs (not including CN).
Graph 4.A: Other AEs = GDP-PPP weighted average of AU, CA, DK, GB, NO, NZ and SE.
Graph 4.C: Purchasing managers' indices: a value above (below) 50 indicates that the number of firms reporting increasing price pressures is higher (lower) than the number reporting decreasing price pressures. GDP-PPP weighted averages; for manufacturing, six AEs and 14 EMEs; for services, five AEs and three EMEs.
Graph 5.A: Result of a doubling of energy prices aggregated at the global level using OECD inter-country input-output tables, following the methodology of Di Giovanni et al (2022).
Graph 5.B: Based on a panel regression of year-on-year (yoy) inflation on its one-year lag, with country fixed effects. Unbalanced quarterly panel of 11 AEs and 13 EMEs (not including CN).
Graphs 6.A–B: The Indeed Wage Tracker measures growth in wages advertised in job postings. Correlations between yoy growth rates, since January 2020, where data are available. Wages lagged by 12 months.
Graph 6.C: Real wages are computed by deflating nominal wages with headline consumer price index (CPI) inflation. National definitions. GDP-PPP weighted four-quarter moving averages for four AEs and four EMEs. Pre-pandemic trend estimated based on Q1 2013–Q4 2019 data.
Graph 7.A: GDP-PPP weighted averages for 11 AEs and 12 EMEs (not including CN). Ratio of the services and core goods CPI to base year 2019. Six-month moving averages. Pre-pandemic trend estimated based on 2015–19 data.
Graph 7.B: GDP-PPP weighted averages for 11 AEs and 13 EMEs (not including CN), where data are available; simple averages for the time periods. "00–09" for EMEs is July 2007–December 2009.
Graphs 8.A–C: The output gap is estimated as the deviation of real GDP from its Hodrick-Prescott filtered trend.
1 We thank Claudio Borio, Gaston Gelos, Carlos Madeira, Aaron Mehrotra, Benoît Mojon, Andreas Schrimpf and Hyun Song Shin for comments and to Emanuel Kohlscheen and Galo Nuño for extensive discussions. Adam Cap, Emese Kuruc and Jose Maria Vidal Pastor provided excellent research assistance. The views expressed in this article are those of the authors and do not necessarily reflect those of the Bank for International Settlements.
2 See Igan et al (2022) for more discussion. Nominal house prices have seen some correction as monetary policy tightened, but they started rising again more recently in several countries (eg Australia, Denmark, Norway, Sweden, Switzerland and the United States).
3 Consistent with this, in the United States, for instance, the housing-specific contribution to core trend inflation caught up with that from non-housing services only in mid-2022, even though house prices had already risen sharply in 2021. See Federal Reserve Bank of New York (2023).
4 The methodology used to treat owner-occupied housing in consumer price indices as well as the weights applied to shelter vary widely across countries. See, for instance, Eiglsperger et al (2022) for a recent summary.
5 For instance, in the United States, Ferrante et al (2023) attribute 3.5 percentage points of the 4.2 percentage point increase in inflation between end-2019 and end-2021 to the demand reallocation shock from services to goods. They find that a reversal of the shock raises inflation by around 1 percentage point.
6 The heterogeneous propagation of a common shock – particularly its slow spread to services price growth – is a key part of the mechanism generating persistent inflation. See Altissimo et al (2009).
7 World Bank, Sustainable Energy for All. Based on the statistics for upper and lower middle-income countries, manufacturing takes 4–5 megajoules per 2,011 purchasing power parity–adjusted US dollar while services takes only 0.4–0.5 megajoules. This is, to a certain extent, a mirror image of the labour intensity of services: a large share of labour costs in total costs implies a smaller share of energy and other intermediate input costs.
8 There are historical exceptions for some countries and time periods, for example, Babecký et al (2009) and Clark (2006).
9 See Angeloni et al (2006) for evidence and theoretical implications of persistence and price stickiness.
10 This is based on monthly wage data for new hires. The pattern holds for a larger set of countries, including EMEs, using quarterly wage data for all employees.
11 For a discussion of how wages catch up with prices to recover lost purchasing power, see Borio et al (2023).
12 See Cœuré (2019) for a detailed discussion. The effect of lower productivity growth is compounded by the lack of tradability: services are typically much less exposed to international competition, and therefore their price does not necessarily react to developments abroad. And even within a country, competition among providers of services in the domestic market tends to be less intense than that among providers of goods, reflecting the traditionally larger role of the government in some service sectors.
13 The choice of the adjustment window in this stylised exercise is informed by insights from the econometric analysis in Box A, where the trend convergence is around two years. The discussion in this box sheds further light on the mechanisms at work and confirms the thrust of the results.
14 That said, the impact of higher interest rates on the housing component of inflation can be ambiguous. For instance, in the United States, Liu and Pepper (2023) report a negative response of rents to monetary policy tightening. In contrast, Dias and Duarte (2019) find a positive response, unlike the negative response of house prices. Corsetti et al (2022), Koeniger et al (2022) and Lazarowicz and Richard (2023) also report the response of rents and house prices going in opposite directions in the euro area, Switzerland and the United Kingdom, respectively. This highlights supply-side constraints, institutional arrangements (eg contractual links between interest rates and rents) and the treatment of owner-occupied housing in the price index.