Quo vadis, r*? The natural rate of interest after the pandemic

Where is the natural rate of interest? How has it evolved? And where is it heading? In core advanced economies, several estimates of the natural rate have edged up. Shifts in the saving-investment balance and a more inflationary environment, which elicited a strong monetary policy response, may have been factors raising r* and perceptions thereof. The measurement of r* is, however, surrounded by very high uncertainty, making it a blurry guidepost for monetary policy. 1
JEL classification: E40, E43, E52, E58.
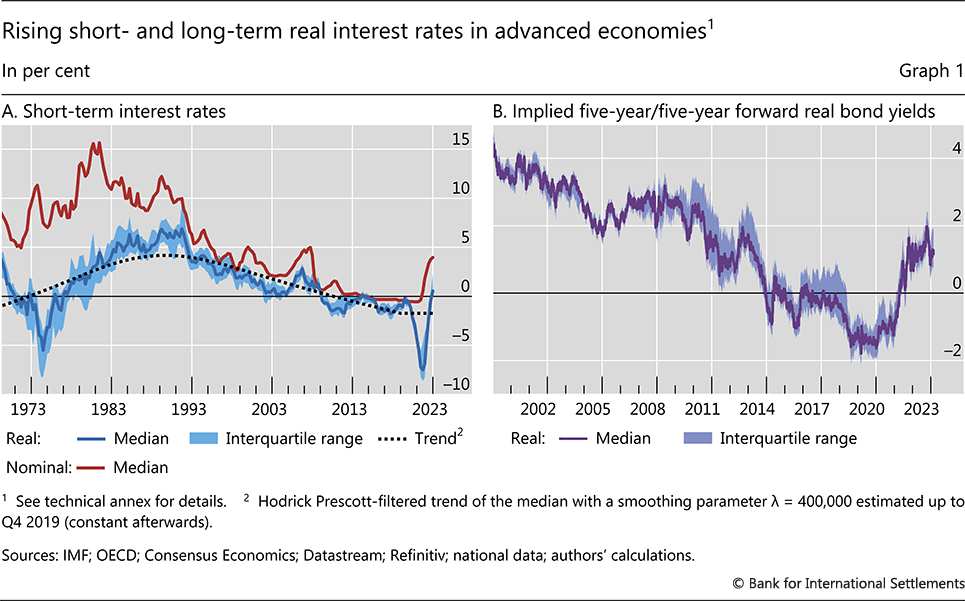
The sharpest and most synchronised monetary tightening in decades has lifted policy rates from their decade-long historical lows (Graph 1.A). Against this background, there is an increasingly lively debate on whether policy rates adjusted for inflation ("real rates") will converge back to their pre-pandemic lows or to a higher level.
Views differ widely. Some contributions posit that real rates will most likely return to low levels as unchanged powerful structural forces, including low potential growth, continue to hold them down (eg IMF (2023); Obstfeld (2023)). On the other hand, higher long-term real bond yields, reflecting in part higher distant forward real rates, suggest that at least investors expect higher real interest rates in the future (Graph 1.B). Likewise, the surprising resilience of economic activity to tighter monetary policy in the current cycle could be seen as an indication that the level of real policy rates that dampens demand is higher than previously thought.
This special feature contributes to this debate by assessing the natural rate of interest, commonly known as r*, in the post-pandemic era. The natural rate refers to the short-term real interest rate that would prevail in the absence of business cycle shocks, with output at potential, saving equating investment and stable inflation. Hence, the natural rate serves as a yardstick for where real policy interest rates are headed. It is also a benchmark for assessing the monetary policy stance "looking through" business cycle fluctuations. It can be conceived of as representing the intercept in a monetary policy rule, as in a "Taylor rule" (Taylor (1993)). Together with the long-run inflation rate, defined by the central bank inflation target, it pins down the long-run level of the nominal policy rate.
Key takeaways
- Several estimates of the natural rate of interest (r*) suggest that it may have increased relative to pre-pandemic levels.
- Potential shifts in the saving-investment balance and a more inflationary environment, which elicited a strong monetary policy response, may have raised r* and perceptions thereof.
- Assessments of the level and direction of r* are surrounded by very high uncertainty, making it a blurry guidepost for monetary policy, especially in the current context.
We assess the post-pandemic natural rate from different perspectives. A review of various established measures of r* in core advanced economies suggests that it may indeed have increased. That said, there is considerable dispersion across estimates and high statistical uncertainty around individual estimates. The recent behaviour of the structural drivers of r* does not paint a clear-cut picture either. Low expected potential growth and rising longevity may continue to weigh on r*. Several other factors may exert upward pressure though, including persistently large fiscal deficits due to rising age-related spending as well as higher public investment needs for infrastructure, defence and the green transition. Moreover, and less often appreciated, monetary policy itself could have a non-negligible effect on natural rates and perceptions thereof, through debt accumulation and beliefs about r*. As such, the recent reemergence of upside inflation risks inducing a tighter monetary policy stance going forward may have pushed at least perceptions of r* higher.
The article proceeds as follows. The first section discusses the concept of the natural rate. In Section 2, we assess and compare different estimates of r* for the United States and the euro area. Section 3 looks at the long-run determinants of saving and investment as drivers of the natural rate, while Section 4 discusses the role of monetary policy. We end with a discussion of policy implications.
The natural rate: conceptual considerations
The concept of the natural rate of interest traces back at least to Wicksell (1898), who described it as the rate of interest that would equate saving and investment and be consistent with stable prices. In this vein, the natural rate is generally defined as the level of the short-term real interest rate that would prevail in the absence of business cycle fluctuations, with output at potential, saving equating investment and stable inflation (Borio (2021)).2
The natural rate is commonly thought to be determined by real forces that structurally affect the balance between actual and potential output, or equivalently between saving and investment. Specifically, factors that increase saving or decrease investment lower the natural rate. These include potential growth, demographic trends, inequality, shifts in savers' and investors' risk aversion and fiscal policy. Lower potential growth lowers investment by reducing the marginal return on capital and increases saving by lowering expected income. Longer life expectancy raises saving as households need to support a longer retirement. A lower dependency ratio – reflecting a higher share of working age people in the population – increases saving as those in the workforce typically save more than the young and the elderly. Higher inequality raises saving as richer households save a larger share of their income. Higher risk aversion induces higher saving, in particular in safe assets, and at the same time lowers investment. Finally, persistent fiscal deficits reduce aggregate saving.
In a globalised world economy, with free capital flows, the same considerations apply but at the global level. At the country level, saving-investment differences can be accommodated through current account deficits or surpluses. However, natural rates would still need to adjust to equate actual and potential output and saving and investment at the world level.
The natural rate is generally assumed to be independent of monetary policy. This reflects the principle that monetary policy is neutral in the long run and can affect real variables only in a transitory fashion. Instead, the natural rate should be seen as a guidepost for monetary policy as it encapsulates where real policy rates would be headed once the effects of business cycle shocks have petered out. The central bank sets the nominal short-term riskless rate directly and, given that prices are relatively "sticky", also the corresponding real rate at any and hence all points in time. This establishes a direct link to policy: to the extent that the natural rate defines good macroeconomic outcomes, if the central bank does its job, over time it will take the short-term rate towards r*.
Natural rate estimates
The natural rate is an analytical concept. Since it is by nature unobservable, it can only be inferred through estimation, making any measurement of it a model-dependent exercise. Furthermore, operationalising the concept requires taking a stand on what the analytical long run without shocks corresponds to in calendar time. It is often assumed to refer to a horizon of five to 10 years.
In this vein, we consider a number of established estimates of r*, focusing on the United States and the euro area for reasons of data availability.3 The estimates considered are the following (see Box A for more details):
(i) a semi-structural model-based measure from Holston et al (2023) (HLW)
(ii) a time series model-based measure from Lubik and Matthes (2015) (LM)
(iii) a dynamic stochastic general equilibrium (DSGE) model-based measure from Del Negro et al (2017) (only for the US)
(iv) a term structure model-based measure from Hördahl and Tristani (2014)
(v) a survey-based measure from central-bank surveys of market participants
While these estimates are often referred to as gauges of the natural rate, they may still reflect cyclical factors to some extent. Therefore, the focus should be on the trend movements of the measures, not on their short-term blips. Moreover, by their very nature, they mix to varying degrees signals about r* and perceptions of it, making it very hard to disentangle the two.
A number of key observations emerge from the estimates (Graph 2). First, different approaches yield at times very different estimates of r*. The difference between the highest and lowest estimates is over 2 percentage points in several instances. Second, we observe a downward trend in natural rate estimates over the pre-pandemic decades, with estimates falling by several percentage points. Third, this downward trend shows signs of reversing post-pandemic: most measures display a significant increase over the past few years, in some cases to levels similar to those before the Great Financial Crisis (GFC). The HLW measure is the notable exception, falling back to pre-pandemic lows recently after an initial increase.
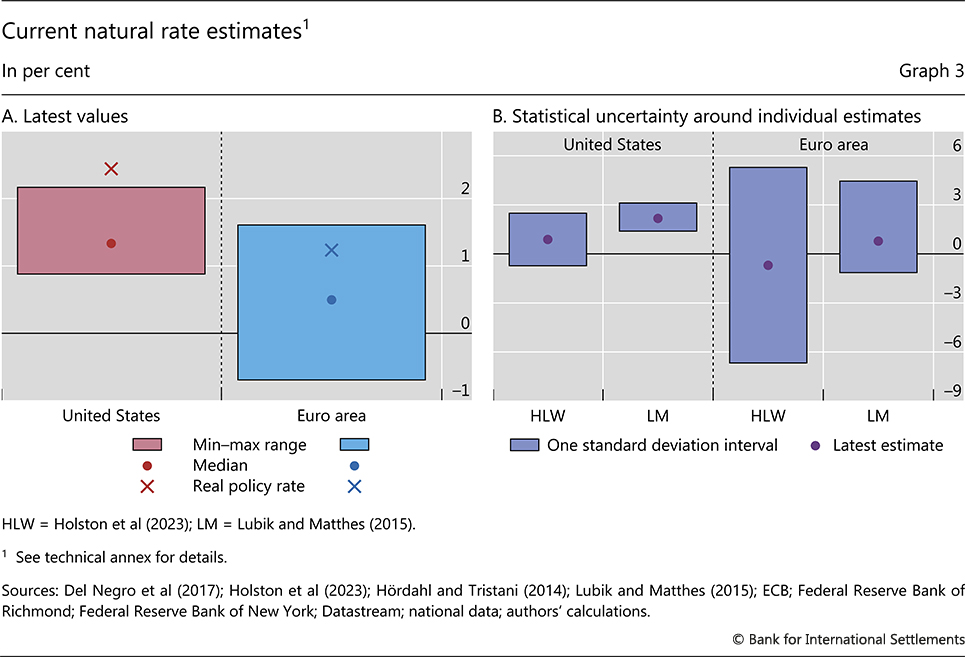
The uncertainty around r* estimates at the current juncture is very high. The latest difference between the highest and lowest estimates is about 1-2 percentage points (Graph 3.A). At the same time, there is also a high degree of uncertainty around the individual estimates. This is evident from the often large statistical confidence bands surrounding, for instance, the latest HLW and LM measures (Graph 3.B).
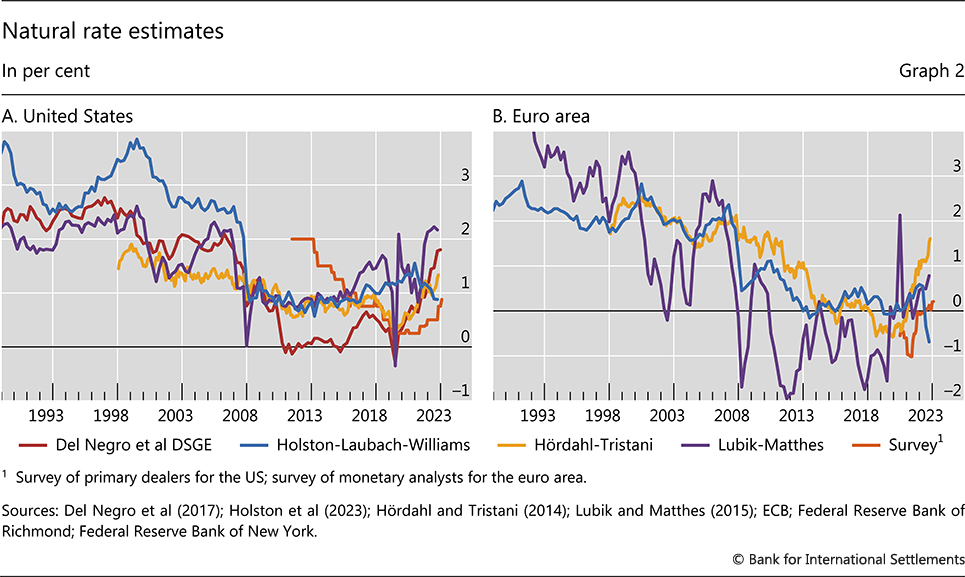
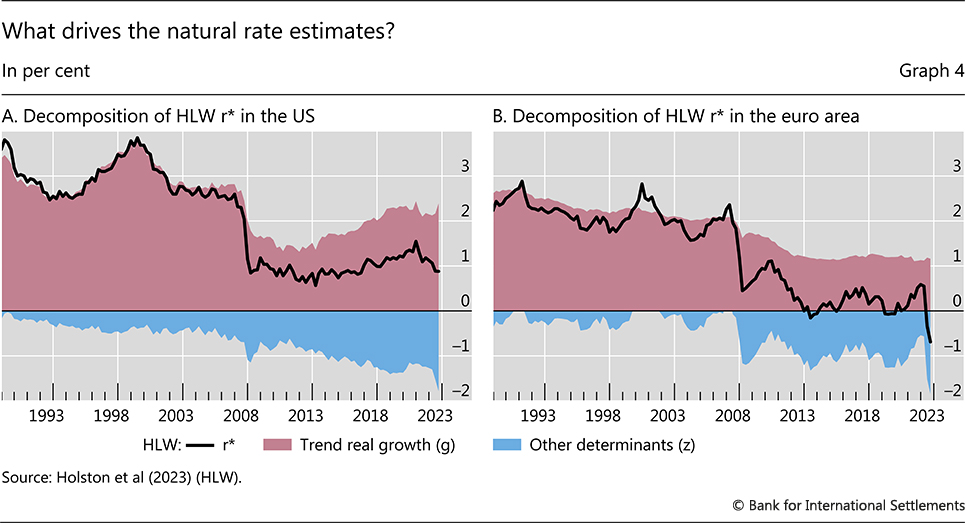
Looking behind the estimates sheds some light on the reasons for the differences across approaches. For instance, the semi-structural HLW r* estimate is geared to an estimate of trend output growth. Estimated potential growth is therefore the key driver, although other factors not explicitly modelled have played an increasing role in the decline of the measure since the GFC, and also most recently (Graph 4). In the fully structural model of Del Negro et al (2017), shifts in risk aversion are a key driver of r*. The recent increase in this estimate reflects a pickup in risk appetite associated with lower risk spreads in financial markets (Baker et al (2023)). The time series estimates of LM are in part driven by current and past dynamics of growth, inflation and real interest rates. The same applies to the term structure model-based estimate as it depends in part on long-horizon forecasts of the policy rate and inflation. Current macroeconomic developments may obviously also affect the survey-based estimates.
Natural rate drivers
A complementary approach to assess the recent direction of the natural rate is to examine more broadly the evolution of the long-run drivers of saving and investment.
The secular decline in real interest rates in the four decades before the pandemic was linked to long-run forces that lifted saving and depressed investment. Among these, lower potential growth rates and population ageing pushing saving up and investment down were particularly important drivers according to a number of recent studies (Gagnon et al (2021); Cesa-Bianchi et al (2023); IMF (2023)). Another key factor was arguably high saving rates in rapidly growing emerging market economies (EMEs), the so called global "saving glut" (Bernanke (2005)). Greater demand for safe assets in the wake of greater risk aversion after the GFC was identified as yet another important factor putting downward pressure on r* in major advanced economies (Caballero et al (2017); Marx et al (2021); Del Negro et al (2017)). Finally, fiscal policy was probably a countervailing force, reducing aggregate saving and sustaining aggregate demand and thereby limiting the decline in natural rates (Rachel and Summers (2019)).
| Further reading |
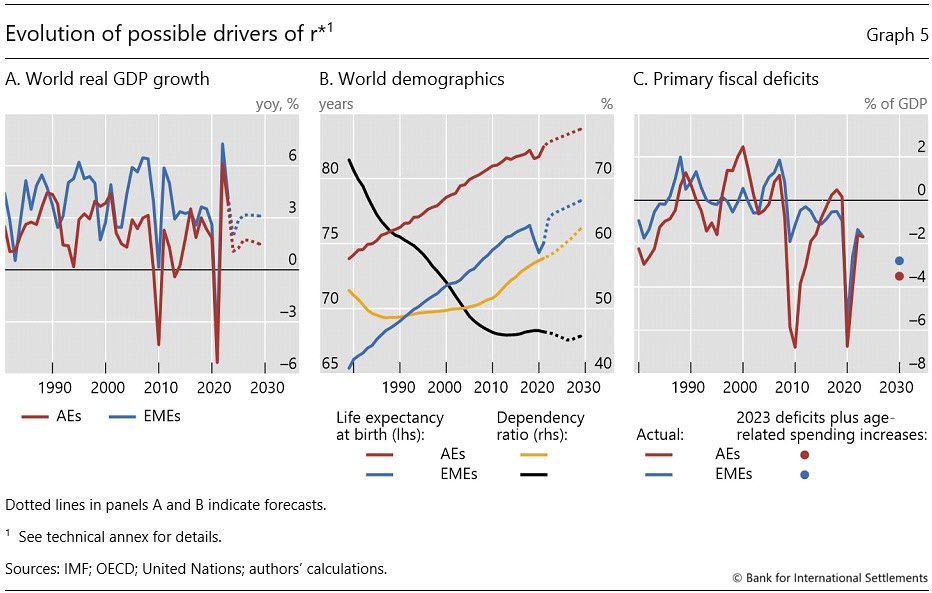
What are the implications of the recent evolution of key drivers? The picture is unclear. Some developments point to r* remaining at low pre-pandemic levels. Trend real growth has remained anaemic globally for two decades and does not show signs of acceleration (Graph 5.A). There is speculation that the widespread adoption of artificial intelligence may boost productivity growth, but it is too early to assess how realistic these hopes are. At the same time, after a brief dip during the Covid pandemic, life expectancy keeps increasing in both advanced and emerging market economies (Graph 5.B).
However, other developments point to a potential increase in natural rates. Dependency ratios are rising in advanced economies as the baby boomer generation enters retirement and are flattening out in EMEs (Graph 5.B). Fiscal deficits have ballooned in the wake of the pandemic and, absent fiscal consolidation, are poised to increase further on the back of higher age-related spending (Graph 5.C). Additional public spending needs will probably arise from the need to support the green transition and higher defence spending given geopolitical tensions.4 The adoption of new technologies, green or digital, may also boost private investment. Furthermore, growing geopolitical fragmentation could roll back financial globalisation, thus mitigating the global saving glut effect on natural rates in core advanced economies.
In sum, a qualitative assessment of the evolution of saving-investment drivers suggests that few are pointing towards continued low r* and a number towards higher r*. On balance, a higher post-pandemic r* can therefore not be ruled out, but uncertainty again looms large.
An additional source of uncertainty of the assessment concerns the significance and stability of the linkages between r* and its potential drivers. Empirically, the relationships between real interest rates and the key saving-investment forces discussed so far are often not statistically significant and unstable over time (Hamilton et al (2016); Lunsford and West (2019); Borio et al (2022)). This cautions against drawing firm conclusions about the evolution of r* from developments in saving and investment drivers.
Monetary policy and the natural rate
The assessment of r* is further complicated by the possibility that the natural rate, or at least perceptions of it, are influenced by monetary policy. To be sure, much standard macroeconomic theory rules this out based on models in which money is "neutral", ie it cannot have an impact on real variables in steady state. That said, regardless of the model specifics, it is possible that monetary policy has at least very long-lasting effects on real variables. These would be quite similar to, or hardly distinguishable from, changes in r*.
Some recent studies point to the possibility that expansionary monetary policy may raise r*. Long-lasting positive effects on aggregate demand, so-called "hysteresis effects", could boost innovation and growth (eg Benigno and Fornaro (2018); Jordà et al (2020)). Furthermore, a supportive monetary policy stance could yield improvements in resource allocation across firms, boosting productivity (Baqaee et al (2021); Gonzalez et al (2023)). That said, given prolonged monetary accommodation in the wake of the GFC, these channels do not seem to have materially affected the downward trend in r* according to essentially all estimates over this period, as documented above.
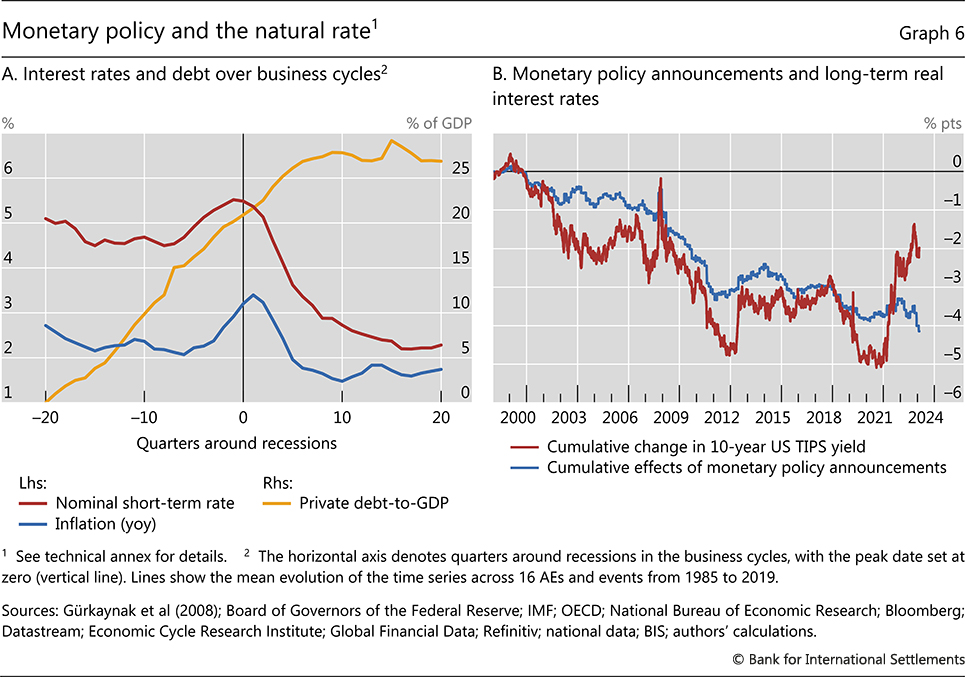
By contrast, through the interaction with the financial cycle, prolonged expansionary monetary policy could lower r* over long horizons. This is because monetary policy has a major impact on debt and asset price dynamics.5 Prolonged monetary easing could therefore fuel debt accumulation and financial imbalances. This could push down r* because high debt burdens can weigh heavily on demand (Mian et al (2021)). At the same time, financial imbalances often usher in financial crises, which have very persistent, if not permanent, effects on economic activity (Borio and Disyatat (2014); Kashyap and Stein (2023)). The risk of such developments playing out is higher when inflation remains subdued and fails to signal unsustainable expansions, eg owing to structural forces that keep it down, such as globalisation. From this perspective, low pre-pandemic interest rates may have been – at least in part – the result of progressive monetary policy easing over sequential business cycles pushing real interest rates down and indebtedness up in a context of low inflation (Graph 6.A).6
A role for monetary policy in affecting r* could also be suggested by the apparent long-lasting influence of monetary policy on long-term real interest rates. The overall decline in US long-term real yields since the late 1990s appears to have been driven to a large extent by yield changes around monetary policy announcements (Graph 6.B). This indicates that financial market participants take a cue from policy decisions when assessing where real rates will go over long horizons – implicitly, r* – and that, over time, those changes do not vanish.
This finding can be interpreted in different ways. On the one hand, it may reflect fundamental news from the central bank guiding markets to the true r* (Hillenbrand (2023)). On the other hand, it could reflect information feedback loops with financial markets. They can occur whenever r* is hard to measure and both central banks and market participants need to learn about it from each other. Such loops can induce shifts in perceived r* despite no independent shifts in saving and investment (Rungcharoenkitkul and Winkler (2021)).7 Shifts in perceived r*, in turn, could affect r* to the extent that they influence spending decisions. That said, monetary policy announcements do not seem to have played an important role in the surge in real yields over the past few years (Graph 6.B).
These considerations have two main implications. First, the possibility that r* may be influenced by monetary policy further complicates the operationalisation of the concept. Second, r*, or at least perceptions thereof embedded in market prices, may have risen relative to pre-pandemic years because of expectations of a prospectively tighter monetary policy in a structurally more inflationary environment. For instance, adverse supply side developments in the global economy (Carstens (2022)) could reduce monetary policy's leeway to remain as accommodative during economic expansions as in the past, reducing the risk of the build-up of financial imbalances and their downward pressure on r* over long horizons.
Conclusion
The analysis in this special feature suggests that r*, or at least perceptions of it, may have risen post-pandemic, but that its assessment is surrounded by a very high degree of uncertainty. These findings caution against over-reliance on r* as a guide for monetary policy.
The uncertainty surrounding r* suggests that it is a blurry guidepost for assessing the monetary policy stance and hence the tightness of monetary policy, in particular at the current juncture. In this context, it appears advisable to guide policy decisions based more firmly on observed inflation rather than on highly uncertain estimates of the natural rate.
Uncertainty about r* also underscores the need for robust monetary policy frameworks. They need to be fit for purpose regardless of the broad economic environment and associated estimates of r*. The expectation of the persistence of a very low r*, and hence of a high incidence of the effective lower bound, was a key consideration behind the review of monetary policy frameworks pre-Covid. The last couple of years have highlighted how quickly the environment, and associated views of r*, can change.
References
Baker, K, L Casey, M Del Negro, A Gleich and R Nallamotu (2023): "The evolution of short-run r* after the pandemic", Liberty Street Economics, 10 August.
Banerjee, R N, and B Hofmann (2018): "The rise of zombie firms: causes and consequences", BIS Quarterly Review, September, pp 67–78.
Bank for International Settlements (BIS) (2023): "Monetary and fiscal policy: safeguarding stability and trust", Annual Economic Report 2023, Chapter II.
Baqaee, D, E Farhi and K Sangani (2021): "The supply-side effects of monetary policy", NBER Working Paper, no 28345.
Benigno, G, L Fornaro (2018): "Stagnation traps", The Review of Economic Studies, vol 85, pp 1425–70.
Bernanke, B (2005): "The global saving glut and the U.S. current account deficit", Sandridge Lecture, Virginia Association of Economists, Richmond, Virginia, 10 March.
Borio, C (2021): "Navigating by r*: safe or hazardous?", BIS Working Papers, no 982.
Borio, C and P Disyatat (2014): "Low interest rates and secular stagnation: is debt a missing link?", VoxEU, 25 June.
Borio, C, P Disyatat and P Rungcharoenkitkul (2019): "What anchors for the natural interest rate of interest?", BIS Working Papers, no 777.
Borio, C, P Disyatat, M Juselius and P Rungcharoenkitkul (2022): "Why so low for so long? A long-term view of real interest rates", International Journal of Central Banking, vol 18, no 3, pp 47–87.
Brand, C, N Lisack and F Mazelis (2024): "Estimates of the natural interest rate for the euro area: an update", ECB Economic Bulletin, no 1/2024.
Caballero, R, E Farhi and P-O Gourinchas (2017): "The safe assets shortage conundrum", Journal of Economic Perspectives, vol 31, pp 29–46.
Carstens, A (2022): "A story of tailwinds and headwinds: aggregate supply and macroeconomic stabilisation", speech at the Federal Reserve Bank of Kansas City Jackson Hole symposium, 26 August.
Cesa-Bianchi, A, R Harrison and R Sajedi (2023): "Global R*", Bank of England Staff Working Paper, no 990.
Del Negro, M, D Giannone, M Giannoni and A Tambalotti (2017): "Safety, liquidity, and the natural rate of interest", Brookings Papers on Economic Activity, vol 48, Spring, pp 235–316.
Gagnon, E, B K Johannsen and D López-Salido (2021): "Understanding the new normal: the role of demographics", IMF Economic Review, vol 69, pp 357–90.
González, B, G Nuño, D Thaler and S Albrizio (2023): "Firm heterogeneity, capital misallocation and optimal monetary policy", BIS Working Papers, no 1148.
Gürkaynak, R, B Sack and J Wright (2008): "The TIPS yield curve and inflation compensation", Finance and Economics Discussion Series, May.
Hamilton, J, E Harris, J Hatzius and K West (2016): "The equilibrium real funds rate: past, present, and future", IMF Economic Review, vol 64, no 4, pp 660–707.
Hillenbrand, S (2023): "The Fed and the secular decline in interest rates", mimeo.
Hofmann, B and G Peersman (2017): "Monetary policy transmission and trade-offs in the United States: old and new", BIS Working Papers, no 649.
Holston, K, T Laubach and J Williams (2017): "Measuring the natural rate of interest: international trends and determinants", Journal of International Economics, vol 108, no 1, pp S59–S75.
Holston, K, T Laubach and J Williams (2023): "Measuring the natural rate of interest after COVID-19", Federal Reserve Bank of New York Staff Reports, no 1063.
Hördahl, P and O Tristani (2014): "Inflation risk premia in the euro area and the United States", International Journal of Central Banking, vol 10, no 3, pp 1–47.
International Monetary Fund (IMF) (2023): "The natural rate of interest: drivers and implications for policy", World Economic Outlook, April, Chapter 2.
Jordà, Ò, S Singh and A Taylor (2020): "The long-run effects of monetary policy", NBER Working Papers, no 26666.
Kashyap, A and J Stein (2023): "Monetary policy when the central bank shapes financial-market sentiment", Journal of Economic Perspectives, vol 37, no1, pp 53–76.
Laubach, T and J Williams (2003): "Measuring the natural rate of interest", Review of Economics and Statistics, vol 85, no 4, pp 1063–70.
----- (2016): "Measuring the natural rate of interest redux", Business Economics, vol 51, pp 257–67.
Lubik, T and C Matthes (2015): "Calculating the natural rate of interest: a comparison of two alternative approaches", Federal Reserve Bank of Richmond, Economic Brief, no 15-10.
----- (2023): "The stars our destination: An update on our r* measure", Federal Reserve Bank of Richmond, Economic Brief, no 23–32, September.
Lunsford, K and K West (2019): "Some evidence on secular drivers of US safe real rates", American Economic Journal: Macroeconomics, vol 11, no 4, pp 113–39.
Marx, M, B Mojon and F R Velde (2021): "Why have interest rates fallen far below the return on capital?", Journal of Monetary Economics, 124S: S57-S76.
Mian, A, L Straub and A Sufi (2021): "Indebted demand", Quarterly Journal of Economics, vol 136, no 4, pp 2243–307.
Obstfeld, M (2023): "Natural and neutral real interest rates: past and future", NBER Working Papers, no 31949.
Rachel, L and L Summers (2019): "On secular stagnation in the industrialized world", Brookings Papers on Economic Activity, vol 50, Spring, pp 1–54.
Rungcharoenkitkul, P, and F Winkler (2021): "The natural rate of interest through a hall of mirrors", BIS Working Papers, no 974.
Taylor, J (1993): "Discretion versus policy rules in practice", Carnegie-Rochester Conference Series on Public Policy, vol 39, pp 195–214.
Wicksell, K (1898): Geldzins und Güterpreise. Eine Untersuchung über die den Tauschwert des Geldes bestimmenden Ursachen, Jena, Gustav Fischer (English translation: Interest and prices: a study of the causes regulating the value of money, Macmillan, 1936.
Woodford, M (2003): Interest and prices: foundations of a theory of monetary policy, Princeton University Press.
Technical annex
Graph 1: The sample covers AT, AU, BE, CA, CH, DE, DK, ES, FI, FR, GB, IE, IT, JP, NL, NO, NZ, PT, SE and US. Statistics are computed using a smaller set of countries when data are not available.
Graph 1.A: Three-month interbank rates. Real rates are computed as nominal rates minus year-on-year inflation.
Graph 1.B: Based on nominal rates minus long-term Consensus forecasts.
Graph 3.A: Statistics are computed based on estimates for Q3 2023 (HLW, LM), October 2023 (Hördahl and Tristani (2014)), Q4 2023 (Del Negro et al (2017)) and Jan 2024 (survey of primary dealers) for the US. For the euro area, based on estimates for Q3 2023 (HLW and LM), October 2023 (Hördahl and Tristani (2014)) and Jan 2024 (survey of monetary analysts). Real policy rate is computed as federal funds rate minus year-on-year change in the price index of personal consumption expenditures less food and energy for the US. For the euro area, ECB main refinancing operations interest rate minus year-on-year change in the harmonised index of consumer prices excluding energy, food, alcohol and tobacco. Latest real policy rate for December 2023 for US; January 2024 for the euro area.
Graph 3.B: For HLW, the lower (upper) bound is calculated as the latest natural rate r* estimate minus (plus) one standard deviation. Latest estimate for Q3 2023.
Graph 5: The sample covers AT, BE, DE, ES, FI, FR, GB, IE, IT, JP, NL, PT and US (AEs); AR, BR, CL, CN, CO, CZ, HU, ID, IL, IN, KR, MX, PL and ZA (EMEs). Simple averages across economies.
Graph 5.C: Projections assume an interest rate-growth differential equal to –1%; constant primary deficits as a percentage of GDP as of 2023 (October 2023 IMF World Economic Outlook estimate) and an increase in age-related spending based on IMF projections for pension and healthcare spending for 2030. Historical deficit is computed using a smaller set of countries when data are not available.
Graph 6.A: Business cycle dates are from National Bureau of Economic Research for US; Economic Cycle Research Institute for AU, CA, CH, DE, ES, FR, GB, IT, JP and SE. For BE, FI, IE, NL and NO, business cycles are dated with a business cycle-dating algorithm. Episodes for which data for the previous and next 20 quarters are available are used in computing the statistics.
Graph 6.B: Cumulative effects of monetary policy announcements are computed as the cumulative changes in the 10-year US TIPS yield only over three-day window around Federal Open Market Committee meetings (the day prior to the meeting, the day of the meeting and the day after the meeting) where changes outside this window are set to zero.
1 The views expressed are not necessarily those of the BIS. We thank Claudio Borio, Sebastian Doerr, Jon Frost, Gaston Gelos, Peter Hördahl, Enisse Kharroubi, Marco Lombardi, Cristina Manea, Benoît Mojon, Dan Rees, Phurichai Rungcharoenkitkul, Hyun Song Shin, Andreas Schrimpf and Fabrizio Zampolli for helpful comments and Burcu Erik and Nicolas Lemercier for excellent research assistance. We are also grateful to Claus Brand, Ambrogio Cesa-Bianchi, Marco Del Negro, Richard Harrison, Peter Hördahl, Zehao Li, Noemie Lisack, Thomas Lubik, Christian Matthes, Elmar Mertens, Stefano Neri, Rana Sajedi, and Steve Wu for sharing data and for helpful discussions. All remaining errors are ours.
2 The natural rate definition followed in this special feature should not be confused with alternative concepts of equilibrium interest rates that depend on business cycle fluctuations. For example, in Woodford (2003) the natural rate corresponds to the short-term real rate in a counterfactual economy without nominal rigidities but subject to business cycle fluctuations. See also the discussion in Obstfeld (2023), who distinguishes between the natural rate and the neutral rate, the latter being the interest rate consistent with no inflationary or disinflationary pressure.
3 Since real interest rates and estimates of r* tend to be closely correlated across countries (Del Negro et al (2019); Cesa-Bianchi et al (2023)), the developments in the two major global economies should be broadly representative. See Brand et al (2024) for a comparison of a broader range of r* measures for the euro area.
4 However, if growing public debt on the back of rising deficits would at some point raise risks to fiscal sustainability, the result could be downward pressure on natural rates due to the required fiscal adjustments or the aftermath of sovereign crises.
5 See eg Hofmann and Peersman (2017) for evidence for the United States.
6 See Borio et al (2019), Borio (2021) and BIS (2023) for more detailed discussions. A reinforcing effect could be the negative impact on potential output from the existence of persistently unprofitable firms ("zombie firms") supported by very low interest rates (Banerjee and Hofmann (2018)).
7 For example, when the central bank cuts the policy rate sharply, market participants may attribute part of the reduction to a lower r* in the reaction function. The central bank, in turn, may misinterpret lower market yields as indicating a lower r*, and hence cut the rate further. This "hall of mirrors" interaction can lead to persistent shifts in r* itself.