Markets count on a smooth landing
The central theme of the review period was the waxing and waning of financial markets' optimistic expectations over the policy outlook.1 Until late December, financial conditions continued to ease, driven by investors anticipating looser policy in the near term. Since January, financial conditions firmed and tightened, as central bank communication pushed back against such expectations and data releases pointed at more stubborn inflation pressures. Sovereign bond yields declined on balance during the period, while valuations of risky assets generally rose. Supported by resilient risk sentiment, emerging market economies (EMEs) experienced bond inflows, and (except China) their stock markets extended gains.
Expectations of policy rate trajectories set the tone for global fixed income markets. Against a benign backdrop of declining inflation and surprisingly resilient economic activity, market participants' expectations initially drifted away from central bankers' projections, so they started pricing in early rate cuts. But then central bank officials repeatedly intervened to dispel excessive optimism, reaffirming that the fight to bring inflation back to target could not be declared won yet. Their efforts to herd market expectations back in line with their projections succeeded and narrowed the daylight between markets' and central banks' expectations. These reassessments left an imprint in elevated bond volatility, which even surpassed that of equities. Government bond yields in major economies broadly reflected these developments: they first continued to decline in December, and then they edged up again after central bank communications pushed back in January and a less benign inflation release in the United States came out in February.
The overall optimistic mood also had a bearing on risky assets. Global stock indices rallied and credit spreads narrowed. While still relatively tight, global financial conditions eased, reflecting expectations of a soft landing. That said, bond issuance and bank credit supply terms painted a less rosy picture. Issuance remained rather subdued, as firms seemed less willing to tap the market at higher rates while banks' lending standards were still tight. The foreign exchange market sent mixed signals: the dollar initially depreciated but then appreciated markedly from January onwards, in response to signs of later-than-expected rate cuts. This pattern reflects exchange rate movements being associated mostly with revisions to the monetary policy outlook rather than being driven by risk sentiment.
EMEs broadly followed the developments in AEs. Bond yields fell, driven by the outlook for policy easing, and equity markets rose across the board. In China, however, equity markets plunged in response to persistent woes about the real estate sector, despite several support measures. EME bond funds saw sustained inflows in Asia and Latin America, in contrast to equity funds, which differed across jurisdictions. EME currencies depreciated across the board, with those in Latin America depreciating more than those in Asia, on the back of a larger compression in yield spreads vis-à-vis the United States.
Key takeaways
- Bond markets moved with the waxing and waning of expectations of early policy rate cuts as central bankers intervened to dispel excessive optimism.
- Risky assets rallied, with still tight financial conditions easing substantially from their late-October peak.
- EMEs broadly followed the developments in AEs as yields fell and equity markets rallied; in China, by contrast, the stock market slumped.
Global bond markets stay attuned to monetary policy
A "tug of war" between markets and central banks characterised developments over the review period. In early December, market pricing indicated greater investor conviction in earlier and deeper rate cuts, largely in response to macroeconomic data releases. Yet, from early January onwards, central bank communication increasingly pushed back to dispel excessive market optimism.
Government bond yields declined, on balance, even though they underwent substantial gyrations. In December, long-term government bond yields in major AEs continued their descent from the late-October peaks. In January, yields firmed and then increased, in part supported by central bank communication pushing back expectations of early rate cuts (Graph 1.A).2 Evolving expectations over the timing and extent of policy rate cuts also drove changes in the overall shape of the yield curve: term spreads fluctuated, but overall the curve remained negatively sloped in most AEs (Graph 1.B).
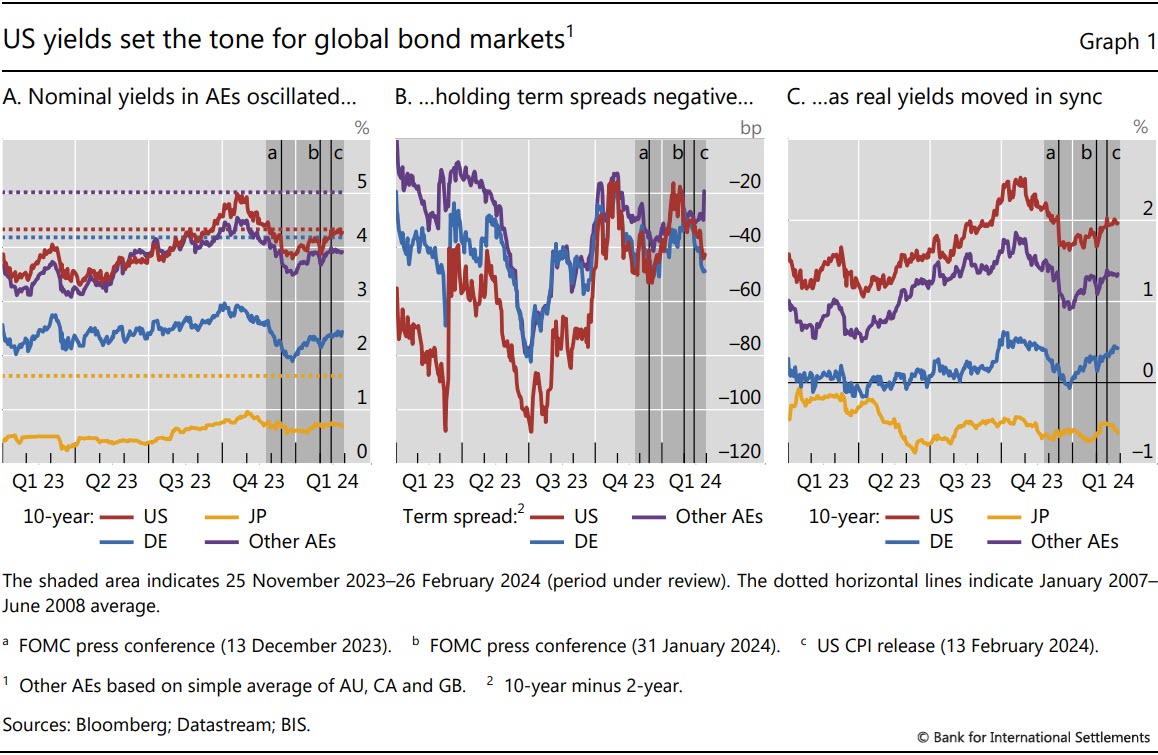
As long-term inflation expectations remained roughly stable, changes in inflation-adjusted (real) yields matched most of the movement in nominal yields (Graph 1.C). Japan was an exception: real yields remained mostly flat, and the bulk of the movement in nominal yields reflected changing long-run inflation expectations.
Central bank communication conveyed a sense of patience and caution, but financial market participants eyed a much easier stance ahead. Market participants revised their policy expectations repeatedly, navigating between macroeconomic releases and central bank communication. Eventually though their views converged towards central bankers' projections. Market-based measures of expected US policy rates for end-2024 declined substantially in December, moving well out of line with the Federal Open Market Committee (FOMC) members' projections (Graph 2.A, red line), but reverted by February. Similarly, while professional forecasters' prospects on US inflation were aligned with FOMC projections, they also reflected more dovish expectations on the policy rate trajectory (Graph 2.B). That said, the disagreement among different forecasters on the future course of monetary policy rose substantially, both in the United States and the euro area (Box A).
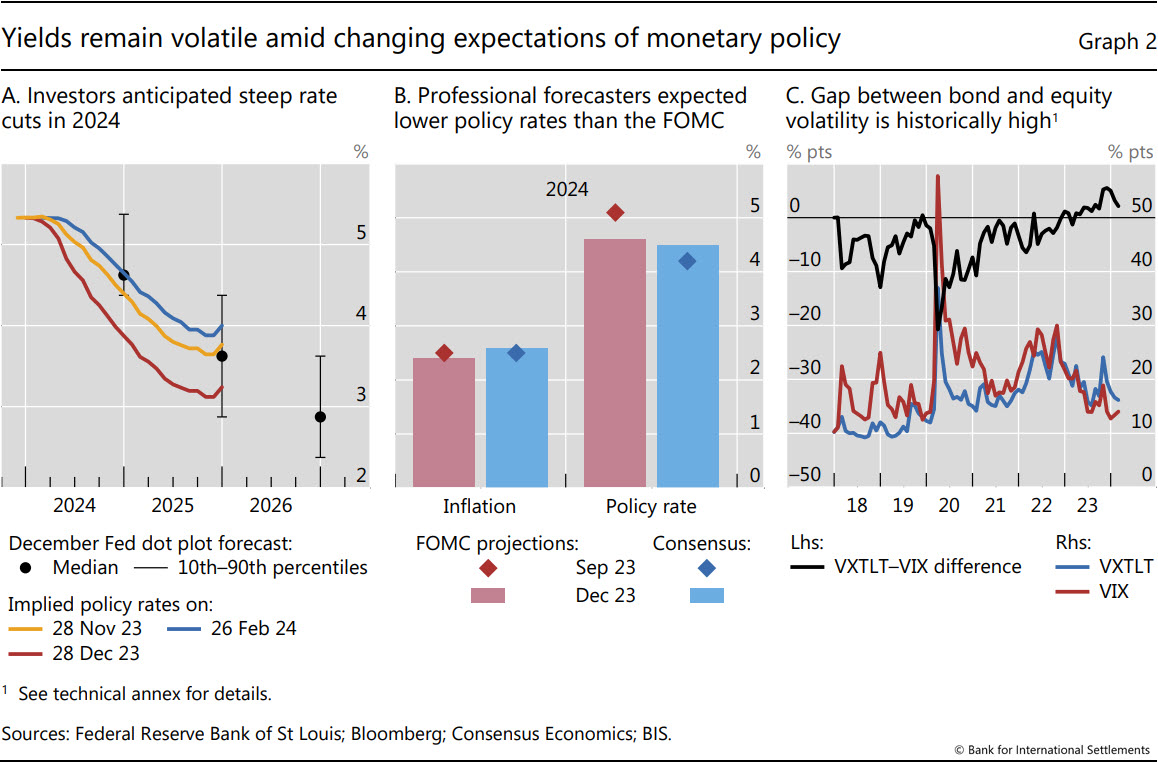
Reassessments of policy rate paths and the associated portfolio shifts kept bond yield volatility elevated. Gauges of government bond volatility declined somewhat from the peak in October last year, but they remained high and, more unusually, well above those for equities (Graph 2.C). Historically, such a pattern tends to occur around turning points in the policy cycle. For instance, the lift-off of policy rates at end-2015 also coincided with higher volatility in bonds than equities. That said, the recent gap has been larger and longer-lived. Part of the gap may reflect a stronger compression of equity volatility due to dealers selling volatility via yield-enhancing structured products (Box B).
Risky assets pull ahead amid a buoyant mood
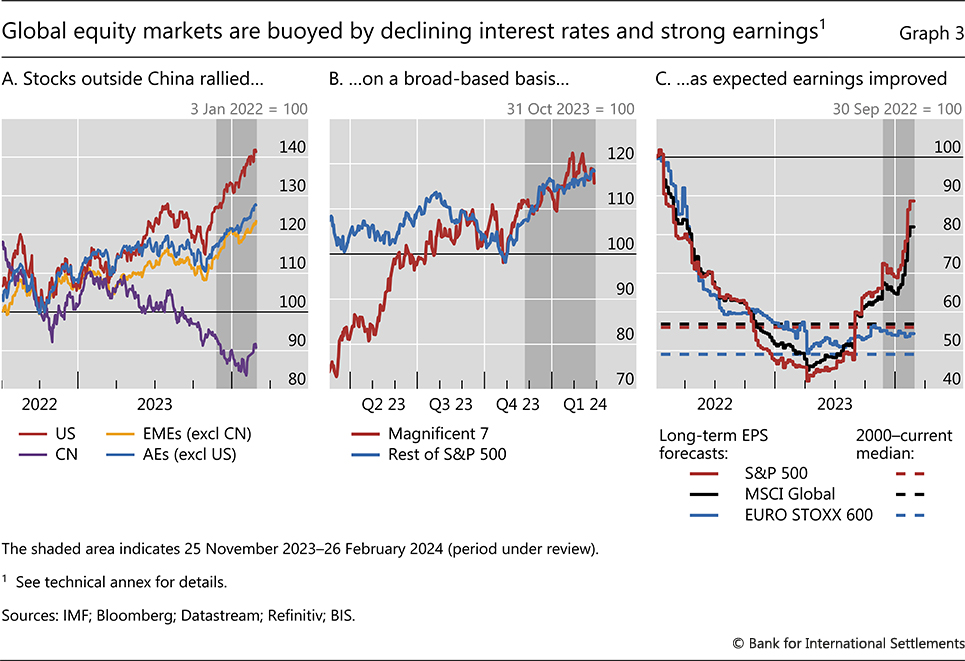
Equity markets posted substantial gains in the review period, as market participants anticipated rate cuts and earnings surprises on the upside supported risk sentiment. The rally was common to most AEs and EMEs, with the notable exception of China (Graph 3.A). This time around, it encompassed most stocks (Graph 3.B), rather than overwhelmingly the "magnificent 7" big tech companies, whose valuations nonetheless reached ever loftier levels. In addition to lower discount rates, positive earnings surprises buoyed prices (Graph 3.C). Japanese stocks, which underperformed in December, subsequently rallied, reaching all-time highs.
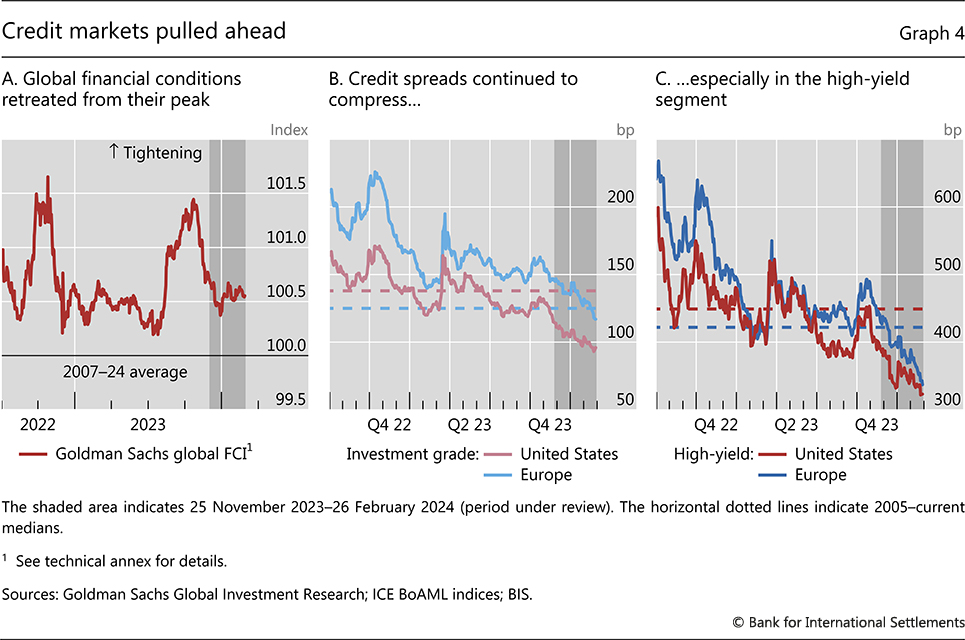
The dynamics of financial conditions reflected the waxing and waning of market participants' expectations of early rate cuts. While remaining, on balance, tight relative to historical averages, global financial conditions eased substantially from their late-October peak (Graph 4.A). Corporate bond yields fell considerably until the end of December and then recovered somewhat as participants continuously re-evaluated how central bank actions would evolve. Credit spreads, by contrast, mostly followed the declining trajectory embarked on in mid-2022. They declined both in the investment grade and high-yield segments of the market and are now substantially below historical norms in the United States and Europe (Graphs 4.B and 4.C).
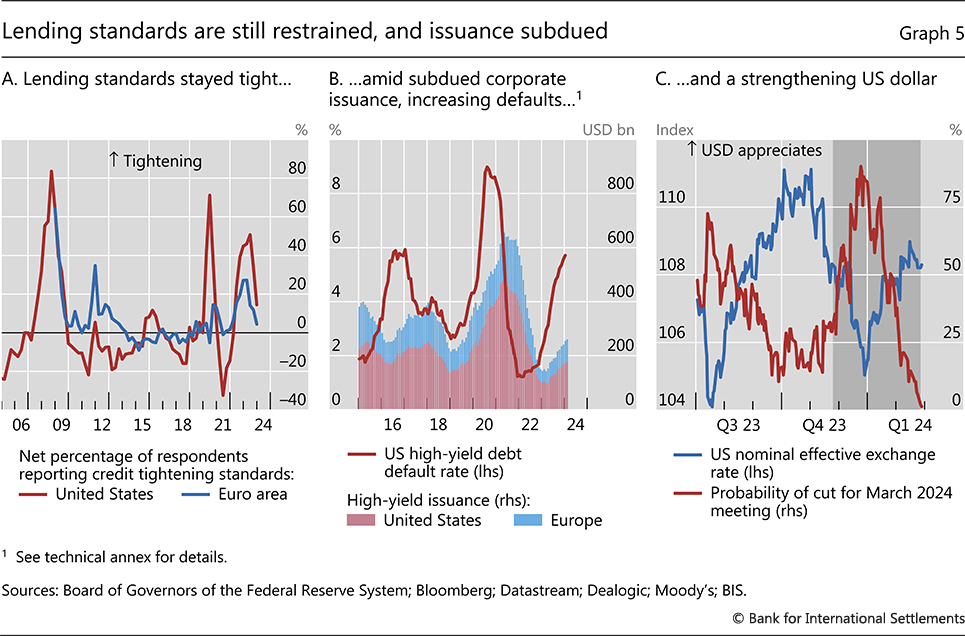
The buoyant pricing in equity and credit markets stood in contrast with banks' cautious approach to lending, subdued bond issuance and rising corporate defaults.3 Survey responses showed that – on net – banks were still tightening standards, albeit less than in the previous quarter (Graph 5.A). Furthermore, while bond issuance rose slightly, it remained substantially below pre-pandemic levels. This probably reflected firms' overall limited refinancing needs, given the bulge in issuance in 2020 and 2021. Another factor could be timing decisions, as firms waited for rates to decline further. That said, the continued increase in defaults suggests that at least some firms may have been experiencing funding difficulties (Graph 5.B).
Different factors drove changes in the foreign exchange market over the review period. Until late December, the US dollar depreciated while risk assets rallied, in line with the dollar functioning as a key barometer of risk-taking. However, from January onwards, the dollar appreciated markedly, even as equity and credit markets continued to rally. This pattern is at odds with typical risk-on phases of the period following the Great Financial Crisis (GFC), but it aligns with a more traditional channel of exchange rates reacting to interest rate differentials. Indeed, the behaviour of the dollar was closely linked with changing expectations of future policy rates. When markets' views on the prospects of early rate cuts waned and expectations realigned with central banks' projections, the dollar strengthened materially (Graph 5.C).
EMEs, with the exception of China, followed AEs
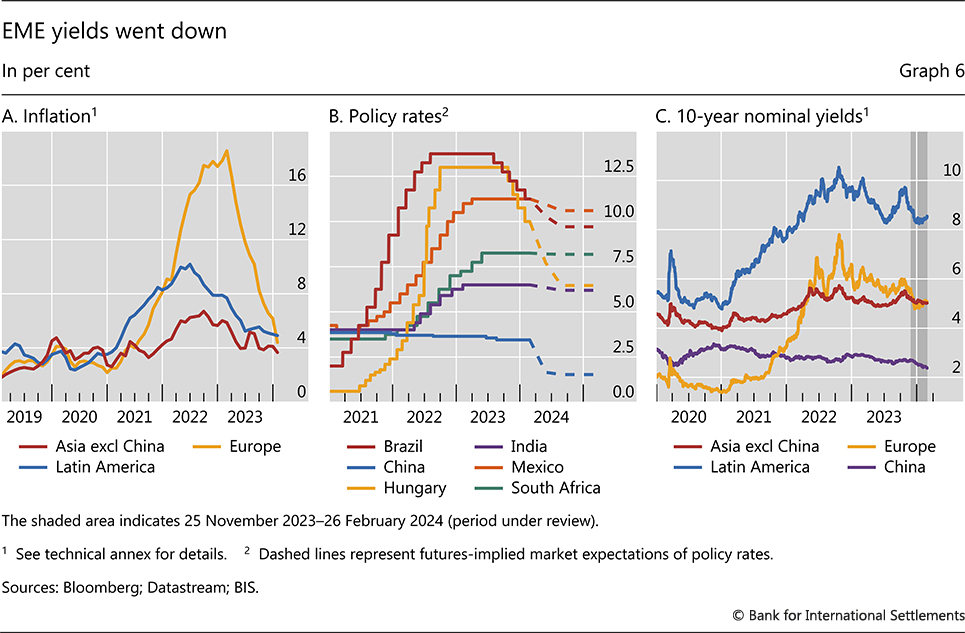
With the exception of China, developments in EME fixed income markets were broadly in line with those in AEs. Disinflation also remained well on track in EMEs (Graph 6.A), and most central banks were expected to either continue or begin cutting policy rates (Graph 6.B). As a result, nominal government bond yields fell in the early part of the review period. In contrast to AEs, however, and somewhat surprisingly given the appreciation of the dollar, they did not increase substantially afterwards (Graph 6.C).
In line with the general risk-on sentiment, equity markets in most EMEs rose, even though they broadly underperformed those in AEs. Latin American markets increased slightly more than Asian ones (Graph 7.A). Despite the recent rally, EME stock prices still entailed a heavy valuation discount, rendering their valuations more attractive on a forward-looking basis compared with those of AEs (Graph 7.B).
In contrast to those of most other EMEs, Chinese stocks continued to slump. And this took place despite signs that the Chinese economy was stabilising, as official data showed it had met the government's 5% growth target. Market participants shrugged off the support offered by the central bank and fiscal authorities in December. Instead, they seemingly focused on inflation indicators and the persistent problems in the real estate sector. Property sales and new home starts contracted, and property prices continued to decline. In addition, inflation gauges pointed to prices declining at their fastest pace since the GFC. Reflecting this negative sentiment, Chinese equities extended losses: at one point the CSI 300 Index was 45% below its previous peak. In parallel, the Hang Seng Index fell in January, even reaching July 1997 levels. The tide seemed to turn in February, when Chinese authorities unveiled a number of measures to ease financial conditions and stimulate credit.
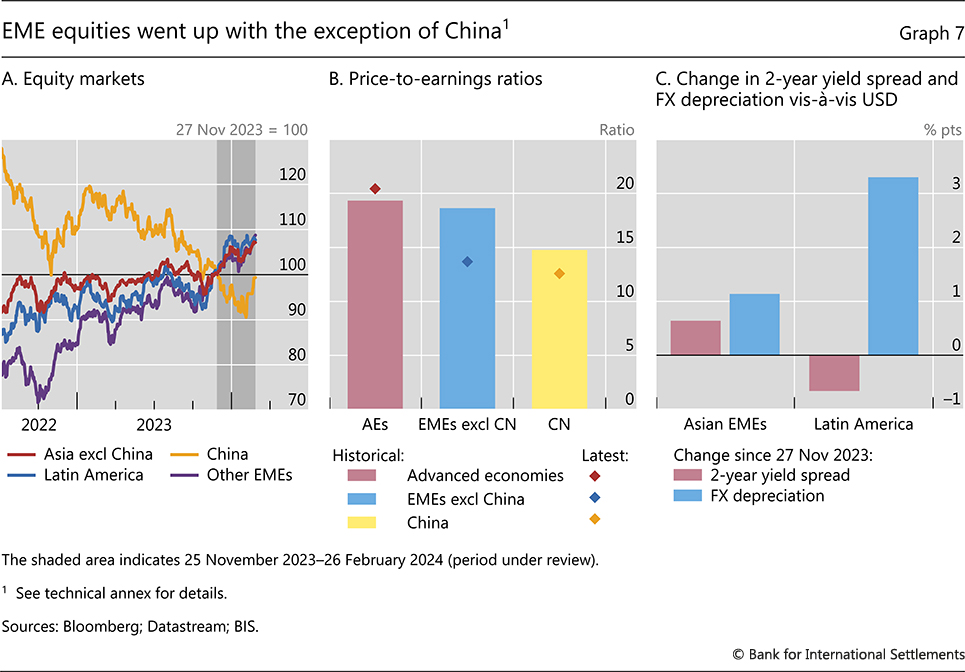
EME currencies depreciated mildly, with foreign exchange (FX) markets hinting at some localised pressure. Asian currencies depreciated less than Latin American ones on the back of improving interest rate differentials vis-à-vis the US dollar (Graph 7.C). While EME spot markets remained orderly, FX derivative segments for the Chinese renminbi showed signs of tension. Against the backdrop of sustained capital outflows, the cross-currency basis for the Chinese renminbi remained substantially large, indicating an elevated premium for Chinese borrowers to obtain dollar funding. This contrasted with the dynamics of the basis for major currencies, which continued to narrow despite the appreciation of the US dollar.
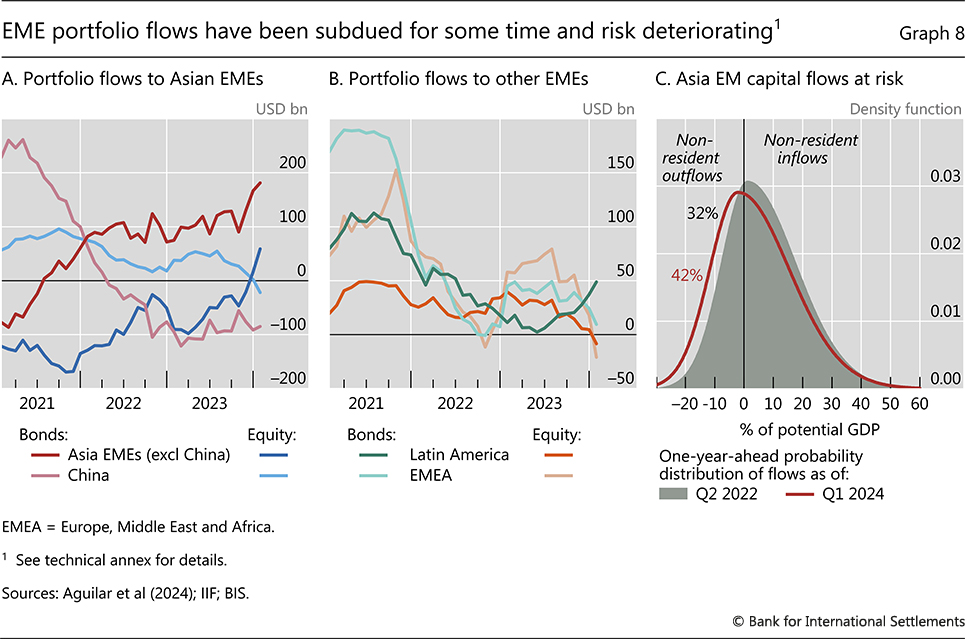
Prospects for yield differentials and equity valuations influenced capital flows to EMEs. Bond flows picked up in Latin America and Asia, given the mostly positive interest rate differentials with the United States (Graphs 8.A and 8.B). Equity flows diverged across jurisdictions: Latin American and EMEs in Europe, the Middle East and Africa saw pronounced outflows (Graph 8.B), whereas Asian EMEs experienced inflows (Graph 8.A). China was a notable exception, as equity funds saw sustained outflows.
There are indications that the risk of moderate-to-large EME capital outflows has increased, which could bring vulnerabilities to the fore. Specifically, compared with mid-2022, the estimated probability distribution of non-resident capital flows one year ahead shifted to the left, indicating a higher probability of outflows (Graph 8.C).
Technical annex
Graph 2.C: VIX = CBOE Volatility Index. The VIX Index is a financial benchmark designed to be an up-to-the-minute market estimate of the expected volatility of the S&P 500R Index. It is calculated by using the midpoint of real-time S&P 500 Index (SPX) option bid/ask quotes. VXTLT = CBOE 20+ Year Treasury Bond ETF Volatility Index.
Graph 3.A: US = S&P 500; CN = CSI 300 Index. Country group aggregates based on gross domestic product (GDP)-weighted averages.
Graph 3.B: Magnificent 7 = Apple, Alphabet, Amazon, Meta, Microsoft, Nvidia and Tesla.
Graph 3.C: EPS = earnings per share.
Graph 4.A: Goldman Sachs Financial Conditions Index (FCI): a weighted average of country-specific risk-free interest rates (both long and short term), exchange rates, equity valuations and credit spreads, with weights that correspond to the estimated impact of each variable on GDP. A value of 100 indicates average conditions. A higher (lower) value indicates tighter (looser) conditions.
Graph 5.B: US high-yield default rate based on Moody's 12-month rolling US speculative grade default rates. High-yield issuance based on a 12-month rolling sum.
Graph 6.A: Purchasing power parity (PPP)-weighted averages. Asia excl China = IN, ID, KR, MY, PH, SG and TH. Latin America = BR, CL, CO, MX and PE. Europe = BG, CZ, HU, PL and RO.
Graph 6.C: Asia excl China = IN, ID, MY and TH. Latin America = CL, CO, MX, PE and BR. Europe = CZ, HU, PL, SK and RO.
Graph 7.A: Asia excl China = HK, IN, ID, KR, MY, PH, SG and TH. Latin America = BR, CL, CO, MX and PE. Other EMEs = CZ, HU, PL and ZA.
Graph 7.B: Historical = average GDP-weighted price-to-earnings ratios from 2 January 2010 until 26 February 2024. Latest = 26 February 2024. Advanced economies = US, JP, EA, AU, CA, NZ, CH and GB. EMEs excl China = HK, ID, KR, MY, PH, SG, TH, BR, CL, CO, MX, PE, CZ, HU, PL and ZA.
Graph 7.C: Asian EMEs = CN, ID, IN, KR, MY, TH and SG. Latin America = BR, CL, CO, MX and PE. Yield spread is the average spread of the two-year yield over the two-year US Treasury yield.
Graphs 8.A and 8.–B: Cumulative net non-resident purchases of equity and debt flows for the past 12 months, serving as proxy for portfolio flows as measured in the balance of payments.
Graph 8.C: Average figures for Emerging Asia considering ID, IN, KR, MY, PH and TH. Probability distribution of non-resident flows based on model estimation of A Aguilar, R Guerra and F Zampolli, "Assessing capital flows' risk to emerging market economies: the role of domestic factors", BIS Working Papers, forthcoming.
1 The review period covers 25 November 2023 to 26 February 2024.
2 The minutes of the December FOMC meeting, released on 3 January, while acknowledging the risks of high policy rates, reaffirmed the need to see more progress on inflation before cutting rates. This was then reinforced in a speech by Governor Waller on 17 January and in Chair Powell's press conference following the 31 January FOMC meeting. ECB President Lagarde was also cautious and stressed in the press conference following the 25 January ECB governing council meeting that rate cuts were yet not discussed.
3 The resolution of this tension between central banks, financial markets and lending volumes may produce some turbulence, especially in markets with pockets of leverage; see Box C for a discussion of risks among prime brokers.