Liquid assets at CCPs and systemic liquidity risks

Central counterparties (CCPs) are key players in financial markets, holding $1.3 trillion in liquid assets as of June 2023. The holdings are highly concentrated in the eight largest CCPs, mainly based in Europe and the United States. Most of these liquid assets are "cash" – ie deposits at central banks, reverse repos and unsecured bank deposits – and government bonds, which CCPs receive as collateral for the transactions they clear. This collateral improves systemic resilience by shielding CCPs from counterparty risk. But it also imposes liquidity demands on market participants that, occasionally, could worsen financial stress during flight-to-safety episodes or lead to destabilising margin spirals. The dual role of government bonds as both collateral and underlying assets for CCP-cleared derivatives introduces "wrong-way" risk that can exacerbate these spirals. 1
JEL classification: G10, G23, G28.
The introduction of central clearing mandates in 2012 has considerably expanded the use of collateral as a risk mitigant. While the management of counterparty risk in bilaterally cleared transactions depends, in part, on long-standing business relationships, assessments of counterparties' creditworthiness are less prominent in centrally cleared trades. Instead, central counterparties (CCPs) rely mainly on the collateralisation of transactions. For one, they require initial margin (IM) from their counterparties: clearing members need to post low-risk and liquid assets to CCPs before trades can be settled. In addition, to mutualise potential default losses in excess of IM, CCPs also require their members to contribute to a default fund (DF). As a result, CCPs are in command of large pools of liquid assets (which we refer to as "collateral" for simplicity).
This special feature analyses the size and composition of CCP collateral, as well as the implications of its management for the broader financial system. We rely on data from public quantitative disclosures by CCPs and focus on three questions. First, from a bird's eye view: how do CCPs obtain and allocate their liquid assets? Second, turning to collateral composition: how does it vary across regions, currencies and asset classes? Third, from a financial stability perspective: how do shifts in the allocation of CCPs' liquidity holdings affect systemic liquidity risk?
Three main findings emerge from our analysis. First, total collateral posted with CCPs stands at $1.3 trillion and is predominantly comprised of cash – ie deposits at central banks, reverse repos and unsecured deposits at banks – and government bonds. This amount is roughly equal to 10% of the high-quality liquid assets held by global systemically important banks. More than 85% of CCP liquid assets originate from the posted IM (where government bonds dominate) and the rest from the DF (where cash dominates). These liquid assets are concentrated at eight CCP conglomerates, which account for over 80% of the total in our data.
Second, the composition of liquid assets varies markedly across regions. CCPs in Europe and the Americas (mostly the United States) maintain high shares of their portfolios in government bonds, whereas cash prevails in Asia-Pacific CCPs. Within cash, American CCPs prefer deposits at central banks, European CCPs favour reverse repos and Asia-Pacific CCPs feature a balanced mix.
Third, while CCPs' loss-absorbing buffers support financial stability by protecting them from counterparty risk, they increase liquidity risk for market participants. During flight-to-safety episodes, for instance, some CCPs may place more cash with central banks rather than recycling it through reverse repos, thus removing liquid resources when they are in high demand. Alternatively, sudden and large IM hikes force deleveraging by derivative counterparties and can precipitate fire sales that lead to higher volatility and additional IM hikes, in so-called margin spirals. Moreover, the dual role of government bonds as collateral and underlying assets in some derivatives contracts introduces a form of "wrong-way" risk. That is, heightened volatility in the cash market for government bonds may raise collateral demand in derivative markets precisely when government bond prices are falling and the value of existing IM is thus eroding. Ultimately, this would increase the appeal of cash collateral and may contribute to a downward price spiral in government bonds.
The rest of this article is structured as follows. The first section sets the stage with a brief conceptual discussion of how CCPs obtain and allocate their liquid assets. The second section reviews the landscape of liquid assets held by CCPs, focusing on their geographic, currency and asset class distribution. The third section analyses the potential impact of shifts in the allocation of CCPs' liquidity holdings on systemic liquidity risk. A final section concludes with policy implications. Box A describes the CCP disclosure data used throughout the article.
Key takeaways
- Liquid assets held by CCPs stood at $1.3 trillion at mid-2023, mostly consisting of government bonds and "cash", ie deposits at central banks, reverse repos and unsecured deposits at banks.
- Collateral composition varies across regions: CCPs in Europe and the Americas predominantly hold government bonds, whereas cash dominates in CCPs domiciled in Asia-Pacific.
- Shifts in the composition of CCP liquid assets can amplify liquidity shortages in times of stress or contribute to downward price spirals for government bonds.
A bird's eye view of CCP collateral management
CCPs' soundness, critical for the resilience and stability of the financial system, rests on a well defined risk management framework.2 As part of this framework, the loss-absorbing buffers available to CCPs mainly include clearing members' IM and their contributions to the DF (Faruqui et al (2018)).3 Graph 1 presents a stylised map of collateral flows related to a CCP. To meet the CCP's IM and DF requirements, clearing members post liquid assets, usually in the form of cash (C, solid blue arrow) and government bonds (B, dashed blue arrow).
A CCP has various options to allocate the cash collateral received from members (Graph 1, solid black arrows).4 The safest option is to deposit cash with central banks, which is free from credit and liquidity risks (Borio et al (2023)). This option, however, is available only to CCPs with central bank accounts, and may deliver relatively low yields. A second possibility is to lend cash via reverse repos or in unsecured deposits at banks – some of which may be clearing members. Cash lent in reverse repos is secured with high-quality collateral (typically government bonds), mitigating counterparty risk. Alternatively, CCPs' unsecured bank deposits carry more risk but receive higher interest rates. A third option is to invest the cash in other low-risk, easily marketable financial instruments ("other" in Graph 1).
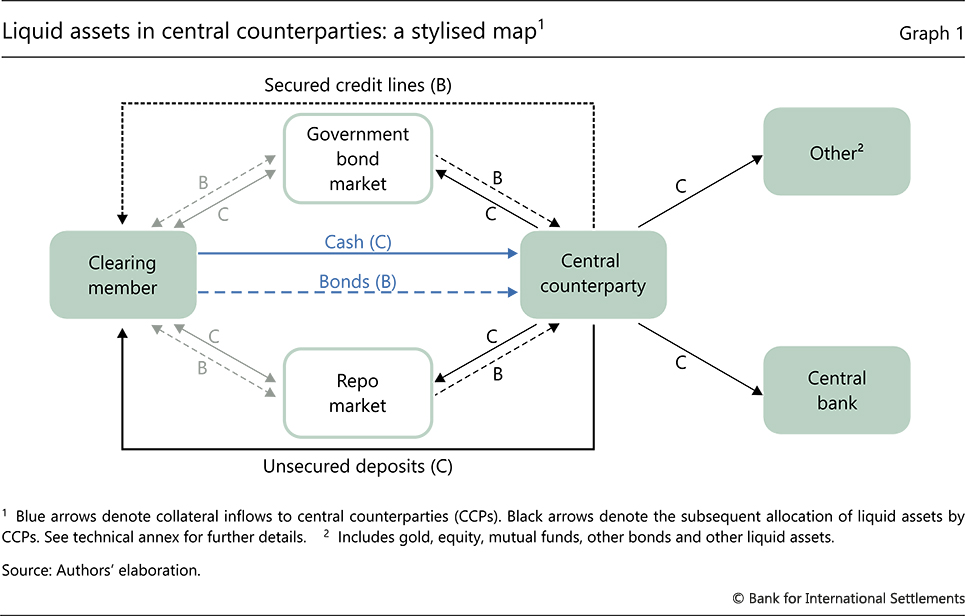
CCPs also receive non-cash collateral from clearing members, typically government bonds. CCPs can use this non-cash collateral, together with any other high-quality liquid securities, in order to arrange secured credit lines with banks – a way of monetising these assets.5 The rest of the non-cash collateral received typically comprises highly marketable assets that should be easy to convert into cash without material market price impact.
The landscape of liquid assets held by CCPs
We use CCP quantitative disclosure data to study how CCPs allocate the collateral obtained from clearing members across different types of liquid assets. Our sample has 31 CCP groups in total, encompassing 184 clearing services. To ensure our sample is representative and consistent, we use data from Q1 2018 to Q2 2023 (Box A).
Overview of collateral origination
IM accounts for the bulk of the collateral held by CCPs (about 85%), with the rest coming from members' DF. IM increased from $670 billion in March 2018 to $1.14 trillion in June 2023, ie about 70% (Graph 2.A). This growth reflects, in part, the trend towards a higher use of collateral in financial markets (Borio et al (2023)). DF also increased steadily during our sample period, from $120 billion to $160 billion.
IM saw pronounced spikes in our sample. Most notably, these occurred in early 2020 (Covid-19) and 2022 (invasion of Ukraine), reflecting the risk-sensitive nature of IM models as well as shifts in risk perceptions. Sharp shifts in those perceptions sometimes lead to large adjustments in IM that may substantially affect the leverage embedded in derivatives transactions (Avalos et al (2023)). In comparison, DF is less responsive to short-run market developments.
Central clearing is highly concentrated. Eight CCP groups6 with a global reach account for over 80% of total IM and 90% of total DF in our sample (Graph 2.B), for a combined amount of about $1.1 trillion as of June 2023. Concentration is partly a structural feature of cleared markets, as multilateral netting benefits for traders are greater when their positions are distributed across a smaller number of CCPs (Duffie and Zhu (2011)). In addition, concentration can rise sharply when markets become stressed, as revealed by the surge in the share of DF and especially IM held by the eight global CCP groups at the start of the pandemic.
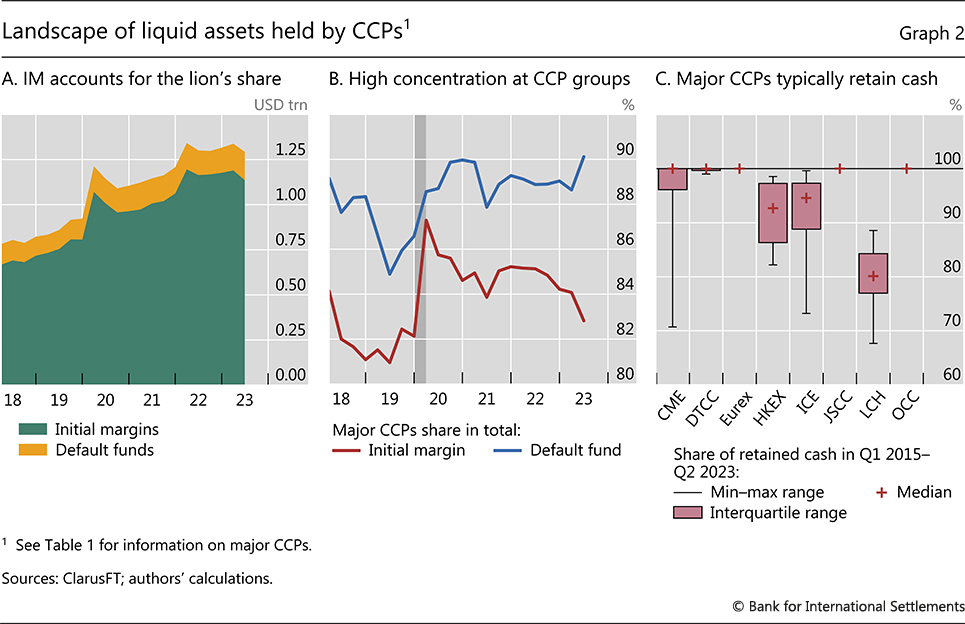
The collateral received by CCPs is intended to be available at short notice in case of defaults, so its liquidity is key to ensuring CCP resilience. To minimise liquidity risk, most CCPs keep the cash collateral they receive from clearing members rather than investing it in other assets with higher returns. Four of the eight global CCPs consistently follow this practice (Graph 2.C). The other four occasionally allocate a limited fraction – typically less than 25% – to other high-quality liquid assets.
Collateral composition
CCPs' collateral composition differs along at least three dimensions: (i) IM versus DF; (ii) regions and associated currencies; and (iii) types of contract cleared by the eight global CCPs.
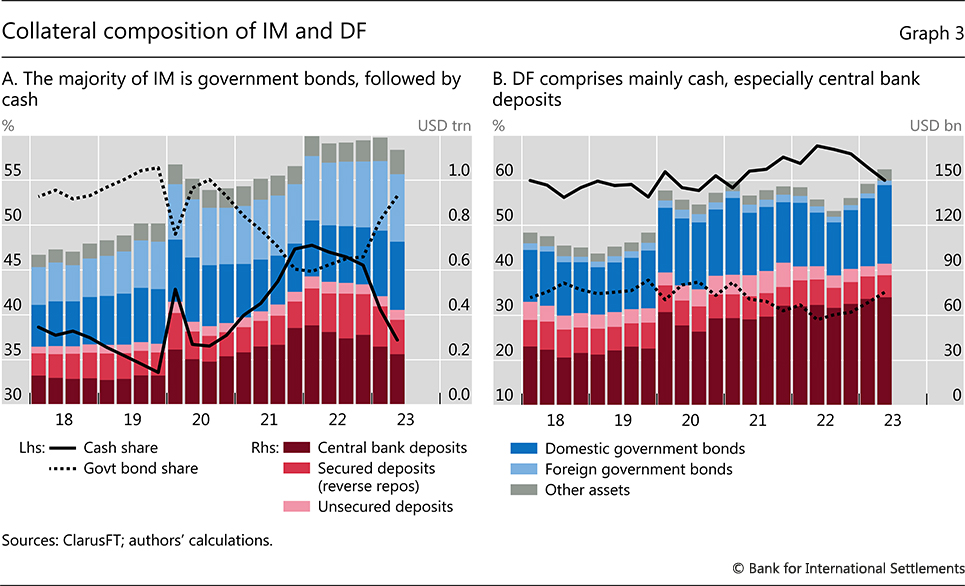
Government bonds dominate cash in IM. As of end-June 2023, CCPs in our sample held around $600 billion in government bonds, equally split between foreign and domestic. The share of such bonds in IM was usually above 50% during our sample period (Graph 3.A, dotted black line). The predominance of government bonds in total IM partly reflects their "quasi-money" nature, given their wide acceptability and high liquidity (BIS (2023)). In parallel, the share of cash in IM oscillated between 33 and 48% (solid black line). As the safest option, central bank deposits account for the lion's share of cash in IM.
In contrast, cash in various forms represents the majority of DF. The share of cash in DF has typically hovered around 60%, mostly in the form of central bank deposits (Graph 3.B). Such a high share of the most liquid assets presumably reflects the high likelihood that, if a DF is called upon to cover losses from defaulting members, the prevailing environment will be one of financial stress.
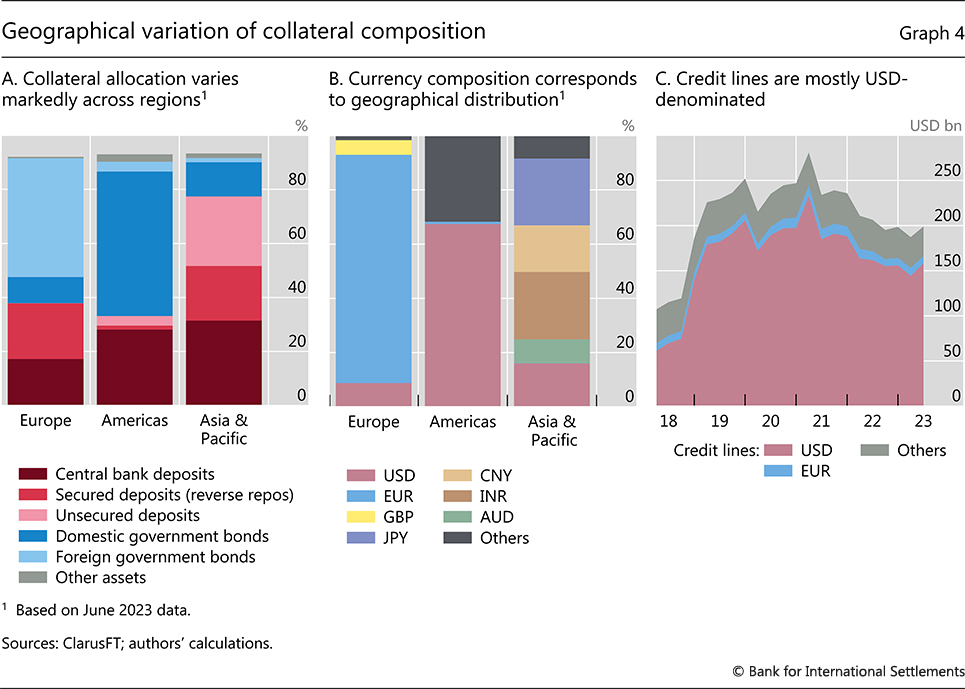
Collateral composition varies greatly across regions. CCPs located in Europe and the Americas (mostly the United States) have relatively high shares of government bonds in total collateral (Graph 4.A, blue areas). In the case of European CCPs, it is foreign bonds that dominate, whereas for CCPs in the Americas it is domestic bonds – most likely US Treasuries. In contrast, cash holdings dominate in Asia-Pacific CCPs, representing about 80% of all collateral held. The allocation to various types of cash also differs across regions (red areas). CCPs in the Americas predominantly rely on central bank deposits, those in Europe place more cash in reverse repos, and Asia-Pacific CCPs have a rather even split across central bank deposits, reverse repos and, notably, unsecured deposits.7
In terms of currencies, the US dollar and euro dominate the overall pool of liquid resources, as the largest global CCPs are domiciled in the United States and Europe. As of end-June 2023, over 80% of European CCPs' liquid resources were denominated in euros (Graph 4.B). Likewise, for CCPs in the Americas, 67% of the liquid assets are in US dollars. For Asia-Pacific CCPs, the picture is more mixed, as they are domiciled in jurisdictions with various currencies. The top three currencies are the Japanese yen, Indian rupee and the renminbi, accounting for 25%, 25% and 17% of liquid resources, respectively. With a share of 16%, the dollar has a large heft in this region as well.
Credit lines are mostly denominated in US dollars and typically secured by the non-cash collateral CCPs receive.8 Dollar credit lines expanded from $60 billion in March 2018 to $160 billion in June 2023 (Graph 4.C, red area). In contrast, euro-denominated credit lines remained largely below $10 billion (blue area). Overall, about 80% of outstanding credit lines, as of June 2023, are denominated in US dollars.
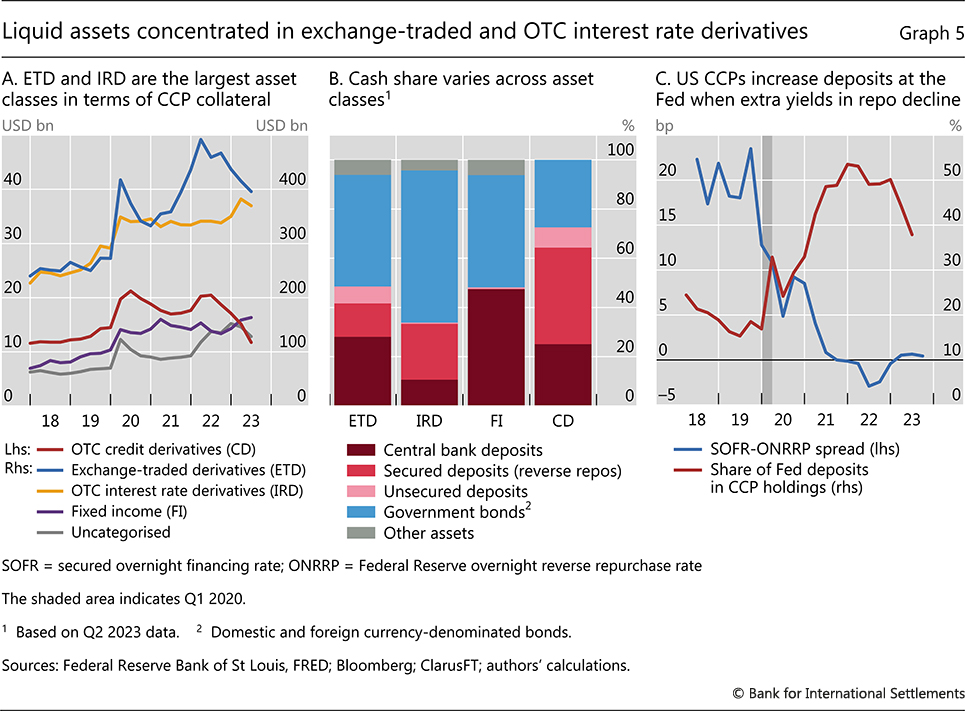
Our data reveal that collateral allocation across the eight global CCP groups also varies with the type of contract they clear. Three types stand out: (i) exchange-traded derivatives, mainly futures and options; (ii) over-the-counter (OTC) derivatives subject to central clearing mandates, including interest rate derivatives – mostly swaps – and credit derivatives – mostly credit default swaps; and (iii) other fixed income instruments, mainly repo and mortgage-backed securities lending. Exchange-traded derivatives contracts are the largest source of collateral, with $400 billion or 37% of the global total, as of June 2023. OTC interest rate derivatives contracts are a close runner-up at $370 billion, or 35% of total global collateral (Graph 5.A). Government bonds account for at least half of the collateral held by CCPs clearing OTC interest rate derivatives (Graph 5.B, blue areas), whereas cash dominates in CCPs clearing OTC credit derivatives (red areas). The collateral mix is more balanced for exchange-traded derivatives and fixed income instruments.
CCP liquidity holdings and market dynamics
We study two main channels through which CCP collateral composition and changes thereof can affect systemic liquidity.9 The first is CCPs' shifts in cash allocation during "flight-to-safety" episodes. The second relates to changes in IM requirements, which can lead to margin spirals, potentially exacerbated by the dual role of government bonds as collateral and as the underlying asset in derivatives.
CCP cash allocation and potential flight to safety
Differences in the cash composition across asset classes are relevant from a systemic liquidity perspective. For example, CCPs clearing fixed income instruments typically park a large share of the cash received from members in central bank deposits (Graph 5.B, dark red areas). This tightens liquidity conditions unless the central bank reinjects the reserves into the banking system. In contrast, CCPs clearing OTC interest rate and credit derivatives are more involved in repo markets, lending out 23% and 40% of their cash collateral through reverse repos, respectively. This recycles liquidity back into the financial system, lowering repo rates and easing funding conditions (Benos et al (2023)).
The differences in cash allocation across CCPs can relate to institutional constraints as well as CCP price sensitivity. For one, only some CCPs have access to deposit accounts at central banks – this is typically not the case for foreign-domiciled CCP entities.10 Moreover, CCPs can be price-sensitive in the allocation of their cash holdings. For instance, major US CCPs ramped up their deposits at the Federal Reserve as the spread between the secured overnight financing rate and the Federal Reserve overnight reverse repurchase rate narrowed during 2020–21, that is, when the extra yields offered by repo markets shrank (Graph 5.C).
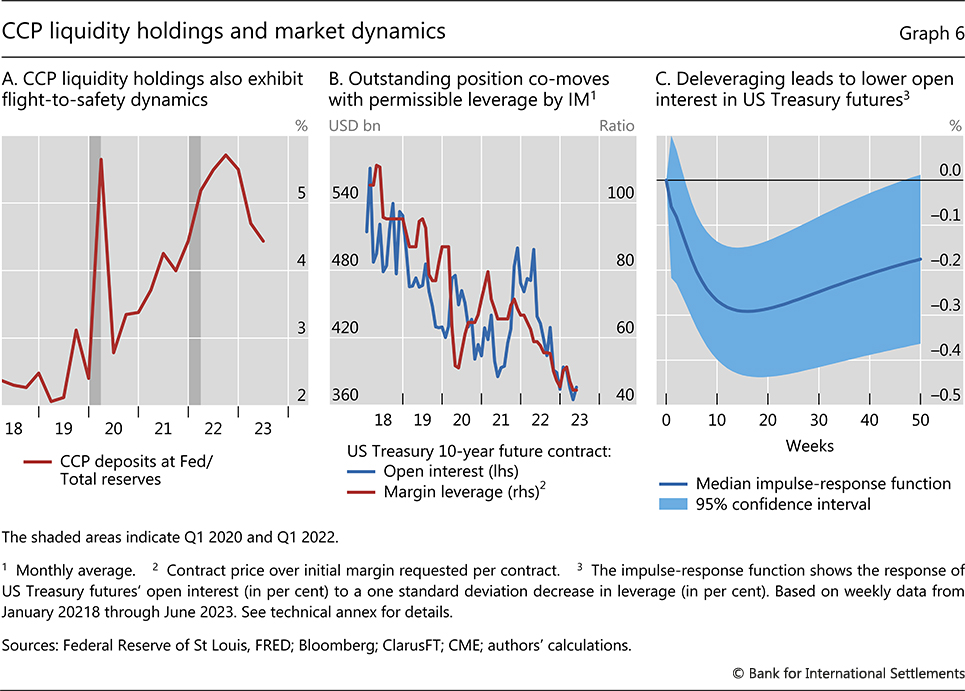
Beyond institutional constraints and price incentives, CCPs are not immune to "flight-to-safety" behaviour. Much like other market participants, they may protect themselves under stress by rushing to the most liquid and safest form of money available. Consistent with this, US CCPs' deposits with the Federal Reserve doubled in Q1 2020 (Covid-19 global outbreak), taking their share in total collateral from 17% to 33% (Graph 5.C, red line, greyed period). Both a response and a contributor to the dash for cash, CCP deposits at the central bank increased from 2.4% to 5.6% as a ratio to total bank reserves held at the central bank in Q1 2020 (Graph 6.A). A similar, even if more modest, spike occurred at the beginning of the war in Ukraine, when this share jumped from 4.4% to 5.2%.
Margin spirals and wrong-way risk
CCPs' adjustment of IM requirements can exacerbate systemic liquidity stress in some circumstances. This is because an increase in IM, ie a decrease in allowed leverage, tends to occur in times of stress.11 Occasionally, this may lead to fire sales in cash and derivative markets, increasing volatility further, and triggering additional rounds of IM calls – ie a margin spiral (eg Brunnermeier and Pedersen (2009)).12
There is some evidence lending support to this conjecture. Using US Treasury futures data, we document that open interest (ie the notional value of futures contracts held by market participants) co-moves with the leverage allowed by IM requirements: as leverage fell, so did open interest (Graph 6.B). Moreover, using a vector autoregression (VAR) model that controls for the incidence of several contemporaneous factors, we also find that deleveraging leads to lower open interest in US Treasury futures (Graph 6.C). In other words, IM surges (ie cuts in permitted leverage) result in the closing of outstanding positions. In certain contexts, this could lead to market stress, consistent with documented margin spirals in recent episodes such as the March 2020 "dash for cash" and the September 2022 UK gilt market turmoil (Schrimpf et al (2020) and Breeden (2022)).
The dual role of government bonds as collateral and underlying assets in derivatives contracts can introduce "wrong-way" risk – ie the risk that collateral loses value precisely when counterparty risk increases. When volatility increases in government bond markets, CCPs demand more IM to counteract the heightened counterparty risk. If government bond prices are simultaneously falling, the value of existing collateral drops – effectively requiring even more collateral to maintain the positions. This increases the appeal of cash collateral and may exacerbate the downward pressure on government bond prices, reinforcing the spiral.
Wrong-way risk dynamics appeared to play a role during the 2010–11 Irish sovereign debt crisis. At that time, investors liquidated their positions in Irish government bonds after a CCP raised the haircuts on such bonds when used as collateral. This led to lower prices of Irish government bonds, ie a widening of their spread vis-à-vis the yield on German bunds, triggering further haircuts, further position closures and ultimately a downward price spiral. From late 2010 to mid-2011, Irish yield spreads to German bunds rose from 40 to almost 120 basis points, while CCP haircuts on Irish government bonds increased from 0% to 80% (Altenhofen and Lohff (2013)).
While the size of CCP government bond holdings remains relatively small, the potential for self-reinforcing spirals should not be underestimated. In our data, the share of CCP holdings in total government debt securities outstanding as of end-2022 is highest for Brazilian, Chilean and Swedish government bond markets: 6.1%, 3.6% and 3.1%, respectively. The government bond holdings of the largest CCPs – typically active in the United States, the United Kingdom, Germany and France – account for even smaller shares of the respective markets. That said, recent stress in the UK gilt market serves as a stark reminder that self-reinforcing spirals originating in a relatively small market segment can potentially threaten the stability of the broader financial system.
Conclusion
CCPs currently manage a large pool of liquid assets, which supports financial stability by safeguarding them from counterparty risk. At the same time, risk does not disappear but morphs into systemic liquidity risk, especially in a context of margin spirals (Aramonte et al (2023)). After surveying the global landscape of CCP liquid assets and their allocation, we argue that under certain circumstances shifts in CCP collateral composition may contribute to the propagation of systemic liquidity stress.
Our findings underscore the importance of ongoing international policy work on CCP margining practices. The public quantitative disclosure data used above are an outcome of the CPMI-IOSCO Principles for Financial Market Infrastructures, which seek to enhance the monitoring of CCP-related risks. Further improving the quality and reliability of these disclosures would be of much value. For example, expanding the availability of granular data on the currency and maturity composition of CCP non-cash collateral could help to better assess wrong-way risk. In addition, our results complement existing work on margining procyclicality (eg BCBS-CPMI-IOSCO (2022) and FSB (2023)), as we quantify the size and composition of CCP liquidity holdings from a global perspective. Taken together, the findings of existing studies highlight the importance of striking a careful balance between ensuring CCP resilience, on the one hand, and avoiding systemic liquidity shortages, on the other.
References
Altenhofen, D and J Lohff (2013): "Market dynamics, frictions and contagion effects", Danmarks Nationalbank Monetary Review, 1st quarter, part 2.
Aramonte, S, A Schrimpf and H S Shin (2023): "Margins, debt capacity and systemic risk", BIS Working Papers, no 1121.
Avalos, F, W Huang and K Tracol (2023): "Margins and liquidity in European energy markets in 2022", BIS Bulletin, no 77, September.
BCBS-CPMI-FSB-IOSCO (2018): Analysis of central clearing interdependencies, August.
Benos, E, G Ferrara and A Ranaldo (2023): "Collateral cycles", Swiss Finance Institute Research Paper, no 22-91.
BIS (2023): "Monetary and fiscal policy: safeguarding stability and trust", Annual Economic Report 2023, Chapter II.
Borio, C, S Claessens, A Schrimpf and N Tarashev (2023): "Collateral damage", Vox EU, July.
Breeden, S (2022): "Risks from leverage – how did a small corner of the pensions industry threaten financial stability?", speech at ISDA & AIMA, 7 November.
Brunnermeier, M and L Pedersen (2009): "Market liquidity and funding liquidity", The Review of Financial Studies, vol 22, issue 6.
BCBS-CPMI-IOSCO (2022): Review of margining practices, September.
Duffie, D and H Zhu (2011): "Does a central clearing counterparty reduce counterparty risk?", Rock Center for Corporate Governance at Stanford University Working Paper, no 46.
Faruqui, U, W Huang and E Takáts (2018): "Clearing risks in OTC derivatives markets: the CCP-bank nexus", BIS Quarterly Review, December, pp 73–90.
Financial Stability Board (FSB) (2023): The Financial Stability Aspects of Commodities Markets, February.
Gurrola-Perez, P (2023): "How confident are we of margin model procyclicality measurements?", WFE Working Papers, April.
Huang, W and E Takáts (2023): "Model risk at central counterparties: Is skin-in-the-game a game changer?", International Journal of Central Banking, forthcoming.
King, T, D Nesmith, A Paulson and T Prono (2023): "Central clearing and systemic liquidity risk", International Journal of Central Banking, vol 19, no 4.
Murphy, D, M Vasios and N Vause (2014): "An investigation into the procyclicality of risk-based initial margin models", Bank of England Financial Stability Paper, no 29.
Schrimpf, A, H S Shin and V Sushko (2020): "Leverage and margin spirals in fixed income markets during the Covid-19 crisis", BIS Bulletin, no 2, April.
Technical annex
Throughout the special feature, we refer only to the post-haircut values of collateral held by CCPs.
Graph 1: For simplicity, the graph assumes that unsecured deposits and secured credit lines are with clearing member banks. In practice, they can be with any bank.
Graph 2.C: Based on the percentage of total participant cash held as cash deposits (including through reverse repos) reported by individual entities of the major CCP groups. The group-level total participant cash held as cash deposits (including through reverse repos) is computed as the weighted average of the entity-level share, using total cash received by the respective entities as the weights. For DTCC, the simple average is applied for the three entities as total cash received is not available in ClarusFT.
Graph 4.B: The very large share of the euro in the currency composition of CCPs in Europe may be due to data reporting issues.
Graph 6.C: The variables in the vector autoregression model include (in order): log(price), volatility, log(allowed leverage) and log(open interest) – all referring to 10-year US Treasury futures. Volatility is defined as the 30-day moving standard deviation of the US Treasury 10-year bond future price daily change, annualised. Allowed leverage is defined as the price of a contract divided by initial margin in US dollars. The model is identified using a Cholesky decomposition, such that the order of variables determines the temporal sequence of how innovations in one variable affect the others, eg innovations in log(price) contemporaneously affect all other variables, whereas it is not itself contemporaneously affected by innovations in other variables. The estimation is based on weekly data, specifically using the Friday observation of each week.
1 We thank Claudio Borio, Sebastian Doerr, Gastón Gelos, David MacDonald, Benoît Mojon, Hyun Song Shin, Takeshi Shirakami, Nikola Tarashev and Kevin Tracol for helpful comments and suggestions and Nicolas Lemercier and Ilaria Mattei for research assistance. The views expressed are those of the authors and do not necessarily reflect those of the BIS.
2 At the core of this framework is the "default waterfall", which specifies the order of loss absorption by the resources available to CCPs in the event of a clearing member's default. When a clearing member defaults, its IM is the first buffer to absorb the resulting losses. The DF absorbs any losses in excess of this IM, mutualising them across the surviving members.
3 CCP capital is also part of the risk management framework, but its size is small relative to IM and DF (Huang and Takáts (2023)). In turn, CCPs' committed loss-absorbing resources are called upon only when the IM of a defaulting counterparty and the DF are depleted. Thus, they do not count as liquid assets from a CCP's standpoint. In addition, the cash that CCPs typically use to transfer variation margin between counterparties is also not part of liquidity holdings.
4 In doing so, CCPs must always stay within the realm of high-quality, low-risk liquid assets and are subject to strict investment policies. Specific requirements for the type and amounts of liquid assets (and the allocation thereof) vary by jurisdiction and are subject to regulatory oversight.
5 To finance their liquidity needs, CCPs may also have access to unsecured credit lines.
6 The eight CCP groups are the largest CCPs in terms of activity across regions and asset classes. They correspond to the "MajorCCP" flag in Box A.
7 The small share of unsecured deposits in European CCPs – less than 0.1% – is consistent with the European Market Infrastructure Regulation (EMIR), which caps them at 5% of IM.
8 Credit lines are sometimes extended by clearing members (BCBS-CPMI-FSB-IOSCO (2018)).
9 For a recent review of other channels through which CCPs' operations may affect liquidity in the broader financial system, see King et al (2023).
10 Central banks typically offer accounts to domestic banks, and in some cases domestic CCPs for financial stability and settlement efficiency reasons.
11 This results from the combination of two features. First, IM requirements in derivatives markets (like haircuts in repo markets) mechanically limit the leverage of market participants. Second, IM requirements increase when market volatility rises, in order to mitigate counterparty credit risk (Murphy et al (2014) and Gurrola-Perez (2023)).
12 In stress times with large price changes, variation margin calls that settle marked-to-market profits and losses could also lead to "loss spirals", which can be significant in size (FSB (2021)). However, this is out of this article's scope, given the focus on liquid assets actually held by CCPs.