Resilient risk-taking in financial markets

With the end of the hiking phase in sight, investors focused on macroeconomic developments during the review period, while staying attuned to their policy implications.1 Government bond yields rose in advanced economies (AEs), with term structures reflecting increasingly diverse economic outlooks. Despite a spell of de-risking in August, risk-taking was generally resilient, including in emerging market economies (EMEs).
Notable differences marked the evolution of government bond yields in China, the euro area and the United States. While US long-term yields reached highs not seen since before the Great Financial Crisis, such yields barely rose in the euro area. These dissimilar paths were driven by inflation-adjusted, ie real, yields consistent with a stronger economic outlook in the US than in the euro area. As short-term rates rose in the euro area on the back of stubborn inflation, the term structure there inverted further. Bond yields largely declined in China, amid a faltering recovery from Covid restrictions and monetary policy easing.
US Treasuries were at the centre of heightened market volatility in early August. Yield rises accelerated as investors became more convinced that higher rates were here to stay following better than expected US growth numbers. In addition, several, almost concurrent announcements fuelled investor unease and led to a sell-off: an unexpected increase in the issuance of long-dated bonds by the US government; the greater flexibility in the Bank of Japan's yield curve control policy; and a downgrade of the US sovereign credit rating. The upward pressure on US yields spilled over to other AE government bond markets.
Risky assets held up firmly, but also exhibited some divergence across major economies due to the differing outlooks. Consistent with developments in core bond markets, stock returns were higher in the US than in the euro area and China. Likewise, sentiment in corporate credit markets seemed to improve in the US but remained relatively subdued in the euro area. US credit spreads narrowed below historical landmarks and issuance gained some traction. In contrast, bank lending to firms was still sluggish across jurisdictions.
Financial market developments in EMEs reflected a new phase of monetary policy across most jurisdictions as well as external factors. Short yields fell as the monetary policy stance began to turn, with most central banks pausing rate hikes or implementing cuts. Risk-taking continued, with higher-yielding currencies attracting capital inflows. In August, EME spreads and exchange rates also appeared sensitive to the temporary bout of de-risking in AE financial markets: the appreciation of Latin American currencies came to a halt, speculative positions in currency futures declined, and the rise of long-term yields accelerated. In addition, headwinds seemed to emerge from China's slowdown.
Key takeaways
- Advanced economy government bond yields generally rose, whereas yield curves echoed differences in inflation and economic growth dynamics across jurisdictions.
- Risky asset markets were largely resilient, with stock markets also pricing in the diverging growth outlooks across major economies.
- Financial markets in EMEs reflected differences in policy outlooks and macroeconomic environments across regions, with some de-risking in August amid mounting concerns over the outlook for China.
US yields led the way upwards
Disinflation and growth have proceeded unevenly across countries. The stronger performance of US markets has shaped trends in core bond markets during the review period. And investors remained closely attuned to the policy implications of the evolving macroeconomic scenarios for these markets.
The paths of long-term government yields were underpinned by the trajectories of real yields, which seemed to reflect both macroeconomic outlooks and perceptions of the monetary policy stance. Ten-year yields rose across most major AEs and reached their highest levels since the Great Financial Crisis in the US (Graph 1.A). And the country's steadily rising real yields (Graph1.B) were consistent with favourable economic developments, eg a resilient, consumer-led growth. In contrast, long-term nominal yields rose only slightly in Germany and other euro area countries. This reflected largely flat real yields, as the outlook for the region darkened, amid persistent weakness in manufacturing as well as flatlining exports and consumption. The increase in long-term real yields, particularly in the US, was also consistent with a growing conviction by investors that higher rates were here to stay.
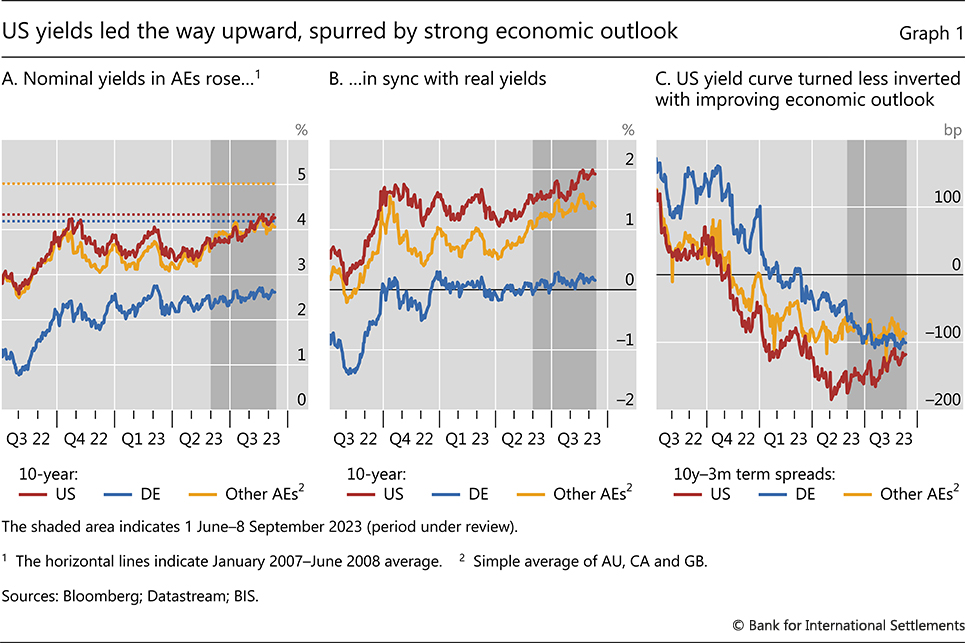
Changes in term spreads reflected differences in the pace of disinflation and growth outlooks across jurisdictions. To be sure, yield curves remained strongly inverted in all major AEs, despite a general perception that deep recessions are likely to be avoided. Yet the inversion of the US yield curve moderated (Graph 1.C), as lower inflation kept a lid on short rates while long yields rose. Meanwhile, yield curve inversion deepened further in Germany, where flatter long yields went hand in hand with quickly rising short rates. The latter rose on high and stubborn inflation, which reinforced perceptions that monetary policy will remain tight in the euro area.
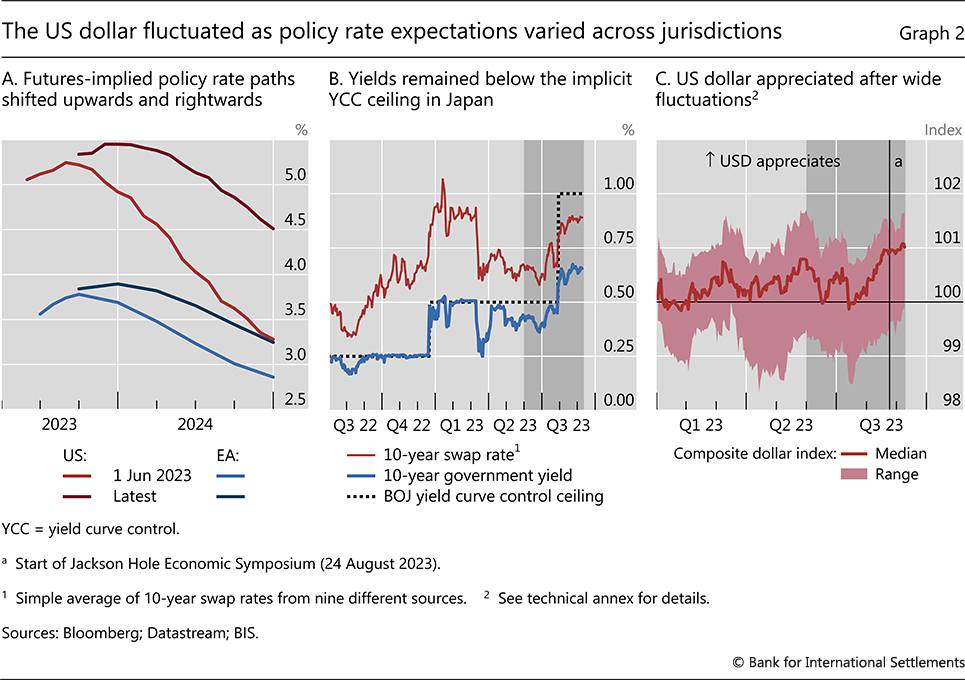
The path of policy rates priced into futures markets in major AEs became more in line with the cautious tone of central banks. The Federal Reserve and the ECB raised policy rates further in July, and emphasised in their communications that future decisions would be data-dependent. Officials also indicated that, while rates might not rise much more, they could stay at their current levels for a prolonged period if inflation remained above target. In accordance with these messages, futures markets in both in the US and the euro area priced in higher rates for 2024 than they had just a few months before (Graph 2.A). And the expected peak in policy rates was pushed higher and later. That said, investors still seemed to anticipate rate cuts as early as the second quarter of 2024, and much deeper in the US than the euro area.
A sell-off of long-term bonds took place in August amid a succession of negative news for US Treasuries. Early in the month, the US Treasury announced a large increase in the issuance of long-maturity securities, catching investors by surprise. This was almost concurrent with the downgrade of the US sovereign credit rating by a major agency. In addition, movements in yields may have been amplified by the lower liquidity of summer trading as well as the partial unwinding of the growing build-up of leveraged speculative positions in US Treasury markets (Box A). Although the sell-off did not last long, it did appear to spill over to government bond markets of other AEs. Yields across AEs subsequently paused their upward momentum after the Federal Reserve's Jackson Hole symposium in late August, as investors appeared more convinced that a pause in rate hikes was in sight, especially following a string of relatively weak US data releases, including a subdued jobs report.
The short-lived sell-off may have been exacerbated by an announcement of the Bank of Japan, which introduced greater flexibility to its yield curve control policy. In late July, the Bank effectively raised the upper bound of the intervention band for the 10-year JGB yield to 1%, while otherwise maintaining its accommodative policy stance. In practice, this new ceiling no longer restricted either JGB yields or 10-year swap rates, both of which remained well below the new operational ceiling (Graph 2.B). In the wake of the announcement, investors fretted over potential spillovers, as Japanese investors could eventually find it profitable to repatriate funds from several asset classes, including US Treasuries.
Further reading:
The US dollar saw wide fluctuations during the review period. After weakening in July, it strengthened persistently, as the US outlook improved and real yields rose further (Graph 2.C), and then lost some momentum again after the Jackson Hole meeting. At the level of currency pairs, differences in the attendant monetary outlooks played a role. The dollar remained largely flat vis-à-vis currencies whose interest rates were expected to remain relatively high, such as the euro and the British pound, and appreciated markedly vis-à-vis those at the opposite end of the spectrum, such as the Scandinavians and the yen. It appreciated similarly against commodity currencies, such as the Australian and Canadian dollar, not least because of perceptions of a weakening demand from China.
Investors ploughed ahead in risky assets
Risky assets extended their gains from the previous quarter, despite a brief pause in August alongside the heightened volatility in fixed income markets. With the end of the hiking cycle perceived to be in sight and the prospects of US recession fading, primary market activity in corporate credit markets regained some dynamism, particularly in the US high-yield segment. However, bank lending remained subdued across jurisdictions.
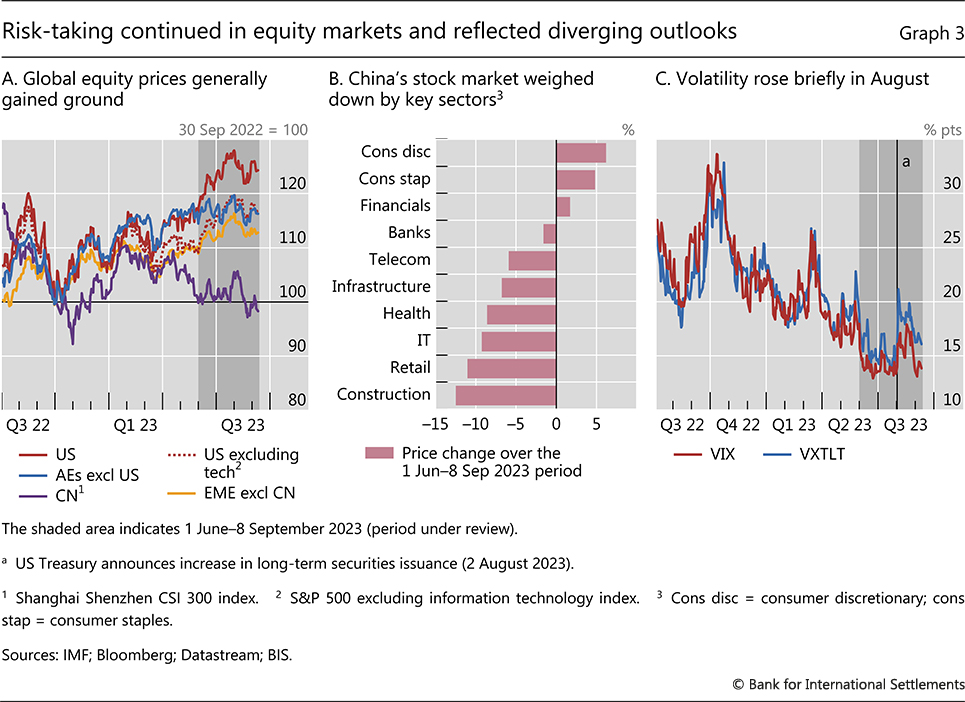
Beyond the overall gains, equity markets also reflected the diverging economic outlook across major economies. US equities outperformed those in other regions (Graph 3.A), in part because of fading recession fears, and the exuberance about technology stocks. Excluding those stocks, the US market performance was closer to global averages (dashed red line). In turn, the gains were smaller in other AEs, particularly European stocks, in part due to spillovers from China's economic malaise. The losses in Chinese stocks deepened during the review period, as the economic rebound after the lifting of Covid restrictions increasingly disappointed. Reflecting the woes in the property sector, the country's construction and infrastructure stocks were among the worst performers during the review period, together with retailing (Graph 3.B).
Stock price fluctuations reflected macroeconomic news, as investors digested their policy implications. For example, equity markets lost some ground with a better-than-expected second quarter release of US GDP figures in late July, as it seemed to raise the likelihood of tighter policy ahead.
Likewise, equity and bond yield volatilities co-moved as investors interpreted macroeconomic surprises in terms of their implications for future interest rates. The VIX jumped alongside the implied volatility of US long-term yields, as the late July release of better than expected US GDP data suggested higher future interest rates. Subsequently, both receded in the wake of the Jackson Hole meeting and weaker-than-expected US job openings data in late August (Graph 3.C).
Market funding conditions for banks remained somewhat tighter. The banking sector stock subindices continued to trail the broader equity market aggregates in major economies. Recent downgrades of mid-sized US banks by a major rating agency were a probable recent contributing factor, as was a negative watch/outlook for some of their larger peers. Also, conditions in bank short-term funding markets became more discriminating (Box C), as liquidity was gradually removed by central banks' quantitative tightening. At the same time, sovereign debt issuance continued to grow.
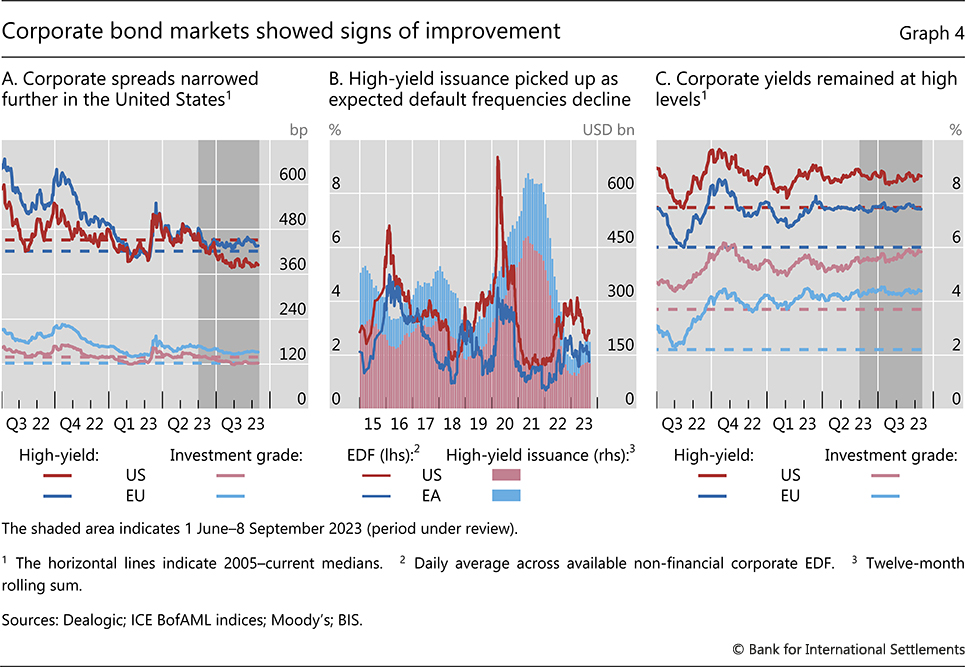
Corporate credit spreads, which had narrowed earlier in the review period, found a floor during the de-risking episode of August. Spreads had fallen well below long-term watermarks in the US, in both the investment grade and high-yield segments, indicative of sustained risk-taking (Graph 4.A). On the back of improved sentiment, high-yield issuance regained momentum after the steep decline of 2022 (Graph 4.B, red bars), as the US stock market gains drove a material fall in expected default frequencies (red line). Spread compression was more moderate and issuance scarcer in the euro area, where the direction of expected defaults was less clear amid stagnant economic prospects (blue line).
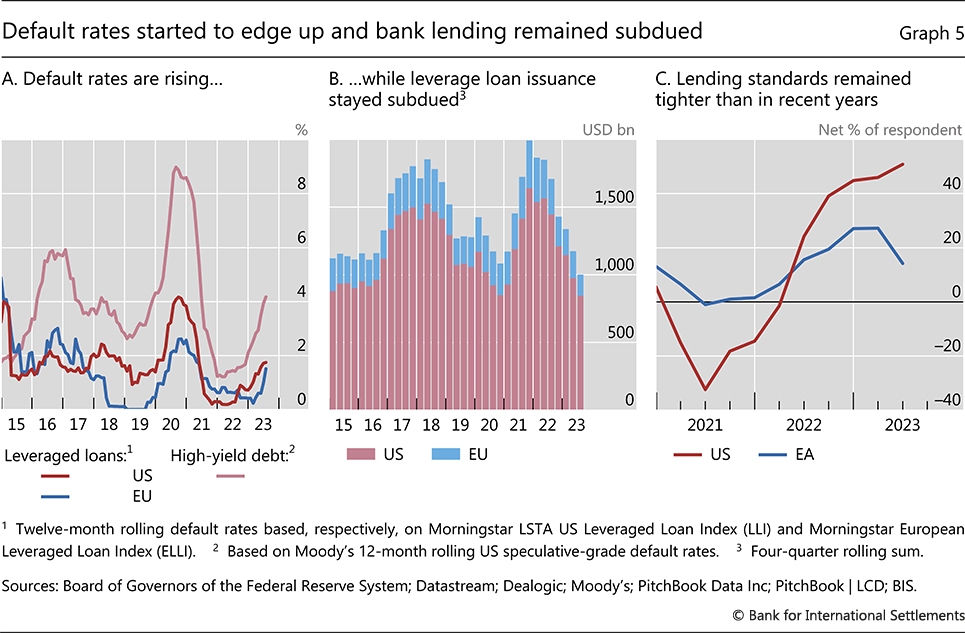
Despite the compression in credit spreads, corporate funding costs reached highs well above long-term levels as a result of rising benchmark rates. Corporate bond yields in both the investment grade and high-yield segments remained well above their long-term averages (Graph 4.C). This may represent a significant financial burden for some firms going forward. For now, many firms have been able to postpone new borrowing, given their diminished cash needs after strong debt issuance during the low-for-long era (Box B). Nevertheless, corporate default rates have started to edge up. High-yield bond default rates reached 4% in July (Graph 5.A, light red line), taking the aggregate default rate for all US issuers to over 2%. As debt maturities loom large within the next three years, highly leveraged firms with low profitability may come under pressure and defaults may rise further.
With default rates on loans also climbing, banks kept their credit extension within modest bounds. Consumer loan delinquency rates rebounded, after being cushioned by fiscal support in the wake of the pandemic. In addition, default rates on leveraged loans rose steadily from below 1% in mid-2023 to approximately 2% most recently in both the US and euro area, with the increase gathering speed in the second half of the year (Graph 5.A, dark red and blue lines). And forward-looking provisions for credit losses surged to the highest levels since the second quarter of 2020. In this context, bank loan growth was weak or negative in all major AEs. Likewise, leveraged loans issuance remained sluggish both in the US and the euro area (Graph 5.B), showing few signs of recovery after the steep decline in 2022.
Both supply and demand factors played a role. For one, survey results indicated tight lending standards (Graph 5.C). And even though market intelligence suggests that banks subsequently became more open to credit extension, they faced weak loan demand. As in the case of corporate bond markets, firms with strong cash buffers were reluctant to borrow at increased lending rates.
EMEs confronted with global cross-currents
EME financial markets reflected differences in policy outlooks and macroeconomic environments across regions. As economies grappled with the varying headwinds coming from the slowdown in China, policy outlooks have increasingly diverged.
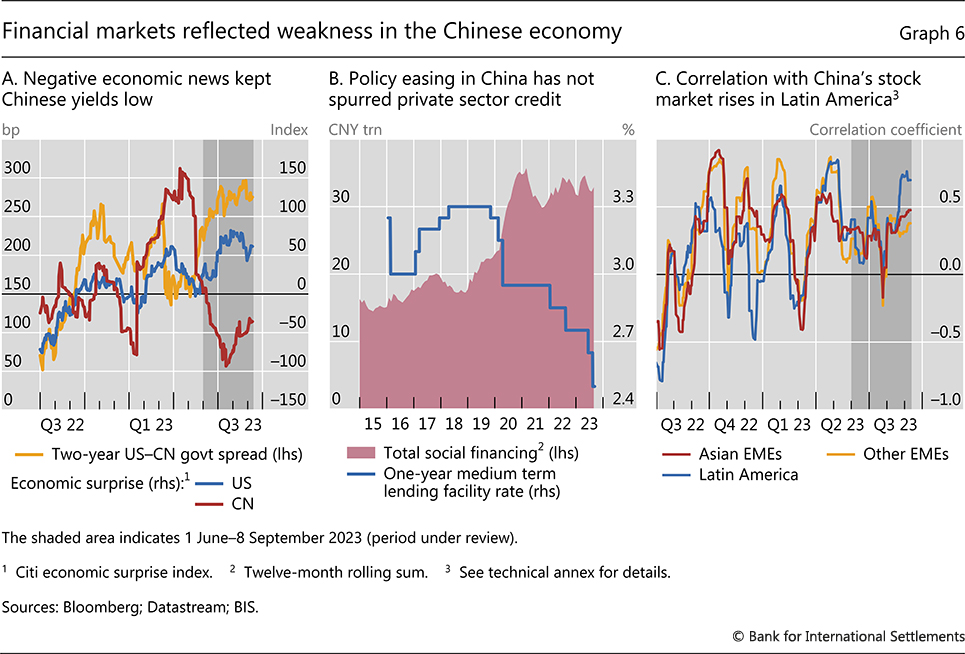
Financial markets reflected China's slowdown. As negative economic surprises piled up during the review period in China, in contrast to the positive surprises in the United States (Graph 6.A, red and blue line, respectively), the respective policy stances diverged. While the Federal Reserve steadily tightened policy during the last two years, the People's Bank of China continued to ease to stimulate credit growth and the economy (Graph 6.B, blue line). Accordingly, the spread between the US and China's two-year government yield widened (yellow line). Despite the easing, growth of credit to the private sector in China was sluggish (red area), and a sustained economic recovery following the lifting of pandemic restrictions failed to materialise.
Investors appeared increasingly concerned about the prospects of global spillovers, should the outlook for China continue to deteriorate. The relatively modest performance of some AE stock markets, as seen above, was one manifestation of that anxiety. In EMEs, correlations with China equities were high during the period under review and rose markedly for Latin American stocks (Graph 6.C). The latter may reflect concerns about the decline in China's demand for commodities, which represent a large share of the region's exports.
Sovereign bond yields reflected the different stages of the respective policy rate cycles across EME regions. Yields on two-year government bonds declined steadily in Latin America and the Europe, Middle East and Africa (EMEA) regions (Graph 7.A). This stemmed from perceptions that the general monetary policy stance in Latin America was poised to reverse, after steep rate hikes in the past two years. Indeed, the central banks of Brazil and Chile cut policy rates during the review period, with investors expecting the central banks of Colombia and Mexico to follow suit soon, as inflation continued to fall in the region. By contrast, two-year yields in Asian EMEs rose somewhat, even as most central banks in the region put rate hikes on hold. Ostensibly, investors perceived moderate upside risks to inflation.
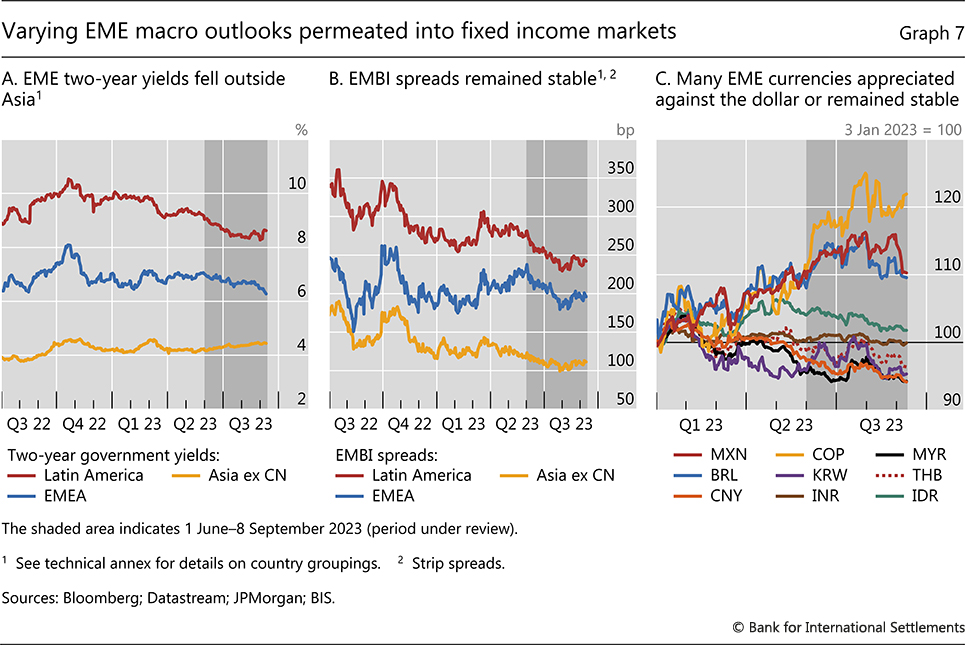
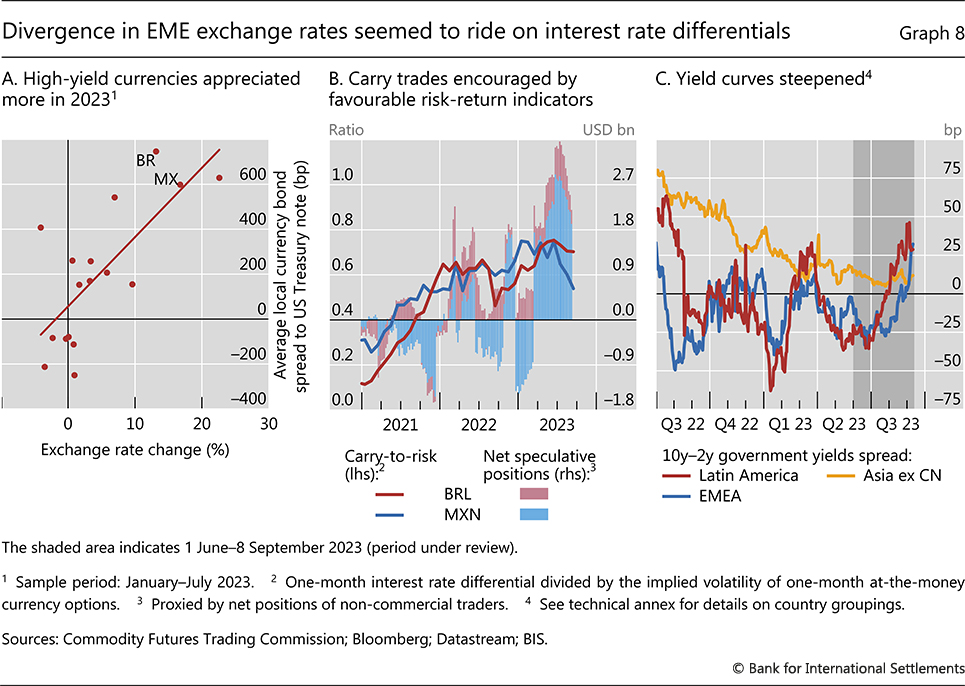
Foreign investor appetite for EME risk did not wane. Sovereign spreads on US dollar-denominated debt compressed further (Graph 7.B), while the exchange rates of major EMEs either appreciated or held steady (Graph 7.C). Since the beginning of the year, currencies with higher local government bond yields vis-à-vis the comparable US Treasury appreciated further (Graph 8.A). In particular, Latin American currencies, such as the Brazilian real and Mexican peso, appreciated materially against the US dollar. Favourable carry-to-risk ratios provided significant incentives for carry trades (Graph 8.B).
EME spreads and currency markets were sensitive to the temporary bout of de-risking in AE financial markets in early August. Long-term yields in Latin American government bond markets rose and their yield curves steepened (Graph 8.C). In addition, the appreciation of Latin American currencies came to a halt, as carry-to-risk ratios declined and some speculative positions were unwound. Sovereign spreads on US-dollar denominated debt also widened somewhat since August in both Latin America and in EMEA.
Technical annex
Graph 2.C: Based on standardised dollar exchange rates (z-scores) against AUD, CAD, CNY, CZK, EUR, GBP, HUF, INR, JPY, KRW, NOK, SEK and ZAR, calculated over the period 3 January 2022–8 September 2023. The index is equal to 100 plus the z-score.
Graph 6.C: Thirty-day moving correlation between log changes of country-level equity index and log change of the Shanghai composite index, averages across countries within the region indicated.
Graph 7.A: Latin America: simple average of BR, CL, CO, MX and PE. Asia ex CN: simple average of ID, IN, KR, MY, PH, TH and SG. EMEA: simple average of CZ, HU, IL, PL and ZA.
Graph 7.B: Latin America: simple average of BR, CL, CO, MX and PE. Asia ex CN: simple average of ID, IN, MY and PH. EMEA: simple average of HU, PL, SA and ZA.
Graph 8.C: Latin America: simple average of BR, CL, CO, MX and PE. Asia ex CN: simple average of ID, IN, KR, MY, PH, TH and SG. EMEA: simple average of CZ, HU, IL, PL and ZA.
1 The period under review extends from 1 June through 8 September 2023.