Global supply chain interdependence and shock amplification - evidence from Covid lockdowns

Supply disruptions from the Covid-19 pandemic raised questions about the benefits and costs of global value chain (GVC) participation. We use granular data to document the evolution of GVC firm-level linkages in the aftermath of the Covid-19 outbreak and study how they might have affected equity investors' reaction to pandemic-related disruptions. We find that the number of GVC linkages generally declined and was slow to recover for some sectors after the Covid-19 shock but that the volume of the resilient linkages helped to cushion production disruptions. Firms with GVC links to countries undergoing Covid-related lockdowns suffered larger stock price losses than those without such links.1
JEL classification: F10, G12, G14, O24.
A rich literature has analysed the trade-offs from participation in global value chains (GVCs), the organisation of production processes, trade and investment across different locations to optimise production. The findings suggest that GVC participation propagates and amplifies risks (Zhang (2021), Huang et al (2022), Mohommad et al (2022)), but could reduce production costs and improve economies' resilience (Ando and Hayakawa (2022), Barrot and Sauvgnat (2016), Kashiwagi et al (2021)). Less frequently discussed is GVC participation at the firm level, and in particular how stock market investors assess GVC linkages in the face of global shocks.
We draw insights from firm-level data to study the evolution of GVCs over several quarters after the Covid-19 outbreak and the role of GVC participation in firms' stock market performance at the time of the outbreak. We find that declines in the number of cross-border linkages were still evident two years after the onset of the pandemic but a rise in the volume of the remaining linkages helped cushion the fallout. Furthermore, our empirical analysis suggests that firms' GVC participation played a role in stock market investors' trading decisions at the start of Covid-induced disruptions. The cumulative returns on firms linked to countries in lockdown declined by 1.5 percentage points more over a week than the returns on other firms, a magnitude similar to the typical volatility of returns in normal times.
Key takeaways
- Firm-level data reveal that the number of global value chain (GVC) linkages were slow to recover in some sectors after the Covid-19 shock but greater volumes at resilient linkages cushioned production disruptions.
- Stock market participants seem to pay attention to GVCs, as share prices declined significantly more after Covid-19 lockdown announcements if firms had GVC links to affected countries.
Examining specific periods in the aftermath of the Covid-19 outbreak, the rest of this article is organised as follows. The first section examines granular data on customer-supplier interlinkages from a sample of global firms as well as data on maritime shipments to the United States. The second section assesses equity investors' sensitivities to firms' GVC linkages. The last section concludes.
GVC trends during the pandemic – stylised facts
We rely on information from two data sets to gauge firm-level GVC interlinkages. The first, from S&P's Capital IQ, provides global snapshots of interfirm business linkages reported within the preceding two years. These snapshots help identify firms' customers and suppliers. The second data set consists of US maritime shipment information (also known as bills of lading (BoL)) from the US Census Bureau.2 BoL data typically comprise the company names for both the shipper (ie supplier, exporter or freight forwarder) and consignee (ie the importer, or firm receiving the final merchandise delivery) as well as shipment details (eg volume of trade and product description). While the former data set offers a global coverage of linkages, the latter reveals the intensity of each included linkage, measured by the volume of the shipment quantities.
To examine how GVCs evolved during the pandemic, we first compare two snapshots, building on the work in Zhang (2021) (Graph 1). Firms are depicted by nodes, the size of which is proportional to a firm's importance in the overall network, with more connected nodes taking on larger sizes.3 Customer-supplier relationships are represented by the edges – ie connecting lines – between two nodes. Node colours correspond to the region of the firm's primary location,4 while edge colours correspond to the region where the supplying firm is located. The network maps are structured so that nodes sharing more connections are placed closer together.
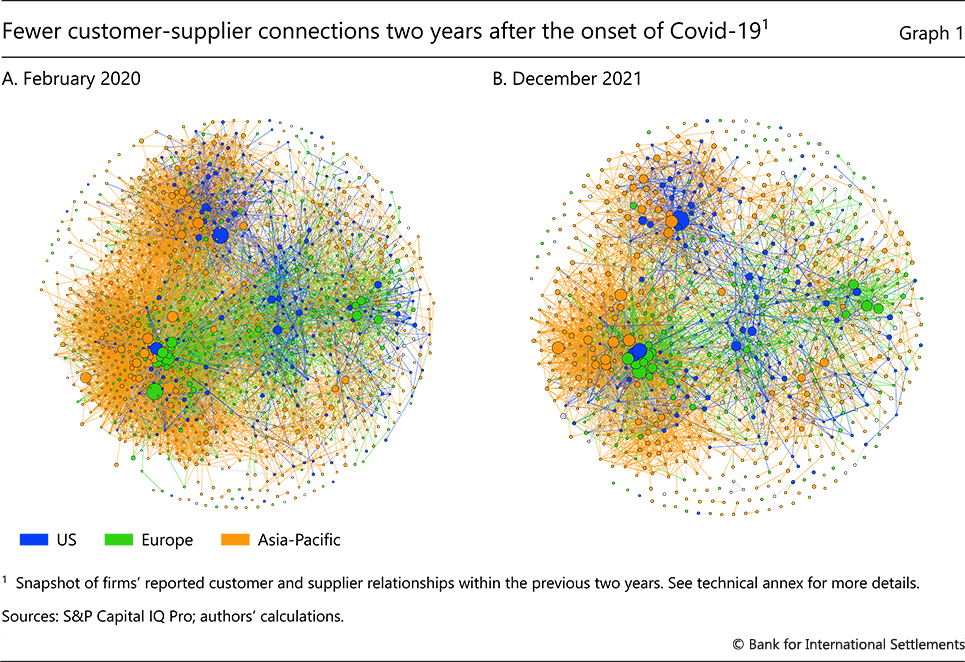
The comparison reveals that GVC networks had yet to fully recover by December 2021. Customer-supplier networks appeared less interconnected, as shown by the less dense patches and the presence of more empty space (Graph 1.B). Indeed, the number of linkages in the sample fell by around 30% over the two-year period.
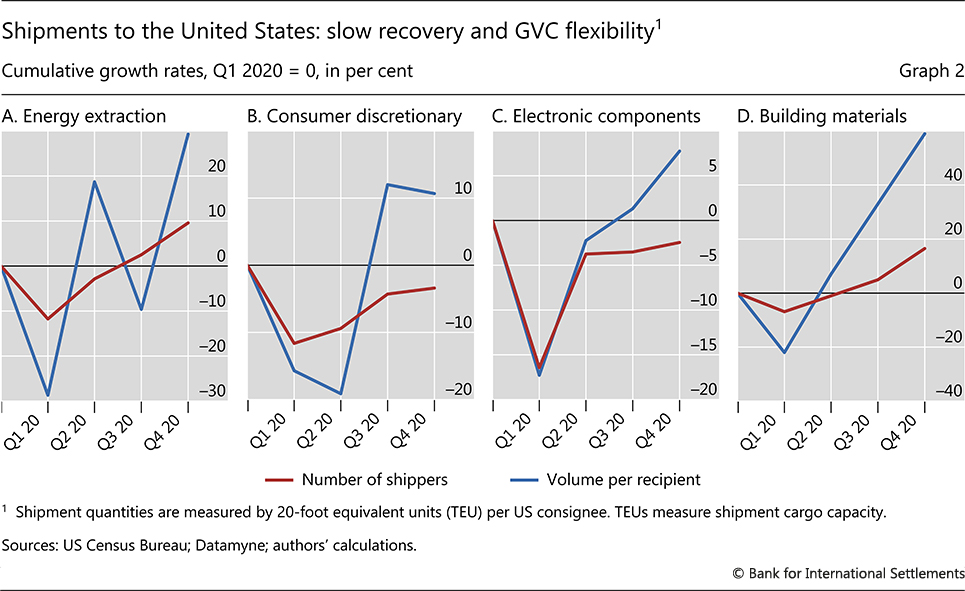
Zooming in on the number of maritime shippers with links to firms in the United States and the intensity of these links – ie the volume of shipments – paints a more nuanced picture of the GVC evolution in the first year of the pandemic. After a broad-based drop in the number of shippers in the first quarter of 2020, the recovery along this dimension proceeded at a different pace across sectors (Graph 2, red lines). By the end of 2020, 38% of the US recipient sectors – including energy extraction and building materials – saw the number of their maritime shippers return to or exceed its pre-pandemic level. A drag on the general recovery came from sectors hardest hit by the pandemic, such as consumer discretion and electronic components (Graphs 2.B and 2.C). At the same time, nearly half of the sectors saw large rebounds in shipment quantity from resilient suppliers. Expanded production by these suppliers helped cushion production disruptions.
Equity market sensitivity to GVC linkages
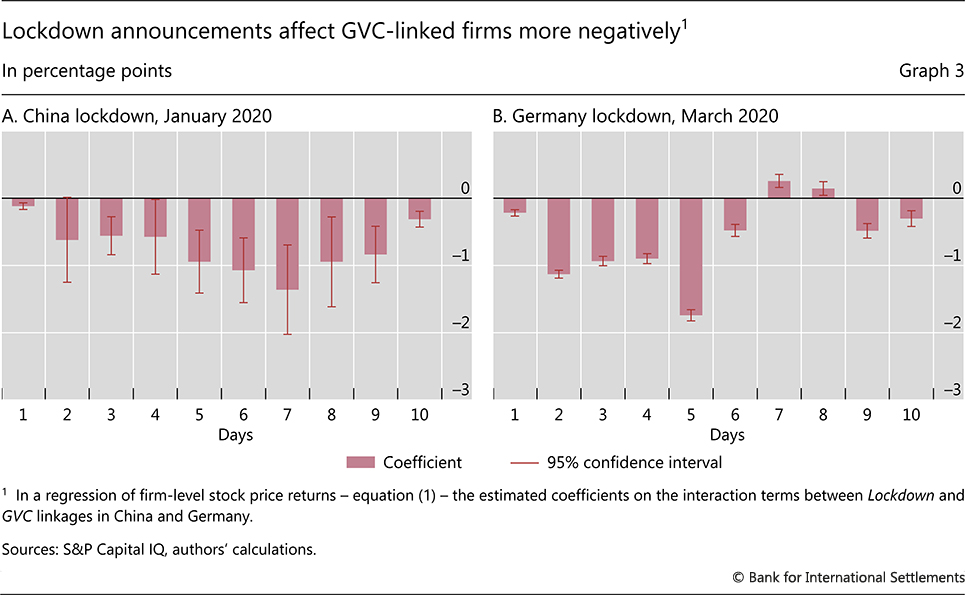
To assess the effect of GVC linkages on firms' equity prices, we use an event study framework. The events in focus are lockdown announcements in two significant players in the global GVC network: China and Germany (World Trade Organization (2021)). These events represent exogeneous shocks to the state of GVCs as they took place before broad-based supply disruptions became evident and hence before markets, firms and the public at large started anticipating these disruptions' fallout. The announcements were also not confounded initially by similar concurrent events in other parts of the world.
Further reading:
We focus on a global set of listed firms with supply chain linkages in Capital IQ at the beginning of 2020. We use the daily equity returns for these firms from 1 January 2019 to 17 April 2020 – a period that covers stock market performance both before and during the pandemic. To study cross-border effects of GVCs, we consider the share prices only of firms with linkages to China and Germany but exclude those headquartered in these countries. We estimate the following panel regression:

first for China's and separately for Germany's lockdowns and linkages. We estimate versions of this equation that differ as regards the period underpinning flow variables.
Baseline version. Return푖,푡 represents the daily percentage change in firm i's closing equity price.5 The dummy variable Lockdown equals 1 on the days of the relevant announcements: for China, these are 23 and 27 January 2020 (announcements of the Wuhan lockdown and an extension of the nationwide lunar new year holiday, respectively); for Germany, it is 16 March 2020 (border closure).6 The other 0/1 dummy variable, GVC, represents firms' linkages with China or Germany in early 2020 (henceforth, "connected" firms). The variable MarketReturn is the return on the broad equity index in the country where a firm is listed. By controlling for co-movements between individual stock prices and benchmark indices, we capture abnormal movements in the former. Finally, αi and μt represent firm and time fixed effects, respectively.7
Cumulative returns. To study stock market reactions over longer periods, we calculate the flow variables over these periods. We change the definition of the time fixed effect and the lockdown dummies accordingly, considering now only the first of the two China announcements. We employ local projections in this context.
The coefficients of interest are δCN and δDE. They capture the extent to which the share price adjustment after a lockdown announcement differs between connected and unconnected firms.
We find that stock market participants interpreted lockdown announcements as worse news for firms with GVC links to the affected country. After a muted differentiation on the announcement day, the equity prices of these firms declined by about 1.5 percentage points more in the course of a week than those of their unconnected peers (Graph 3). In addition to being statistically significant, this difference is economically meaningful, as the median standard deviation of equity returns across firms in our sample is equal to 2.5% in 2019. The differentiation between firms with GVC connections to China or Germany and other firms eventually dissipated, as the increasingly global nature of the Covid pandemic became apparent.
Conclusion
This article has sought to draw insights from complex GVC networks. Using data on customer and supplier connections following the outbreak of Covid-19, we track the evolution of GVC networks both at the global and the sector levels. In addition, our econometric analysis shows that GVC links can amplify the adverse effect of pandemic-related shocks on company share prices. Such effects underscore that stock market investors pay attention to GVCs. Further research could seek to verify the representativeness of our results by considering other episodes with large exogenous shocks.
References
Ando, M and K Hayakawa (2022): "Does the import diversity of inputs mitigate the negative impact of Covid19 on global value chains?", The Journal of International Trade & Economic Development, vol 31, no 2, pp 299–320.
Barrot, J N and J Sauvgnat (2016): "Input specificity and the propagation of idiosyncratic shocks in production networks", The Quarterly Journal of Economics, vol 131, no 3, pp 1543–92.
Huang, Y, C Lin, S Liu and H Tang (2022): "Trade networks and firm value: evidence from the US-China trade war", CEPR Discussion Papers, no 14173
Mohommad, A, T Lan and D Malacrino (2022): "Global trade and value chains in the pandemic", IMF World Economic Outlook, April.
Kashiwagi, Y, Y Todo and P Matous (2021): "Propagation of economic shocks through global supply chains: evidence from Hurricane Sandy", Review of International Economics, vol 29, no 5, pp 1186–220.
World Trade Organization (2021): "Beyond production", Global value chain development report 2021, November.
Zhang, S Y (2021): "Using equity market reactions and network analysis to infer global supply chain interdependences in the context of Covid-19", Journal of Economics and Business, vol 115.
Technical annex
Graph 1: Data cover around 34,000 companies and are part of S&P's Capital IQ. To cross-check these data, we compare them with bill of lading data from Datamyne. The latter comprise information about 456,453 shipments to US consignees in 2020. We establish an 80% overlap between the two data sets for US-based firms that have business relationships with China and/or Germany.
Graph 3: Firms from the data behind Graph 1 that are publicly listed: 21,340 worldwide. Of these, 6,756 (32%) are customers of and/or suppliers to Chinese firms, and 6,127 (29%) are customers of and/or suppliers to German firms.
1 The authors thank Ryan Banerjee, Claudio Borio, Stijn Claessens, Jon Frost, Hyun Song Shin, Nikola Tarashev and Egon Zakrajšek for helpful comments and discussions, and Jimmy Shek and Ronald Yip (HKMA) for excellent research assistance. The views expressed are those of the authors and do not necessarily reflect those of the Bank for International Settlements or the Hong Kong Monetary Authority.
2 BoL data used in this analysis were compiled by Datamyne. We focus on the United States because of its central role in GVC networks and the availability of high-quality shipment information.
3 We measure importance with "network centrality", which is determined by a node's number of connections (ie edges) and the connections of its counterparties.
4 "Primary location" refers to firms" national headquarters where most, if not all, of the functions are coordinated. This need not be the same as the headquarters of the ultimate parent company.
5 In a robustness check, we replace the dependent variable with "abnormal return" – ie, deviation from the market return. The results remain qualitatively similar.
6 We also include 0/1 additive dummy variables for: China's announcement on 20 January that the Covid virus was transmissible among humans; the World Health Organization announcement on 11 March that Covid was a global pandemic, and the Federal Reserve's large-scale intervention on 17 March to stabilise financial markets. All these variables are statistically insignificant.
7 The firm and time fixed effects absorb the additive GVC linkage and lockdown dummy variables. We take into account the time zone differences among stock exchanges.