Markets send mixed signals

BIS Quarterly Review  |  September 2021  | 
20 September 2021
PDF full text
 (267kb)
 |  14 pages

Risky asset and sovereign bond markets seemed to send mixed signals during the period under review.1 Equity indices rose further globally, with emerging market economy (EME) stocks climbing in September. In conjunction with corporate spreads remaining extremely compressed, this underpinned exceptionally accommodative financial conditions in many jurisdictions. In sharp contrast, government bond yields declined steeply in advanced economies (AEs), even as the expected monetary policy stance tightened somewhat, thus hinting at a certain degree of investor unease about the economic outlook further down the road. Concurrently, the US dollar started appreciating, conceding some ground only later in the quarter.

Stock markets reflected cross-country differences in the strength of the recovery. Improvements in expected earnings boosted AE benchmarks. At the same time, an elevated cost of insurance against large drops in stock prices suggested a rise in investors' concerns about tail risk. A weakening of growth prospects and a tightening of regulatory measures drove a fall in Chinese equities for most of the review period, before a more recent recovery.

In corporate credit, risk appetite remained strong. Spreads stayed very tight by historical standards, although they widened noticeably but temporarily for the lowest-rated firms. Issuance was robust, especially for US high-yield borrowers.

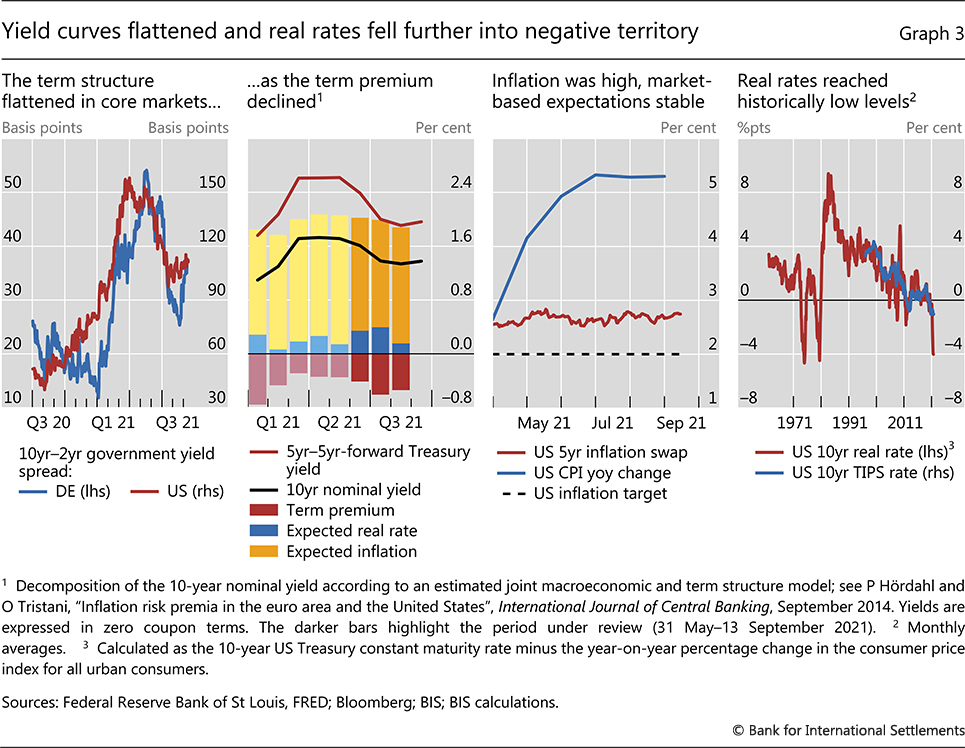
Yield curves flattened in AEs. Following decade-high inflation readings, market-based expectations of future US policy rates rose, supporting the short end of the curve. Somewhat surprisingly, the long end fell sharply. The jury is still out on the underlying drivers. They probably have to do with government bond purchases by central banks and selected non-US investors, the unwinding of leveraged positions and perceived risks to the economic outlook.

EMEs continued to face challenges on various fronts. Besides uncertainty about the evolution of the Covid-19 pandemic, two issues stood out. First, rising expected policy rates in the United States blunted the traditionally positive effect of falling long-term US yields on portfolio flows. Second, investors were concerned about country-specific developments, including a softening growth outlook in China – where sovereign yields fell as a result – and high inflation readings in many jurisdictions – notably in Latin America, where currencies weakened markedly against the US dollar.

Key takeaways

  • The mood in advanced economies' equity and corporate credit markets continued to be upbeat but government bond yields declined, even as investors perceived an increased likelihood of monetary policy tightening.
  • Financial conditions remained extremely accommodative, especially in the United States.
  • Challenges to emerging market economies surfaced as currency weakness and portfolio outflows despite declining long-term US yields.

Equity markets proved resilient in AEs, although perceived tail risks increased. In the euro area, and especially in the United States, stock indices continued their upward trend on the back of brisk expected earnings growth (Graph 1, first and second panels). However, investors appeared concerned about several developments, including the prospect of less forceful US fiscal stimulus, the lingering effects of the pandemic on the services sector and persistent supply chain disruptions in manufacturing. As a result, even though option-implied volatility remained range-bound, a common market-based indicator of tail risk – reflecting the prices of options that provide a hedge against large equity declines – spiked to an all-time high during the review period (third panel).

Equity investors remained untroubled as perceived downside risk picked up

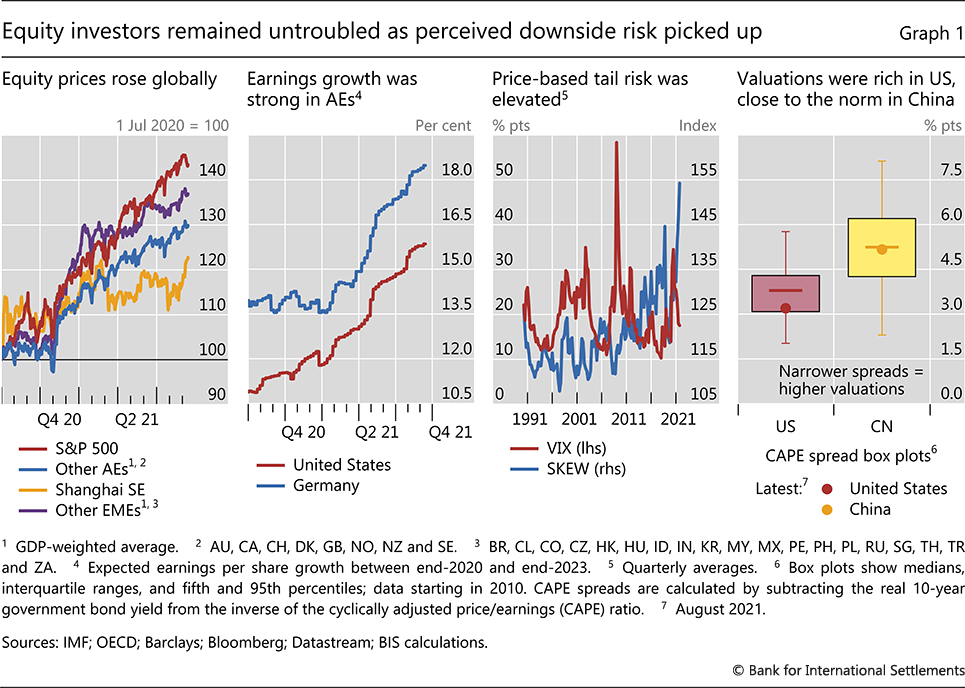
The pandemic shaped stock market developments in EMEs, too. In China, the main index declined slightly early in the review period, as economic activity slowed, but posted gains overall owing to a surge in September. Besides a withdrawal of support measures, regulatory actions weighed on the country's large technology sector. In other EMEs, equity prices moved sideways before following AE benchmarks higher, buffeted by the cross-currents generated by strong export demand and by restrictions aimed at fighting the resurgent virus.

Stock valuations were quite rich in some jurisdictions and sectors. In the United States, they were above historical benchmarks even after accounting for very low interest rates (Graph 1, fourth panel). In China, they were close to their long-run norm. In general, valuations were particularly elevated in growth-oriented industries, such as technology, and in fast-developing market segments related to sustainable investing (Box A).

Market buoyancy was also visible in rising house prices. The pace of appreciation was strong in AEs, particularly in the United States. Monthly US housing price increases above 2% – exceptionally high in recent history – went hand in hand with shrinking available-for-sale inventories.

The corporate bond market signalled very easy credit conditions. Spreads did inch up early in the review period, but they narrowed again and remained well below historical medians in the euro area and the United States (Graph 2, left-hand panel). In parallel, third quarter issuance was resilient, especially in the US high-yield segment (centre panel). Once the growing volume of leveraged loans is factored in, credit to the riskiest US firms stood at $3 trillion in mid-2021, double the size in 2010.

Corporate credit markets remained buoyant, financial conditions accommodative

Box A

Sustainable finance: trends, valuations and exposures

Sirio Aramonte and Anna Zabaiicon

Demand for investment products classified as delivering environmental, social and governance (ESG) benefits is booming. The growth of the overall ESG market rides mostly on investors' focus on environmental considerations, particularly in fixed income markets.icon Both the general public and policymakers have encouraged market participants to support the transition to a low-carbon economy. At the same time, given the very fast growth of the new asset class, there are questions about the possibility that a bubble might develop unless market transparency can be ensured.icon Could a fundamentally welcome development – helping to finance the transition to a low-carbon world – generate significant financial imbalances? This box documents the pace of growth of ESG assets over recent years, considers their valuations, provides some indications of the size of investors' exposures, and sketches policy considerations relevant for the nascent regulatory framework.

While growth in ESG assets shows no signs of abating, lack of standardisation and the ensuing classification issues make it difficult to pin down precise amounts.icon One set of industry estimates relies on a broad definition that includes various approaches to integrating ESG criteria as well as "thematic", "impact" and "community" investing.icon On this basis, some estimates indicate that ESG assets rose by nearly one third between 2016 and 2020 to $35 trillion, or no less than 36% of total professionally managed assets.icon Another set of estimates – based on a narrower definition and including only mutual funds and exchange-traded funds (ETFs) that self-report as having ESG or socially responsible investment (SRI) mandates – shows even faster growth but at lower levels (Graph A1, left-hand panel). The assets managed by these funds have soared over the past five years, more than tenfold, and now stand at approximately $2 trillion. ESG/SRI equity funds account for about 3% of total mutual fund and ETF assets under management, and ESG/SRI bond funds for about 1%.

Sustainable finance's growth prompts parallels with past market developments

Limited disclosure requirements result in an incomplete picture of which investors hold ESG assets, especially equity instruments. Current holdings of bonds with proceeds earmarked for environmental or social projects (ie bonds labelled as green, social or sustainable according to the International Capital Markets Association criteria) seem to amount to a small share of key financial intermediaries' balance sheets. They represent only about 1% of total bond portfolios for both US insurance companies and European banks (ECB, 2020).icon US pension funds stand out, with green bond holdings growing rapidly since 2017 and comprising about 4% of their current corporate credit exposure. By contrast, survey evidence indicates that these shares could be lower for hedge funds, as they lag behind other institutional investors in integrating ESG principles into their investment process.icon That said, bond holdings underestimate ultimate exposures, which would include stocks and other asset classes such as private equity, where ESG considerations are also increasingly relevant.

Historical lessons from the investment volume and price dynamics in rapidly growing asset classes could be relevant for ESG securities. Assets related to fundamental economic and social changes tend to undergo large price corrections after an initial investment boom. Railroad stocks in the mid-1800s, internet stocks during the dotcom bubble and mortgage-backed securities (MBS) in the Great Financial Crisis (GFC) are cases in point. It is thus noteworthy that the pre-GFC growth and size of the private label MBS market are comparable with those recently observed for ESG mutual funds and ETFs (Graph A1, centre vs left-hand panel).

There are signs that ESG assets' valuations may be stretched, although the available evidence stems from segments that are of indirect concern from a financial stability perspective. Even after a decline from their peak in January 2021, price-to-earnings ratios for clean energy companies are still well above those of already richly valued growth stocks (Graph A1, right-hand panel). Rich valuations in credit markets would be more relevant for assessing possible risks of financial distress, given the potential for defaults. More analysis would be needed to evaluate this possibility, including by estimating the size of any "greenium" or "socium" – ie the lower premium that market participants require for bearing financial risk when their investments support environmental or social causes – as it could signal market overheating.icon

These considerations suggest that it is worth closely monitoring developments in the ESG market. If the market continues to grow at the current pace, and more elaborate instruments emerge (eg structured products), it will be important not only to assess the benefits of financing the transition to a low-carbon world, but also to identify and manage the financial risks that might arise from a shift in investors' portfolios. The widespread search for yield that has been under way in financial markets adds to the usefulness of such an exercise. Proceeding in this direction would involve the collection of adequate data on holders and exposures, with special attention to those that are leveraged and may reside in the less transparent segments of the financial system. In turn, all this puts a premium on adequate disclosure and reporting arrangements, including more reliable taxonomies.

iconThe views expressed are those of the authors and do not necessarily reflect the views of the BIS. iconIMF, "Sustainable finance", Global Financial Stability Report, October 2019. icon A Carstens, "Transparency and market integrity in green finance", speech at the 2021 BIS Green Swan Conference, 2 June 2021. iconF Berg, J Florian and R Rigobon, "Aggregate confusion: the divergence of ESG ratings", MIT Sloan Working Paper, 2020.iconAccording to the Global Sustainable Investment Alliance (GSIA), thematic investing seeks exposure to sectors which will benefit from a greater focus on sustainability, such as efficient transportation. Impact investing finances specific projects that target environmental and/or social impacts. Community investing directs capital to traditionally underserved individuals or communities. See GSIA, Global Sustainable Investment Review 2020, 2021. iconGSIA, ibid. icon We use the BIS Sustainable Bonds Database to identify the green, social and sustainable bonds that are in the Refinitiv eMaxx database and are held by US insurance companies and corporate pension funds. Around 90% of these are green bonds. Data on euro area banks are from M Belloni, M Giuzio, S Kördel, P Radulova, D Salakhova and F Wicknig, "The performance and resilience of green finance instruments: ESG funds and green bonds", ECB Financial Stability Review, November 2020. iconbfinance, ESG asset owner survey: how are investors changing?, February 2021. iconFor a discussion and references, see D Larcker and E Watts, "Where's the greenium?", Journal of Accounting and Economics, vol 69, issues 2–3, 2020. For the greenium on German green bonds, see L Pastor, R Stambaugh and L Taylor, "Dissecting green returns", CEPR Discussion Paper, no 16260, 2021.

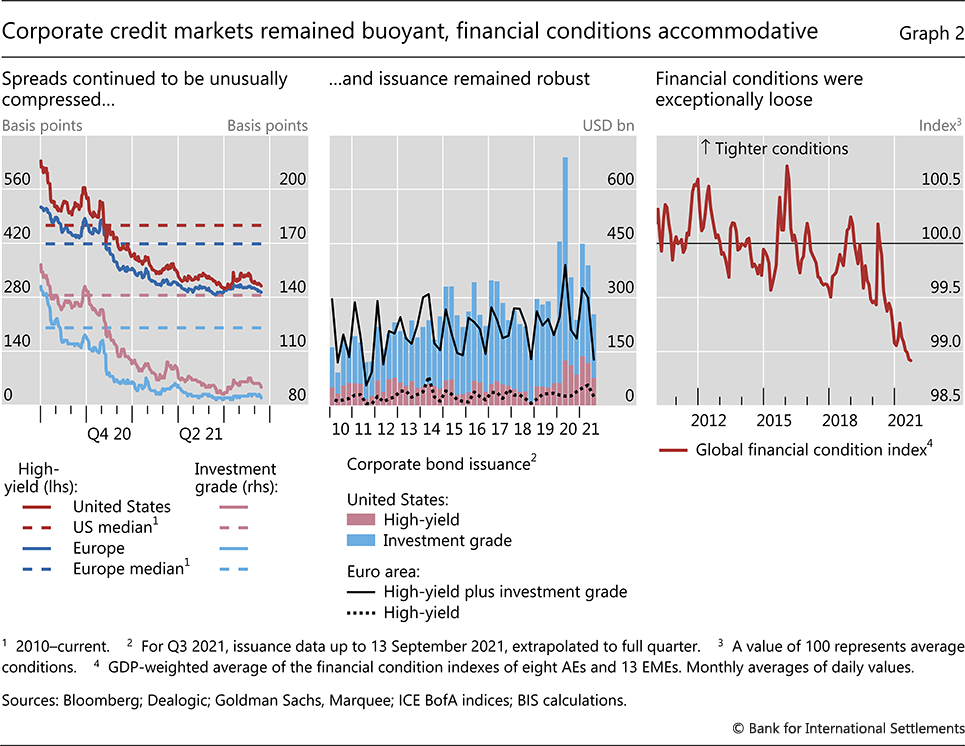
While commonly used measures indicated that global conditions were at their loosest since the Great Financial Crisis (Graph 2, right-hand panel), there were some notable cross-country differences. In particular, the progressive loosening in the United States mainly reflected the long-lived strength of equity markets. China, where declining equity valuations and trade-weighted exchange rate appreciation contributed to tight conditions, stood out from the global picture. Other EMEs also faced certain headwinds (see below).

In the period under review, yield curves in AEs flattened significantly. By August, about half of the steepening that had taken place earlier in the year had reversed, both in Europe and the United States (Graph 3, first panel). These dynamics reflected an increase in front-end sovereign yields, but mostly a remarkable fall in longer-term ones. This decrease reflected perceptions that extend beyond the five-year horizon, as implied forward rates dropped in line with declines in estimated term premia (second panel). Yields fell in many AEs, including those that had made progress towards scaling back asset purchases, such as Australia and Canada.

In the United States, the evolution of nominal yields resulted in record low real interest rates. During the period under review, long-term market-based measures of inflation expectations remained stable, while realised inflation was consistently high (Graph 3, third panel). As a result, the fall in long-term nominal yields drove real rates into negative territory, to levels last seen during the Great Inflation era (fourth panel).

While actual or anticipated central bank actions underpinned near-term rates, there is no such clarity as regards the key drivers of long-term yields.

Yield curves  flattened  and real rates fell further into negative territory

Two developments supported short-term rates. First and foremost, there was an increase in expected policy rates. The perceived likelihood of a monetary policy tightening rose (Graph 4, left-hand panel), following higher than anticipated inflation releases (centre panel, first two red columns). Second, technical factors were also at work. After the Federal Reserve raised the interest rate paid on its overnight reverse repo facility (RRP) and eased participation limits, money market mutual funds2 placed cash previously allocated to Treasury bills in the RRP, thus relieving downward pressure on front-end yields (right-hand panel).

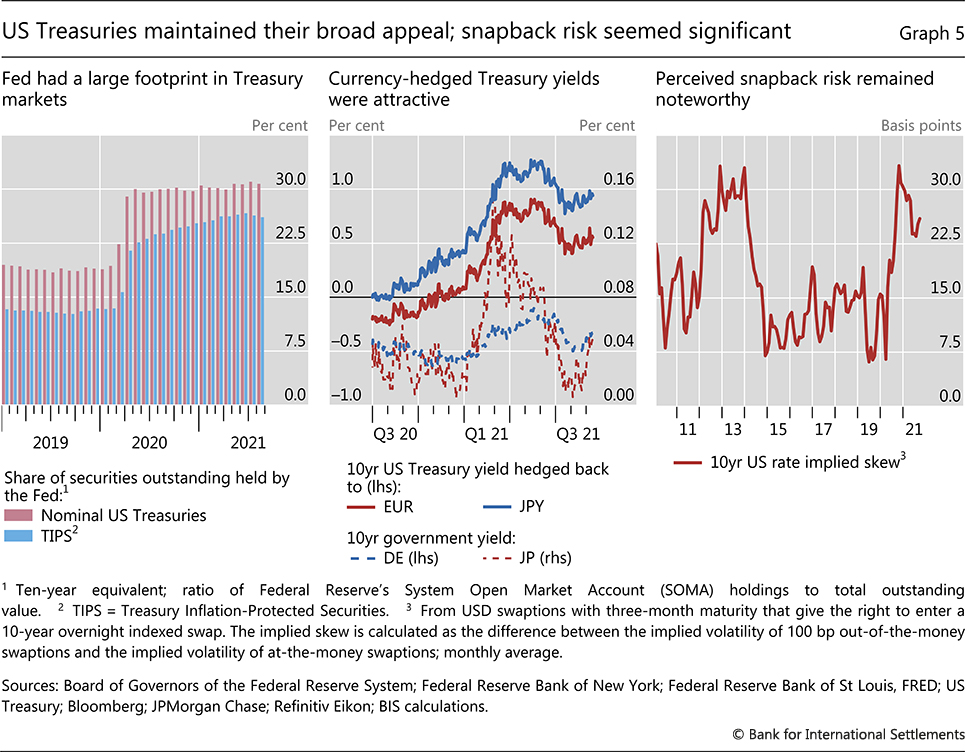
Long-term US sovereign yields fell against the backdrop of large purchases by the Federal Reserve and certain private investors. The US central bank kept its substantial footprint in the markets for nominal and inflation-protected Treasuries (Graph 5, left-hand panel). In addition, yields on US sovereign bonds continued to entice foreign investors, notably those hedging their US dollar exposures into Japanese yen and euros (centre panel). And leveraged institutions reportedly unwound large short Treasury positions – de facto wrong-footed bets on rising rates.

US yields responded to a variety of factors

Box B

Stress in European money market funds at the outbreak of the pandemic

Fernando Avalos and Dora Xiaicon

European money market funds (EMMFs) were not immune to the acute stress that rocked their US counterparts in March 2020.icon In several respects, the European developments echoed those in the United States. This box reviews the dynamics of EMMF outflows in the light of the US experience, including the role played by investors of different sizes and the importance of funds' liquidity.

EMMFs can be classified into three main groups: (i) constant net asset value (CNAV); (ii) low-volatility NAV (LVNAV); and (iii) variable NAV (VNAV). While CNAV funds price their portfolios at amortised nominal value, VNAV funds price them at market value. LVNAV funds stand in between: they normally price their portfolios like CNAV funds but must convert into VNAV funds if the volatility of their portfolios' market value exceeds certain thresholds. LVNAV and VNAV funds represent about 90% of EMMFs' overall assets under management (AUM), and they are mainly denominated in US dollars and euros, respectively (Graph B1, left-hand and centre panels, stacked bars). CNAV funds account for the remaining 10% of AUM and are almost entirely denominated in dollars.

Stress buffeted dollar LVNAV and euro VNAV money market funds

The most stressed EMMFs, dollar-denominated LVNAV and euro-denominated VNAV funds, held predominantly non-government securities and had a similar experience to their US counterparts, prime institutional funds. A substantial share of these funds' assets consists of banks' commercial paper and certificates of deposit and, to a lesser extent, short-term debt of non-financial firms (Graph B1, right-hand panel). At the peak of the stress, the dollar LVNAV funds lost almost 30% of their February 2020 AUM (left-hand panel, blue line), representing almost $90 billion. In the euro-denominated segment, the losses of the VNAV funds by the end of March were higher than 15% of pre-stress AUM (centre panel, yellow line), or more than €50 billion. EMMF outflows started broadly at the same time as those in US prime MMFs (left-hand and centre panels, shaded areas). However, while outflows from US prime MMFs ebbed after the Federal Reserve introduced the Money Market Fund Liquidity Facility (MMLF) in late March 2020 (vertical lines), withdrawals from dollar-denominated EMMFs persisted through the end of the month.icon That probably reflected the fact that the Federal Reserve's liquidity support did not extend to EMMFs. In addition, redemptions continued to trickle out of euro VNAV funds through end-March and until mid-April, as the ECB's new Pandemic Emergency Purchase Programme (PEPP) was picking up momentum.icon

As investors shifted away from riskier assets, MMFs investing mostly in government securities – CNAV funds in Europe, similar to government funds in the United States – received large inflows. While dollar CNAV funds gained more than 65% of their pre-Covid balances, this was still about $15 billion less than the outflows from other dollar-denominated EMMFs. Similarly, outflows from euro VNAV funds were only minimally captured by euro CNAVs or other euro-denominated EMMFs. All this suggests that a significant portion of EMMF losses may have turned into euro area overnight bank deposits, which saw unusual inflows of about €200 billion in March 2020, and possibly also flowed into US government MMFs, whose AUMs expanded much more than US prime MMFs contracted.

Did funds' investor size and liquidity positions play a role in EMMFs' experience, as was the case for US MMFs? We focus on dollar LVNAV and euro VNAV funds, the two types of EMMFs most affected by the stress, and partition the funds of each type into four groups using two criteria. First, we distinguish funds populated by large or small investors. We do this based on the funds' expense ratio – a common approach in the academic literature. The underlying idea is that MMFs catering to larger investors usually require larger minimum investments, and consequently tend to have lower expense ratios.icon Second, we differentiate high- from low-liquidity funds, using the portfolio share of their liquid assets in the last week of February 2020. Crossing the two features, we obtain four groups of funds, for which we document the flows in March and April 2020.icon

The role of investor size and funds' liquidity during the March 2020 stress

Large investors spearheaded the withdrawals from both European dollar LVNAV funds and US prime funds, although the main players were non-financial corporates in Europe and financial institutions in the United States. By end-March, EMMF withdrawals by large investors exceeded those by smaller investors by about 10% of the pre-shock AUM, irrespective of the funds' underlying liquidity conditions (Graph B2, left-hand panel). Non-financial institutions withdrew more than financial institutions from Luxembourg- and Ireland-domiciled funds.icon In fact, non-financial investors' redemptions represented between 35 and 53% of their holdings, as opposed to 19 to 22% of financial institutions' holdings (centre panel). This suggests that European outflows were mainly driven by precautionary motives – eg corporate treasurers securing dollar cash balances – in contrast to the need to cover margin calls by financial institutions in the United States.icon

In April, the recovery of both European dollar LVNAV and US prime funds were led by small investors, although their liquidity preferences differed across jurisdictions: high-liquidity in Europe and low-liquidity in the United States. In Europe, high-liquidity funds with small investors saw a reversal of their entire March outflows by end-April (Graph B2, left-hand panel, dashed blue line). In the United States, by contrast, low-liquidity prime MMFs were the main recipients of inflows when small investors returned.icon Low-liquidity EMMFs recorded a relatively tepid recovery, with little regard for their typical investor's size (solid and dashed red lines). A possible reason is that, as already noted, dollar-denominated European funds did not benefit from the backing of the Federal Reserve's MMLF programme.

Turning to euro VNAV funds, large investors again spearheaded withdrawals, generally from less liquid funds, while small investors were quicker to return after the turmoil. Funds mostly serving large investors recorded withdrawals of between 20% (low liquidity) and 15% (high liquidity) of their pre-Covid AUM in March. At the same time, funds with small investors saw redemption of less than 10% of pre-shock AUM (low liquidity) or even recorded inflows (high liquidity). In April, funds serving larger investors did not see a noticeable rebound in their AUM, while less liquid funds catering to smaller investors fully recovered their losses.

iconThe views expressed are those of the authors and do not necessarily reflect the views of the BIS. icon There are several studies of the March 2020 stress in US prime money market funds, eg F Avalos and D Xia, "Investor size, liquidity and prime money market fund stress", BIS Quarterly Review, March 2021; M Cipriani and G La Spada, "Sophisticated and unsophisticated runs", Federal Reserve Bank of New York, Staff Reports, no 956, December 2020; L Li, Y Li, M Macchiavelli and X Zhou, "Runs and interventions in the time of Covid-19: Evidence from money market funds", Federal Reserve Board, manuscript. iconThis programme allowed banks to borrow from the Federal Reserve by pledging a wide range of assets purchased from prime and tax-exempt MMFs. Eligible assets included the most distressed ones, such as commercial paper and certificates of deposit. The loans to the participating banks were given on a non-recourse basis (ie banks did not bear credit risk) and were exempt from regulatory capital requirements. The facility eased the stress by making banks willing buyers of illiquid assets, thus providing liquidity to MMFs to meet redemptions. In so doing, it reduced investors' pre-emptive withdrawals. icon The PEPP was announced on 18 March 2020 and implemented on 24 March 2020, when the minimum remaining maturity of eligible non-financial commercial paper for both the PEPP and the Corporate Sector Purchase Programme was reduced from six months to 28 days. icon L Schmidt, A Timmermann and R Wermers, "Runs on money markets mutual funds", American Economic Review, vol 106, no 9, 2016. The expense ratio measures the operational costs of an investment fund (eg management, shareholder services and other administrative fees). The investor pays these costs through a reduction in the investment's rate of return. icon The four groups include a relatively balanced number of funds. In the euro VNAV segment, there are 51 funds managing $212 billion in the large investor-low liquidity group, 38 funds managing $13 billion in the small investor-low liquidity group, 37 funds managing $56 billion in the large investor-high liquidity group, and 49 funds managing $13 billion in the small investor-high liquidity group. The corresponding figures for the dollar LVNAV segment are 22 funds managing $92 billion, 30 funds managing $20 billion, 41 funds managing $73 billion, and 34 funds managing $79 billion. icon Luxembourg and Ireland are the two major jurisdictions hosting dollar-denominated LVNAV funds. See IOSCO, "Money market funds during the March–April episode", IOSCO Thematic Note, November 2020. icon For a description of the stress in US markets resulting from margin calls, see A Schrimpf, H S Shin and V Sushko, "Leverage and margin spirals in fixed income markets during the Covid 19 crisis", BIS Bulletin, no 2, April 2020. icon See Avalos and Xia, ibid.

US Treasuries maintained their broad appeal; snapback risk seemed significant

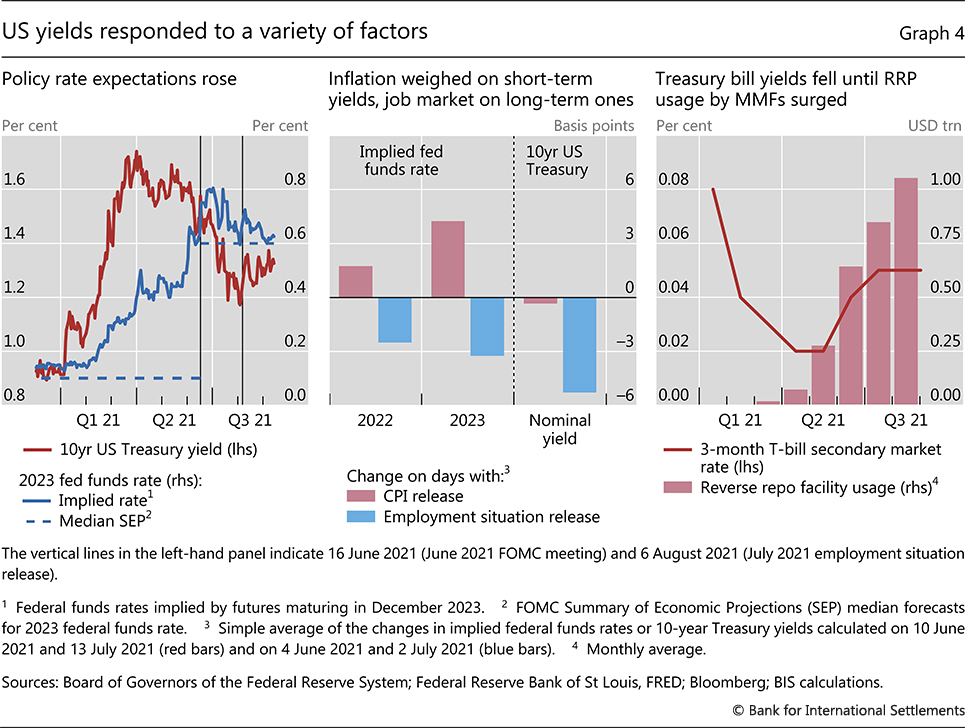
Treasury investors also seemed attuned to developments in the US labour market. Yields proved sensitive to signs of slack, such as high long-term unemployment and low labour force participation. Early in the review period, 10-year yields fell after reports surprised markets by revealing that such slack persisted despite very high job opening numbers (Graph 4, centre panel, third blue column). Subsequently, labour market improvements in August and September first put a floor on rates and then contributed to a slight increase.

As long-term yields fell to very low levels, perceived snapback risk remained noteworthy. Derivatives prices indicated that market participants were willing to bear relatively high costs to hedge against a sharp rise in 10-year interest rates. A measure of option-implied tail risk stood somewhat below the high levels recorded in 2013 and 2020 (Graph 5, right-hand panel).

The US dollar appreciated over the period under review relative to a broad basket of trading partner currencies, with some volatility around the general trend. Early on, the strengthening reflected expectations of a tighter policy stance in the wake of the June Federal Open Market Committee (FOMC) meeting (Graph 6, left-hand panel, vertical line). Subsequently, it seemed to stem primarily from a rise in the appeal of safe assets, which confirmed the dollar's status as a risk barometer. Most recently, the US currency depreciated notably following the remarks of the Federal Reserve Chairman at the Jackson Hole conference in late August.

The US dollar appreciated broadly

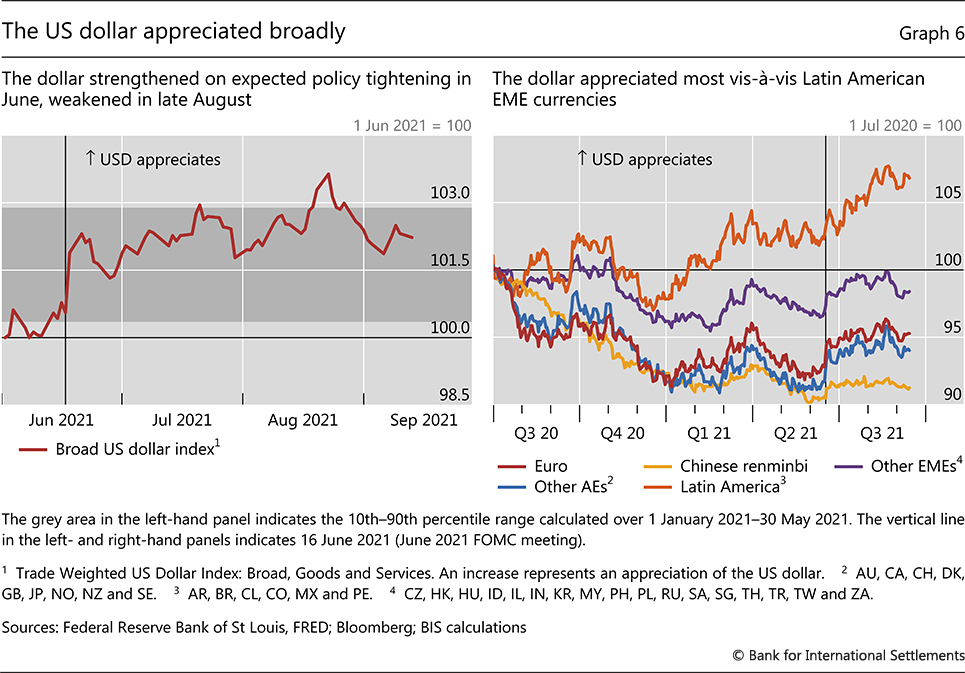
The US dollar's strength over the period as a whole was broad-based. Exchange rates vis-à-vis other AE currencies largely reverted to levels prevailing at the end of the first quarter, when AE yields had peaked (Graph 6, right-hand panel). The dollar appreciated the most against Latin American currencies, partly due to the macroeconomic and financial headwinds they faced (see below).

The renminbi proved remarkably resilient in recent months. Earlier in 2021, its exchange rate vis-à-vis the dollar had co-moved closely with those of other AEs and EMEs. This pattern changed and the renminbi stayed flat even as other currencies depreciated, starting roughly when the People's Bank of China raised the required reserve ratio for foreign exchange deposits, for the first time since 2007.

Incipient recoveries in EMEs faced a variety of hurdles. On top of general concerns about the lingering pandemic and the spread of the Covid-19 Delta variant, two issues stood out. The first was the rise in expected US policy rates, which muted the traditionally beneficial effects of declining long-term US yields on portfolio flows. The second was a host of country-specific developments, including inflationary pressures, especially in Latin America, and a weaker growth outlook in China.

EMEs experienced strong portfolio outflows as markets reassessed the expected stance of US monetary policy. Throughout 2021, flows to these economies generally improved when US long-term rates declined. This pattern reversed sharply after the June FOMC meeting, as EMEs other than China saw outflows even when US yields fell (Graph 7, left-hand panel).

EME flows and yields reflected expected US policy path  and regional headwinds

Country-specific challenges shaped diverging patterns in yields across EMEs. After rising together with AE rates earlier in the year, local yields continued to increase in Latin America as surging inflation prompted monetary policy tightening in most jurisdictions (Graph 7, centre panel). In other countries, such as Russia and South Africa, local yields remained largely flat despite rising inflation. By contrast, Chinese bond yields declined. This took place as a decelerating recovery prompted more accommodative policy and investors sought to profit from the positive yield differential between Chinese and US sovereign bonds (right-hand panel).

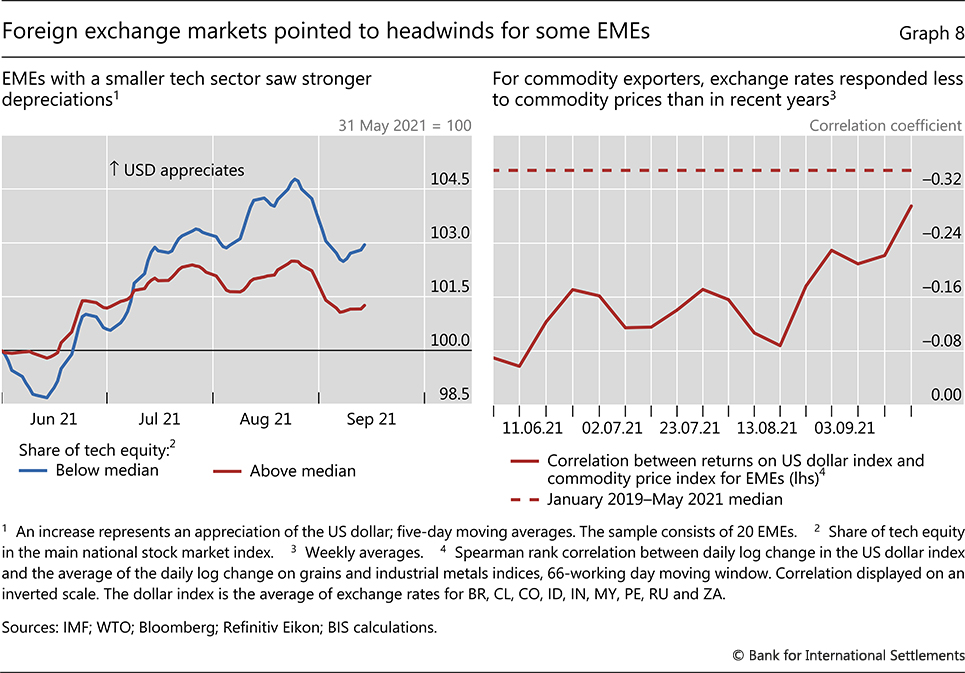
Patterns in foreign exchange markets also highlighted the predicament of some EMEs. The currencies of countries with a less developed technology sector depreciated more against the US dollar (Graph 8, left-hand panel). These countries could not benefit from strong international demand for high-technology products. In addition, in a sign that external funding pressures had built up, the exchange rates of commodity exporters were less responsive than usual to commodity prices (right-hand panel).

Foreign exchange markets pointed to headwinds for some EMEs

1 31 May to 13 September 2021.

2 The recent buoyancy of the money market mutual fund sector contrasts with the acute stress it suffered at the outbreak of the pandemic (Box B).