Search for yield sustains buoyant markets
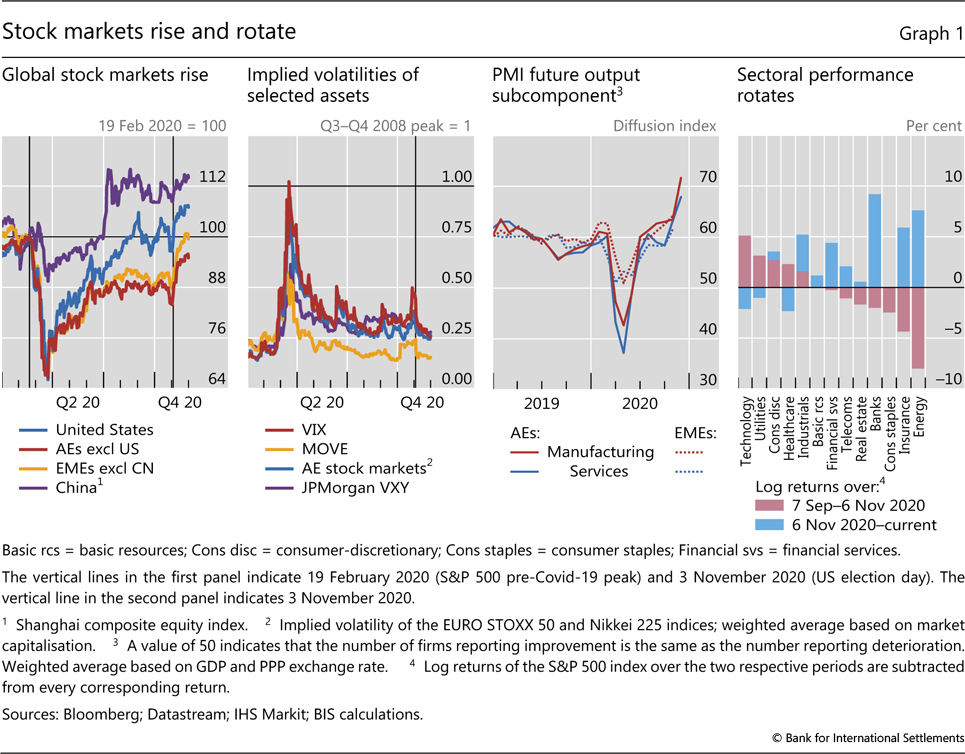
Risky assets picked up momentum with positive vaccine news in early November, after remaining range-bound for most of the period under review.1 Initially, an uncertain US election outcome and the second wave of Covid-19 kept valuations in check. Stock markets, particularly in the United States and China, alternated between brief rallies and sharp sell-offs. Subsequently, positive news on vaccine development boosted market sentiment and led investors to rotate towards sectors that had been severely hit by the pandemic outbreak. The overall market rise seemed to reflect the improved business conditions. However, concerns remained about the daylight between valuations, which are still above or near their already stretched pre-pandemic levels, and economic prospects, which are still uncertain.
A divergence in the assessments of corporate vulnerabilities may be emerging. Credit spreads in advanced economies saw some volatility but ultimately compressed further, approaching pre-pandemic lows. On the other hand, banks tightened lending standards throughout the review period. Investors' search for yield and the specifics of policy support appeared to underpin these contrasting developments.
Central banks maintained their accommodative stance as the second wave of Covid-19 arrived. In major jurisdictions, they kept their outstanding measures unchanged but emphasised their resolution to act in response to the economic fallout. In other advanced economies (AEs) and emerging market economies (EMEs), some central banks cut rates and/or scaled up asset purchases.
With continued central bank support, government bond yields in major AEs remained unusually low. Long-term US yields continued the upward trend started after the Treasury's August announcement of another increase in long-term bond issuances. That said, they experienced some volatility around election day. European sovereign yields trended down, as investors seemed to be expecting further policy easing on the back of low inflation and a weak economic outlook. This intensified search for yield, which led to further tightening of periphery sovereign spreads.
Sentiment towards EMEs improved. Attractive yields underpinned robust portfolio flows into China. For other EMEs, strong inflows to dollar-denominated bond funds continued and local currency bond funds began to see modest inflows in the course of November. Yields remained low in most cases, supported by domestic monetary policy and changing trade prospects.
The US dollar overall weakened in November, after trading sideways vis-à-vis both AE and EME currencies. The renminbi's appreciation was especially pronounced, as sentiment supporting Chinese assets strengthened. Some degree of differentiation in EMEs' currency strength appeared to be influenced by structural features of their economies. After the pandemic outbreak, and continuing during the review period, tech-heavy EMEs and those more deeply involved in manufacturing global value chains saw their currencies strengthen relative to those of commodity producers.
Key takeaways
- Risky assets received a fillip from positive vaccine news and the US election, although concerns about the daylight between valuations and the still uncertain economic prospects persisted.
- Government bond yields remained unusually low on the back of supportive monetary policy, sustaining a search-for-yield environment.
- Currency strength differed across EMEs, reflecting in part the importance of technology and manufacturing in the respective economies.
Risky asset prices rise and rotate
Lacking clear direction in September and October, financial markets received a boost in early November from positive news on the development of Covid-19 vaccines. In equity markets, this mainly benefited sectors more vulnerable to the pandemic. In parallel, corporate spreads narrowed further, which contrasted with a certain tightening of banks' lending standards.
Going into the US election, the stock market had traded within a wide range after a sell-off at the beginning of the period under review (Graph 1, first panel). The correction in September was concentrated in technology stocks, which had experienced the largest gains beforehand. At the same time, contrasting with prevailing patterns in the past two decades, US Treasuries sold off (Box A). The outcome of the election triggered a swift rally in stock prices.
Box A
US Treasuries and equity sell-offs: is the hedge faltering?
Fernando Avalos and Dora Xia
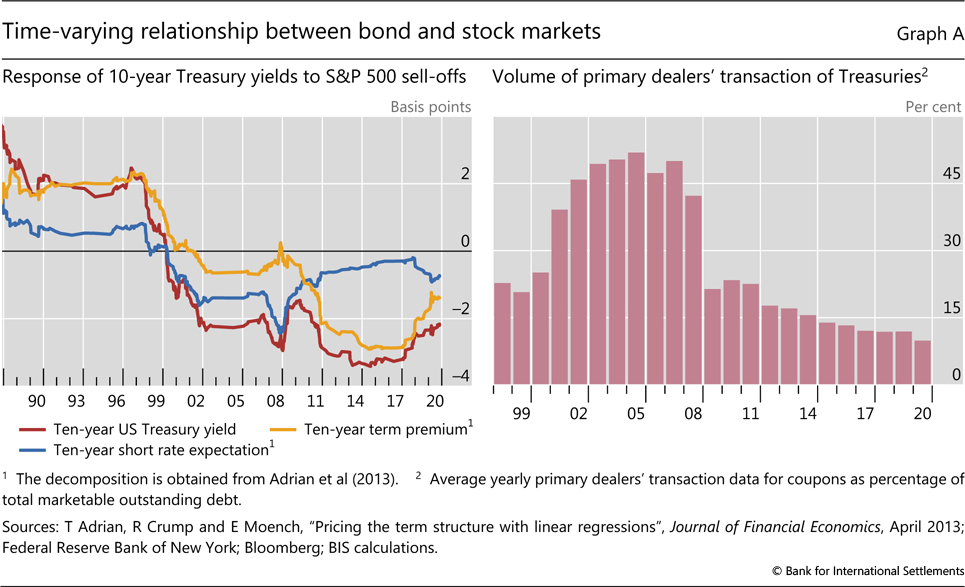
Over the past two decades, US Treasuries have served as a hedge against equity risk. However, this attribute has been called into question, as bond and equity markets have experienced simultaneous sell-offs in recent years. In this box, we focus on the hedging properties of US government bonds in the context of stock sell-offs, ie their status as safe haven assets. We find that this status has indeed weakened in recent years. Possible contributing factors are the Federal Reserve's limited easing space and bond dealers' reduced appetite to intermediate.
The turn of the century witnessed a marked change in the behaviour of US Treasuries during large equity sell-offs (corresponding to daily returns below the 5th percentile). Before the 2000s, 10-year US government bond yields tended to increase by 2 basis points when the S&P 500 index dropped by 1% (Graph A, left-hand panel, red line), which meant that bond and stock prices declined together. After that, US Treasuries became an effective hedge to stock market losses, as yields generally declined (and hence bond prices rose) during equity market downturns. The timing of the shift is in line with that found in the literature.
This shift reflects a change in the correlation between inflation and economic activity, which seems related to the changing interactions between monetary policy and the business cycle. Until the 1980s, recessions had been brought about mostly by central banks tightening in the face of inflationary pressures. Correspondingly, investors expected periods of low economic activity - and the attendant low stock prices - to go hand in hand with high inflation and/or high interest rates. This translated into higher Treasury yields and low bond prices. The interaction changed afterwards. Recessions became more likely to follow financial busts,
 to which authorities tended to respond by loosening monetary policy, and often persistently so.
 Eventually, falling stock prices started being associated with low interest rates and high bond prices, making Treasuries a hedge against downside risk in the equity market.
The key role of monetary policy expectations in those dynamics have affected, over time, different components of long-term Treasury yields. When interest rates were the primary monetary policy tool - that is, before the effective zero lower bound (ZLB) became a constraint - expectations of short-term rates drove the relationship between those yields and equity returns (Graph A, left-hand panel, blue line). Later, when the central bank resorted to asset purchases at the ZLB, term premia became the main driver of this relationship (left-hand panel, yellow line).
Signs have emerged that the effectiveness of US Treasuries as a hedge to large equity losses may have declined in recent years. The response of 10-year yields to S&P 500 sell-offs has become more muted since 2018 (Graph A, left-hand panel, red line), possibly reflecting the Federal Reserve's limited easing space. As Fed officials have consistently communicated their reluctance to introduce negative interest rates, this not only puts a floor under short-term rates but also limits the potential decline of long-term nominal yields, regardless of any additional easing measures considered.
The diminished effectiveness of the hedge could also reflect in part dealers' waning appetite to smooth transient supply or demand shocks in the US Treasury secondary market, even outside periods of generalised stress. As discussed elsewhere, their participation in this market has steadily receded since the Great Financial Crisis of 2007-09, while other market participants, such as hedge funds and principal trading firms, have emerged as liquidity providers (Graph A, right-hand panel).
 And these new participants have behaved in a more opportunistic manner, being less willing to step in when liquidity is most needed. All else equal, the resulting impairment of fair-weather liquidity conditions would increase liquidity premia and drive yields up (and prices down).
The views expressed are those of the authors and do not necessarily reflect the views of the Bank for International Settlements. See R Clarida, "Monetary policy, price stability, and equilibrium bond yields: success and consequences", remarks at the High-level Conference on Global Risk, Uncertainty and Volatility, November 2019. See J Campbell, C Pflueger and L Viceira, "Macroeconomic drivers of bond and equity risks", Journal of Political Economy, vol 128, no 8, August 2020. See C Borio, M Drehmann and D Xia, "The financial cycle and recession risk", BIS Quarterly Review, December 2018. See M Drehmann, C Borio and K Tsatsaronis, "Characterising the financial cycle: don't lose sight of the medium term!", BIS Working Papers, no 380, June 2012; and J Powell, "New economic challenges and the Fed's monetary policy review", remarks at the Jackson Hole Symposium, August 2020. See Z He, S Nagel and Z Song, "Treasury inconvenience yields during the COVID-19 crisis", NBER Working Papers, no 27416, June 2020. See T Adrian and J Kiff, "Market liquidity, leverage, and regulation ten years after the crisis", World Economic Forum, December 2018.
Forward-looking gauges of volatility reflected in part investors' perceived policy uncertainty. From early October, the implied volatility of major stock indices in AEs trended upwards, and the VIX jumped during the week before the US polls (Graph 1, second panel). The MOVE, which reflects the implied volatility of options on the main US Treasury benchmarks, also saw a material step-up as investors began to price in the possibility of a large fiscal expansion and the resulting higher supply of Treasuries. As the contours of the election outcome began to emerge midway through the first week of November, implied volatilities quickly fell back.
News on vaccine development boosted sentiment in November. Before the news, consistent with views prevailing earlier in the year, top outperformers included the technology and healthcare sectors, while financials and the energy sector underperformed (Graph 1, fourth panel, red bars). After the news, leading indicators of business conditions, which were already on the mend, turned sharply upwards (third panel). In consonance, stock markets rallied, benefiting sectors more vulnerable to the pandemic. Indeed, the rally generated a rotation towards the underperformers. In particular, firms within insurance, banking and energy saw the largest gains, while technology stocks lost some ground against the S&P 500 index (fourth panel, blue bars). This rapid rotation may have triggered the unwinding of highly leveraged positions on previous outperforming sectors, leading to extreme intraday price swings.
Corporate bond spreads tightened further, approaching pre-pandemic levels. The buoyancy of corporate bond markets contrasted with the uncertain medium-term global economic outlook, raising questions about the daylight in evidence between the underlying risks and spreads. The September equity sell-off had caused some short-lived volatility, particularly in the high-yield (HY) segment (Graph 2, left-hand panel). However, spreads narrowed soon afterwards and fell below their long-term averages. The spread compression was particularly noticeable in the investment grade (IG) segment.
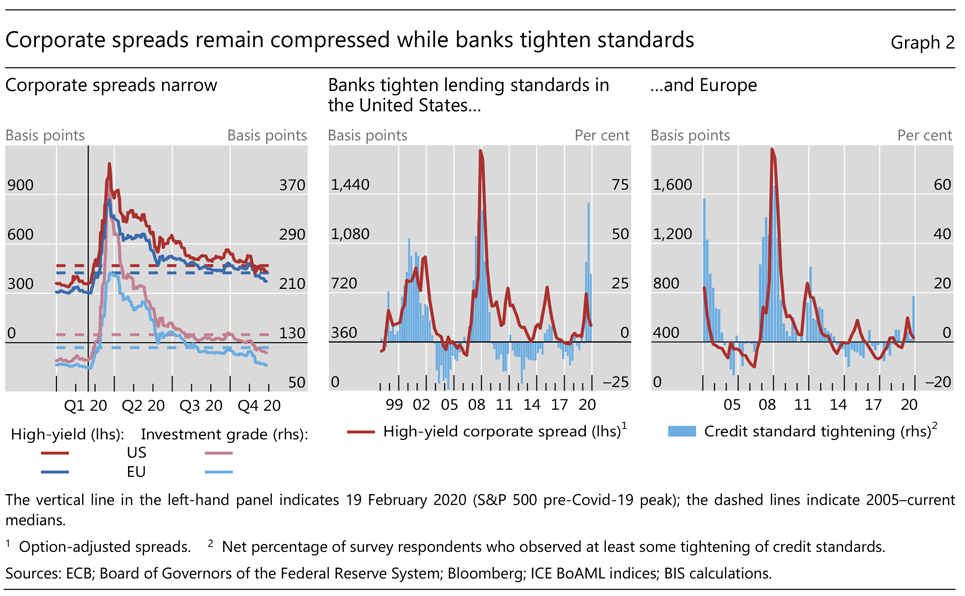
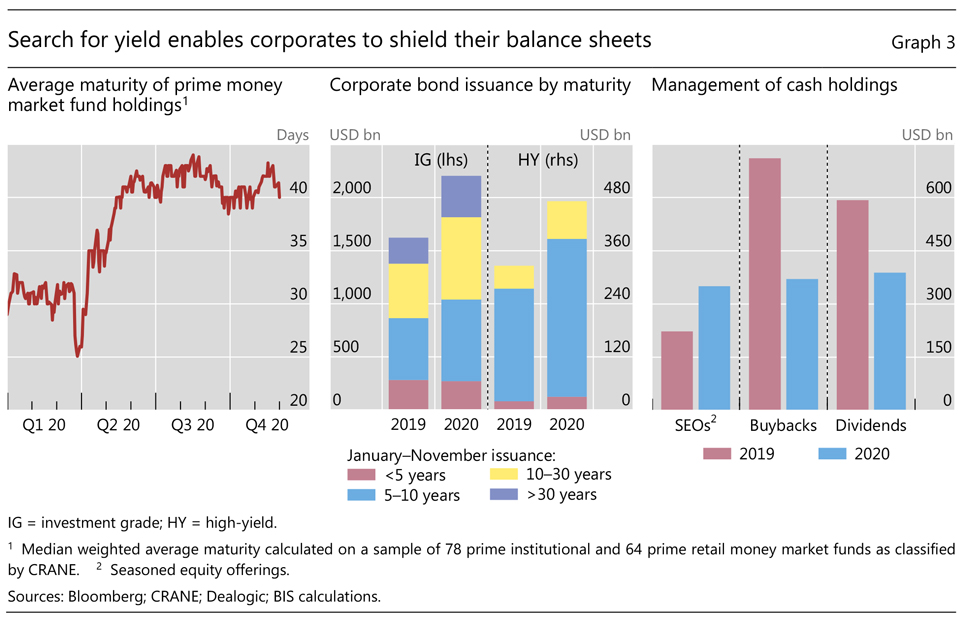
Compressed credit spreads contrasted with banks' more cautious lending attitude. In the past, conditions in corporate credit and bank lending markets often moved in sync. This time around, though, banks in the United States and Europe continued to tighten their lending standards into October, while credit spreads have narrowed (Graph 2, centre and right-hand panels). The divergence is likely to have resulted from central banks' support in corporate bond markets. That said, the announcement by the US Treasury in late November regarding the discontinuation of the corporate credit facilities met a muted market response. Perhaps more importantly, investors' search for yield in a low interest rate environment contributed to credit spread narrowing. The same driver seemed to underpin the lengthening maturities of prime money market funds' portfolios (Graph 3, left-hand panel).
The very easy financial conditions in credit markets supported corporates' efforts to shield their balance sheets from liquidity stress. Corporates in AEs have issued bonds at record pace this year, almost entirely at the longest end of the maturity spectrum, within both the IG and HY segments. Issuance of securities with tenors of five years or less changed little from last year, but that of paper longer than 30 years (IG) or 10 years (HY) increased by more than 50% (Graph 3, centre panel).
In general, firms reduced their cash outlays. As buybacks dropped by more than half, dividends also saw double-digit reductions in comparison with 2019 (Graph 3, right-hand panel). Also, companies actively enhanced their cash positions through seasoned equity offerings to investors.
Such strategies, however, may offer only partial protection. The empirical evidence tends to suggest that cash holdings may mitigate liquidity risks, but they can do little to alleviate debt service burdens, which are key drivers of solvency problems. Moreover, when cash holdings are raised through debt issuance, they go hand in hand with higher debt service burdens, which can actually make firms more vulnerable to weak demand and financial shocks.2
Supportive monetary policies keep rates low
Government bond yields remained subdued during the period under review, on account of supportive monetary policies. Globally, negative-yielding debt climbed to $17.5 trillion, on a par with all-time highs. This pushed investors into riskier assets as they searched for yield, which broadened the range of low- or negative-yielding assets. That said, long-term yields in the United States and Germany decoupled, reflecting different economic and policy outlooks, and government bond supply.
Across the globe, the actual and prospective monetary policy stance remained very accommodative. In fact, a number of central banks eased further or signalled that possibility, not least since in most jurisdictions inflation continued to undershoot targets, sometimes by a large margin (Graph 4, left-hand panel). Central banks in major economies kept their outstanding measures unchanged. And the Federal Reserve and the ECB adjusted their communications. Both of them emphasised continued vigilance regarding the economic developments, and qualified the scope of their outstanding actions.3 Some central banks in other AEs, such as Australia and the United Kingdom, expanded their quantitative easing operations, while some EME central banks (eg Colombia, Indonesia and Mexico) cut their policy rates.
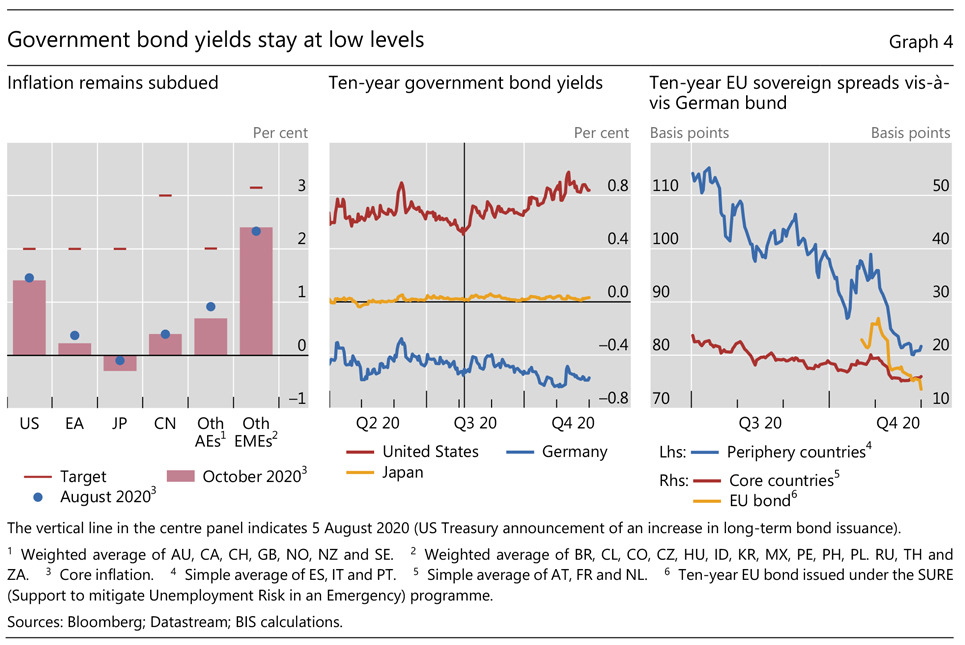
On the back of central bank support, government bond yields in most major AEs remained generally contained. Yields trended downwards in Germany (Graph 4, centre panel), while remaining flat in Japan, on account of continued yield curve control policy. In the United States, yields had tended to increase after the US Treasury announced a material expansion in long-term debt issuance in August.
The divergence between the developments in long-term government bond yields in the United States and Germany seemed connected, in part, to the different economic outlooks. Europe's dimmer long-term prospects may have led investors to price in a more accommodative monetary policy stance. Moreover, Germany issued relatively less debt for investors to absorb than the United States (Box B).
Low, actually negative, yields in core European government bonds spilled over to other borrowers. The European Commission successfully placed two tranches of long-term bonds to fund the unemployment support scheme. The yield on the new bonds at issuance stood somewhat above that of core EU members, but still in negative territory. Moreover, the Chinese government issued its first negative-yielding euro-denominated bond in November. All these issues were massively oversubscribed. Finally, some corporate debt also traded with negative yields, to the tune of more than $2 trillion, towards the end of the review period.
Sovereign spreads of European periphery countries tightened further, partly reflecting investors' continued search for yield. Overall, the spreads on periphery long-term bonds tightened by over 15 basis points. For some countries, such as Portugal and Spain, 10-year yields approached zero. There was some volatility in late October as the European Recovery Fund faced some obstacles in its parliamentary confirmation (Graph 4, right-hand panel), but subsequently the spreads resumed their general downward trend.
Box B
Government bond yields and the dynamics of duration supply
Fernando Avalos and Dora Xia
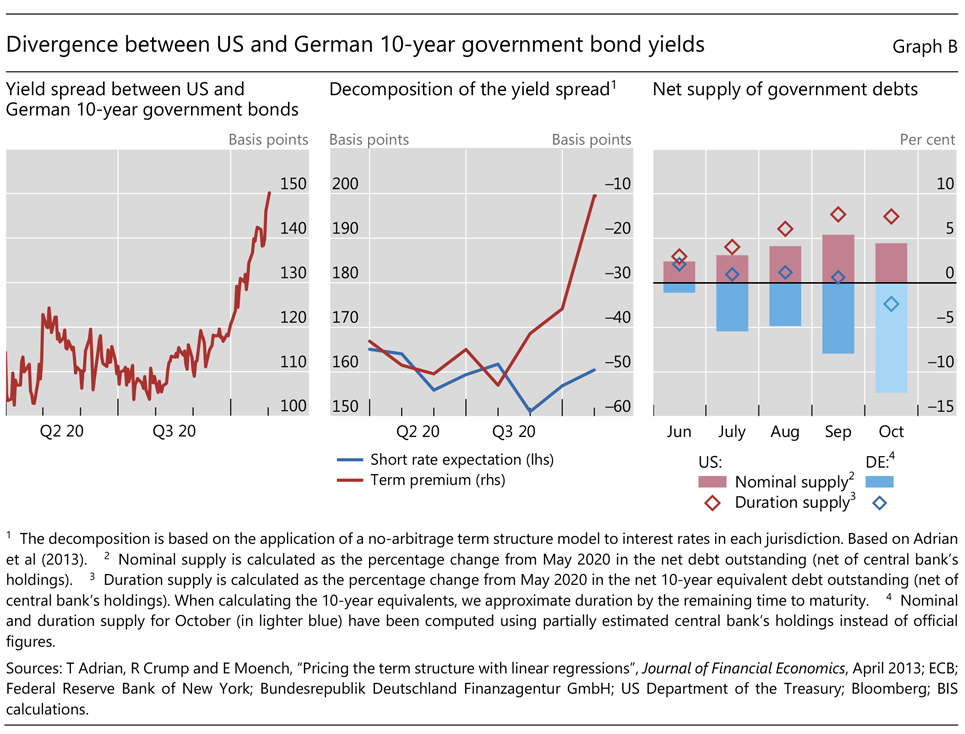
US and German 10-year government bond yields have gradually diverged since August. While US rates stepped upwards, German rates trended downwards. As a result, the 10-year yield spread has widened by about 40 basis points (Graph B, left-hand panel). In this box, we break down long-term yields into their two main components: an expectation of future short-term rates and a term premium. Based on this decomposition, we find that the widening of the spread appears to have been largely driven by diverging term premia. We argue that this divergence is explained, in part, by opposing trends in the net government supply of long-term bonds (net of central bank purchases). In addition, differing economic outlooks may have played a role.
Diverging US and German yields can reflect shifting expectations about the relative path of short-term interest rates and/or term premia. To assess the relative importance of each component, we estimate them for US and German yields using a no-arbitrage model of the respective term structures of interest rates. Then, we calculate the spreads implied by each component. From August to October, the expected rate spread barely moved, while the term premia spread increased by about 40 basis points and thus accounted for most of the yield spread widening (Graph B, centre panel).
An important driver of term premia is the net supply of government debt, defined as the debt available to private investors once purchases from price-inelastic participants, such as central banks, have been removed. For example, the net nominal supply declined after the Great Financial Crisis of 2007-09 as a result of major central banks' asset purchases. This seemed to have compressed term premia and long-term yields in these countries. In addition to the supplied amount of debt, the supplied duration (specifically, long-term bonds) also matters for term premia. For instance, during 2011-12 the Federal Reserve purchased long-term bonds funded by sales of shorter bonds (Operation Twist). This operation shrank the duration supply, contributing to further compression of term premia.
Conversely, the recent widening of term premia spreads may have reflected to a considerable extent the relative increase of the net supply of long-term US sovereign bonds to the private sector. US Treasury ramped up the debt issuance after the Covid-19 outbreak. Thus, despite continued heavy purchases by the Fed, private investors had to absorb a growing amount of US government bond supply (Graph B, right-hand panel, red bars). By contrast, hefty purchases by the ECB through its own asset purchase programmes, together with contained issuance by the German government, reduced the outstanding stock of German sovereign bonds available to private investors (right-hand panel, blue bars). In fact, the euro area as a whole has seen a reduction in sovereign bond supply since June.
The US Treasury also lengthened the maturities of its debt issues. This led to an even larger increase of net supply, measured in duration terms (Graph B, right-hand panel, red diamonds). In contrast, the German government bond net duration supply has stayed relatively stable since May (right-hand panel, blue diamonds).
The expectation of heavier US government bond supply (and larger fiscal stimulus) from the next US administration may have further widened the spread before the election. As the election result made it more likely that the fiscal package would be smaller than initially expected, the yield spread saw a temporary compression before resuming its upward course.
The views expressed are those of the authors and do not necessarily reflect the views of the Bank for International Settlements. As a robustness check, we replicated the analysis using survey data on short rate expectations. The result suggests an even larger role of the term premia spread as the expected rate spread narrowed between Q2 and Q3 2020. Other factors affecting the term premia may include business cycle conditions, the uncertainty about the projected path of short rates, and the hedging property of bonds. For a review, see B Cohen, P Hördahl and D Xia, "Term premia: models and some stylised facts", BIS Quarterly Review, September 2018. See eg B Bernanke, "Why are interest rates so low, part 4: term premiums", Brookings Institution Blog, April 2015. See D Vayanos and J-L Vila, "A preferred habitat model of the term structure of interest rates", NBER Working Papers, no 15487, November 2009.
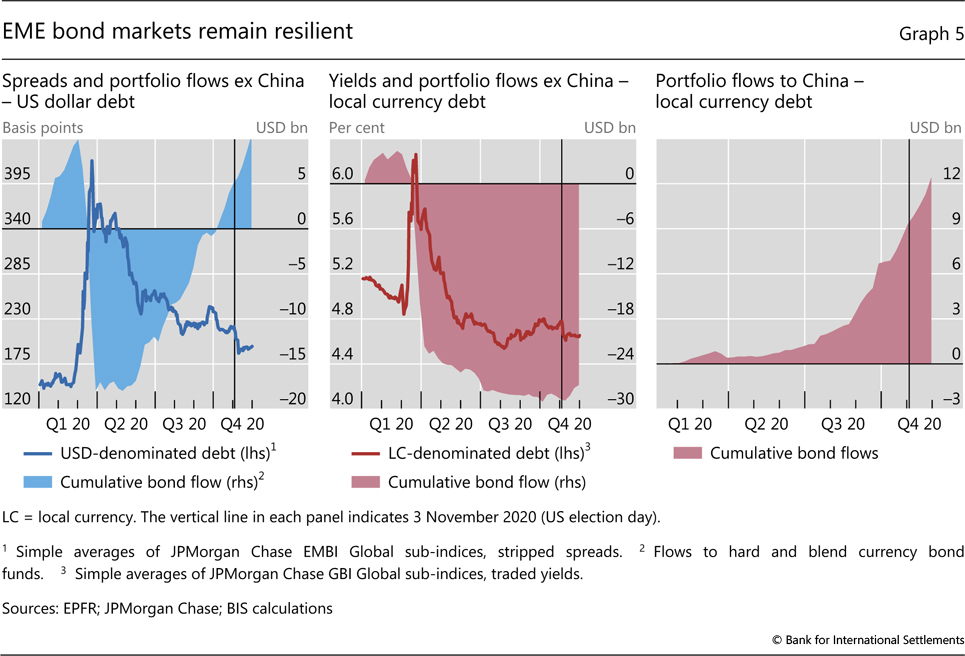
Sentiment towards EME fixed income markets improved after the US election. Portfolio inflows into funds investing in dollar-denominated fixed income assets from EMEs ex China continued to gain traction (Graph 5, left-hand panel). Their year-to-date cumulative amount turned positive again in September, and approached the pre-pandemic outbreak levels towards the end of the review period. Local currency EME funds ex China booked modest inflows in November, but the corresponding year-to-date cumulative portfolio flows remained deep in negative territory (centre panel). On the other hand, China saw robust inflows into local currency bond funds on the back of its relatively attractive yields and the announced inclusion of its government securities in a major bond index (right-hand panel).4
EME yields remained broadly stable in both the local currency and the dollar-denominated segments. In addition to the improved sentiment, this stemmed from EME central banks' accommodative monetary policy, which built upon the global easing environment and soft inflation numbers. The yields took a step down in the wake of the US election, probably reflecting investors' expectation of a more benign trade outlook.
EME currencies follow different paths
The US dollar weakened overall, particularly after the news on vaccine progress. EME currency strength varied, and the differentiation seemed to be related to the respective economies' technology intensity and/or involvement in global value chains.
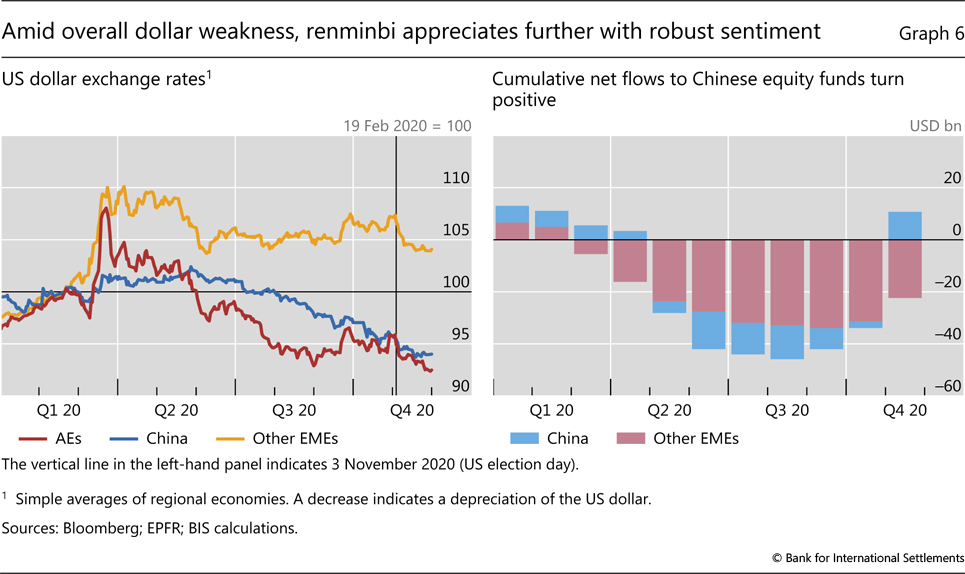
The broad dollar performance largely mirrored changes in overall market sentiment during the review period. The greenback first appreciated as uncertainties around the US election and the second wave of Covid-19 built up, in a pattern common to risk-off environments. The gain then vanished after the preliminary election results and positive news on vaccine development. On balance, the dollar depreciated moderately vis-à-vis both EME and AE currencies, whereas the depreciation had been mostly against AE currencies in earlier quarters (Graph 6, left-hand panel).
The US dollar depreciation was especially noticeable vis-à-vis the Chinese currency. The renminbi continued its trend appreciation that had begun in May. Its strong performance might reflect the more successful pandemic containment policies and the faster economic recovery in China. Moreover, the currency may have benefited from strong portfolio inflows, not only to bond funds (as discussed) but also to equity funds (Graph 6, right-hand panel). This stood in contrast to other EMEs, which as a group witnessed only a limited equity flow recovery. The renminbi experienced some volatility on the heels of the unexpected halting of the initial share offering of a fintech company, and defaults by several highly rated corporates.
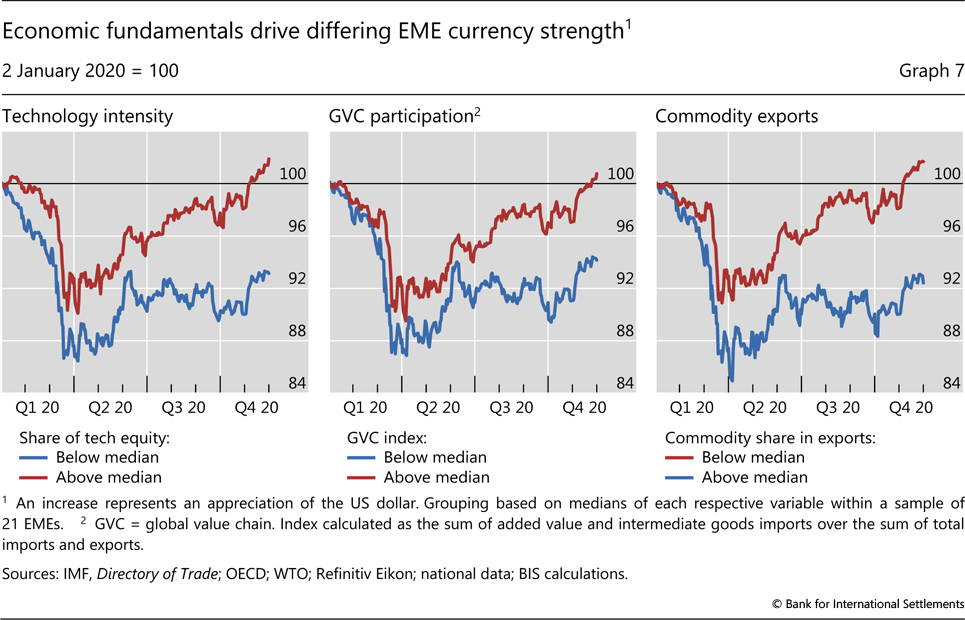
Currency strength differed across EMEs during the review period, confirming a pattern already seen earlier in the year. The differentiation seemed to reflect, to a considerable extent, the sectoral composition of the respective economies. In part, this echoed the tech theme that had been driving equity valuations since the pandemic was declared. Currencies in jurisdictions with heavier weight on technology companies, eg Chinese Taipei and Korea, surpassed their pre-pandemic levels (Graph 7, left-hand panel). In addition, the currencies of EME jurisdictions more deeply embedded in global value chains also recouped their March losses, as the global manufacturing sector regained momentum (centre panel). In contrast, the currencies of countries more reliant on commodity exports, eg Russia and some Latin American countries, saw a limited rebound from the depths of the March turmoil (right-hand panel).
1 7 September to 30 November 2020.
2 See the feature entitled "The financial vulnerabilities driving firms to the exit" in this issue.
3 In September, the Fed pointed out that its asset purchases would also aim to foster accommodative financial conditions, in addition to sustaining proper market functioning. In October, the ECB indicated that it expected to significantly recalibrate its policy settings in December, in response to the updated economic outlook.
4 On 24 September 2020, FTSE Russell announced the inclusion of Chinese bonds in the World Government Bond Index over a period of 12 months, starting in October 2021.