Calculating clearing rates in BIS derivatives statistics
The calculation of clearing rates - the proportion of contracts cleared through CCPs - may seem straightforward, but several complications arise. One fundamental issue relates to whether to use trading activity or outstanding contracts (ie flow or stock data). Clearing rates based on trading activity, such as turnover, can better capture the degree of clearing of current contracts. However, such data overweigh short-term contracts, which are turned over more frequently. For the CDS market, the BIS covers only outstanding contracts.
A second issue is how to address the double-counting of dealer contracts that are novated to CCPs. In the BIS derivatives statistics, dealers report outstanding contracts by counterparty type. Thus double-counting of inter-dealer positions, including cross-border inter-dealer trades, can be eliminated. However, indirect inter-dealer trades - ie those that are novated to a CCP - are still counted twice. Novation effectively replaces one inter-dealer trade with two dealer-to-CCP trades. Since a CCP typically acts as a counterparty to two dealers, counting each dealer's position with the CCP again introduces double-counting. Ignoring this problem, the clearing rate for the CDS market was 55% at end-December 2017, which can be treated as an upper bound (Graph A1, left-hand panel). Dividing the positions with CCPs by two yields an adjusted minimum clearing rate, as it assumes that all positions with CCPs are initially inter-dealer contracts. This lower bound on the clearing rate was around 38% at end-December 2017.
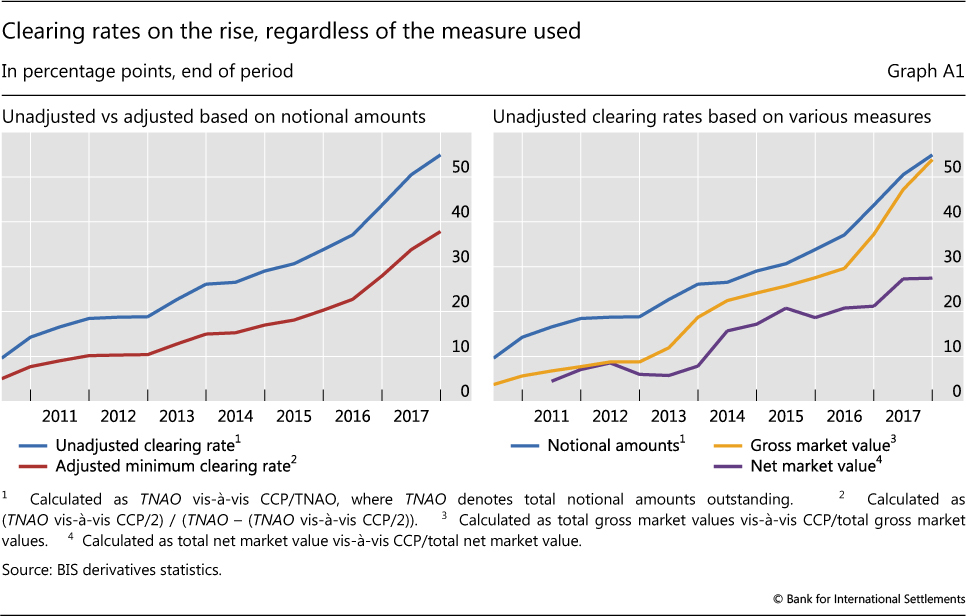
A third issue is the choice of inputs used to measure clearing rates for outstanding contracts, such as notional amounts, gross market values or net market values. Notional outstanding amounts are a natural, and indeed the most common, choice for computing clearing rates based on outstanding contracts. But using market values instead can provide interesting insights. Gross market values, for instance, are a closer measure of the amount that might be lost in a credit event. If credit risk shrinks, so does the market value of the contract. Net market values, in addition, take into account legally enforceable netting agreements (among CDS contracts and not considering collateral), which further reduces values. Yet market values may introduce a downward bias in clearing rates. Newer, standardised contracts, which have zero market value at inception, are likely to be cleared, whereas legacy and bespoke contracts are more likely to be in the money (ie have a high market value) and less likely to be cleared. While all the different measures yield a rising trend in clearing rates, the steepness of the trend differs (Graph A1, right-hand panel). Recently, clearing rates based on notional amounts and gross market values have converged, as uncleared legacy contracts with high market values have been maturing. Using net market values yields significantly and persistently lower clearing rates, as netting is more common for cleared contracts.
This is the most realistic of the two extreme assumptions, as the clearing members of the CCPs engaged in CDS clearing are a subset of BIS reporting dealers. Therefore, for the CDS market at least, the minimum estimated clearing rate is likely to be very close to the actual one.