Payments are a-changin' but cash still rules
Retail payment systems continue to become faster and more convenient. Yet, despite increased use of electronic payments around the world, there is scant evidence of a shift away from cash. As the appetite for cash remains unabated, few societies are close to "cashless" or even "less-cash". In fact, demand for cash has risen in most advanced economies since the start of the Great Financial Crisis. This resurgence appears to be driven by store-of-value motives (reflecting lower opportunity cost of holding cash) rather than by payment needs.1
JEL classification: E40, E41, E42.
Like "the times" in Bob Dylan's song, the ways we pay are a-changin'. In most advanced countries, cheques have disappeared or are dying a slow death. Credit or debit cards are now accepted by all but a few merchants. New electronic payment (e-payment) services are emerging around the world and are increasingly instant, ubiquitous and available around the clock (CPMI (2016), Bech et al (2017)).
Many types of payment usually done with cash are going electronic. In Denmark, for example, church collection boxes and street performers now accept mobile payments. In China, fast food can be bought using "smile to pay" facial recognition technology. In the United States, college students pay for pizza and beers using apps that broadcast the purchases to their social media friends.
In general, innovations are putting the traditional bank-based payment system under pressure both within and across borders (CPMI (2015)). The proliferation of mobile phones has, in some developing countries, allowed payment systems to leapfrog those in more advanced economies. For example, in Kenya and other places, mobile payments flow without bank accounts.2 Going forward, cryptocurrencies as well as fintech applications - the subject of feverish innovation by both small startups and large firms - will likely further disrupt existing business models. In addition, some central banks are considering the need to issue a digital version of cash (eg Sveriges Riksbank (2017b)).
On the face of it, all this points to a shift away from cash (ie notes and coins). However, the data, so far, say otherwise. Based on the "Red Book" statistics3 on payment, clearing and settlement systems collected by the Committee on Payments and Market Infrastructures (CPMI),4 cash in circulation and card payments (a proxy for e-payments) have both increased since 2007.5 Only Russia and Sweden show evidence of substitution between cards and cash (Graph 1).6
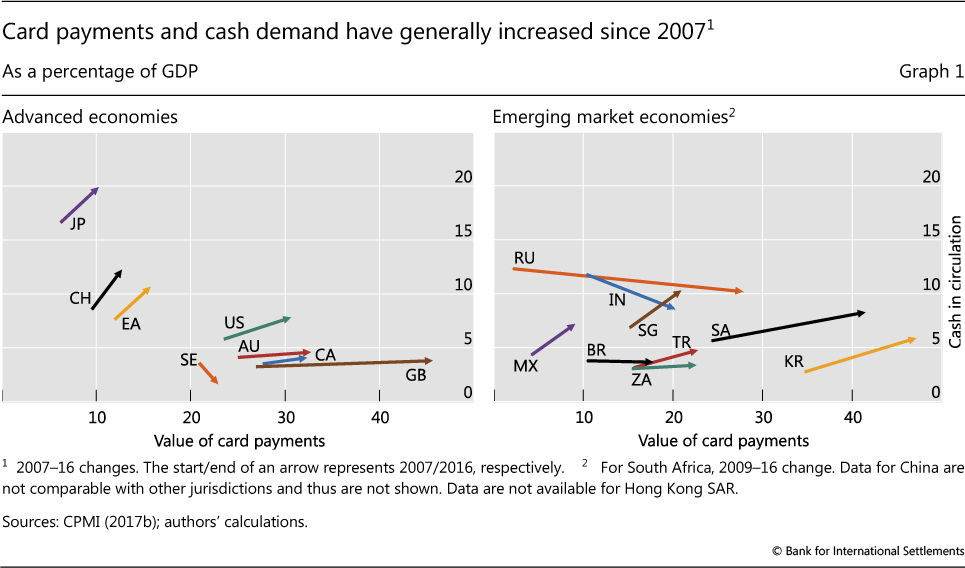
Why is the demand for both cash and card payments rising? And, in particular, why has the demand for cash remained so robust? To seek answers to these questions, we look at recent trends in e-payments and demand for cash across countries.
We find that people are using cards for payments more frequently and for ever-smaller transactions. This is driven, in part, by more people holding cards (in emerging market economies (EMEs)) and greater availability of point-of-sale (PoS) terminals (in both emerging and advanced economies). Nevertheless, the demand for cash remains robust around the world, except notably in some Nordic countries. Furthermore, many jurisdictions have seen an increased affinity for cash following the Great Financial Crisis (GFC). Digging a bit deeper and differentiating between "means-of-payment" and "store-of-value" demand for cash, we provide evidence that the increasing demand for cash is driven, in part, by the lower interest rates (hence a lower opportunity cost of holding cash) that have characterised the post-crisis period.
The feature starts by analysing the use of card payments. The second section examines trends in cash demand. The third explores the drivers of cash demand, while the concluding one outlines some policy issues.
Card payments are a-booming ...
Around the world people are relying more and more on e-payments. Data on card payments (defined as e-payments made with a plastic card at a PoS terminal)7 are currently the most comparable and consistent cross-country data on e-payments in the Red Book.8
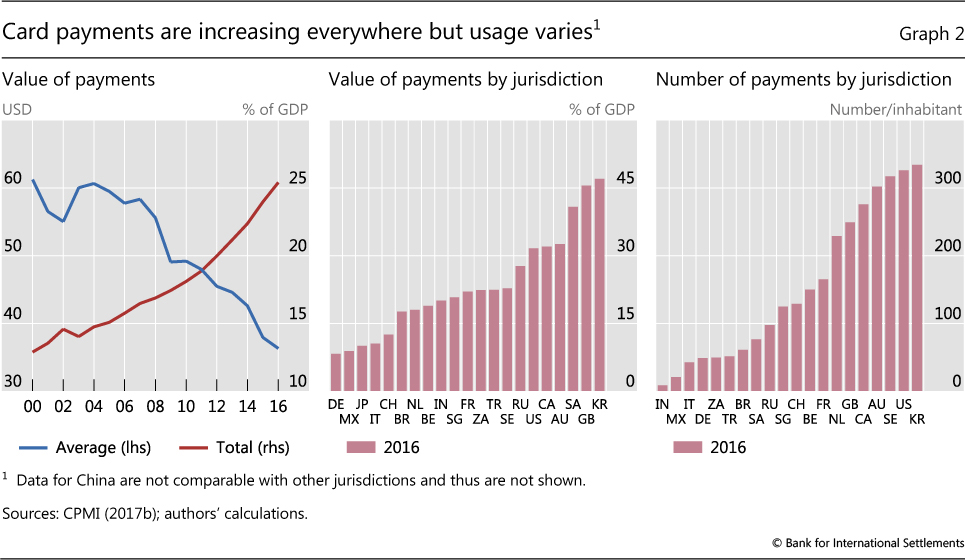
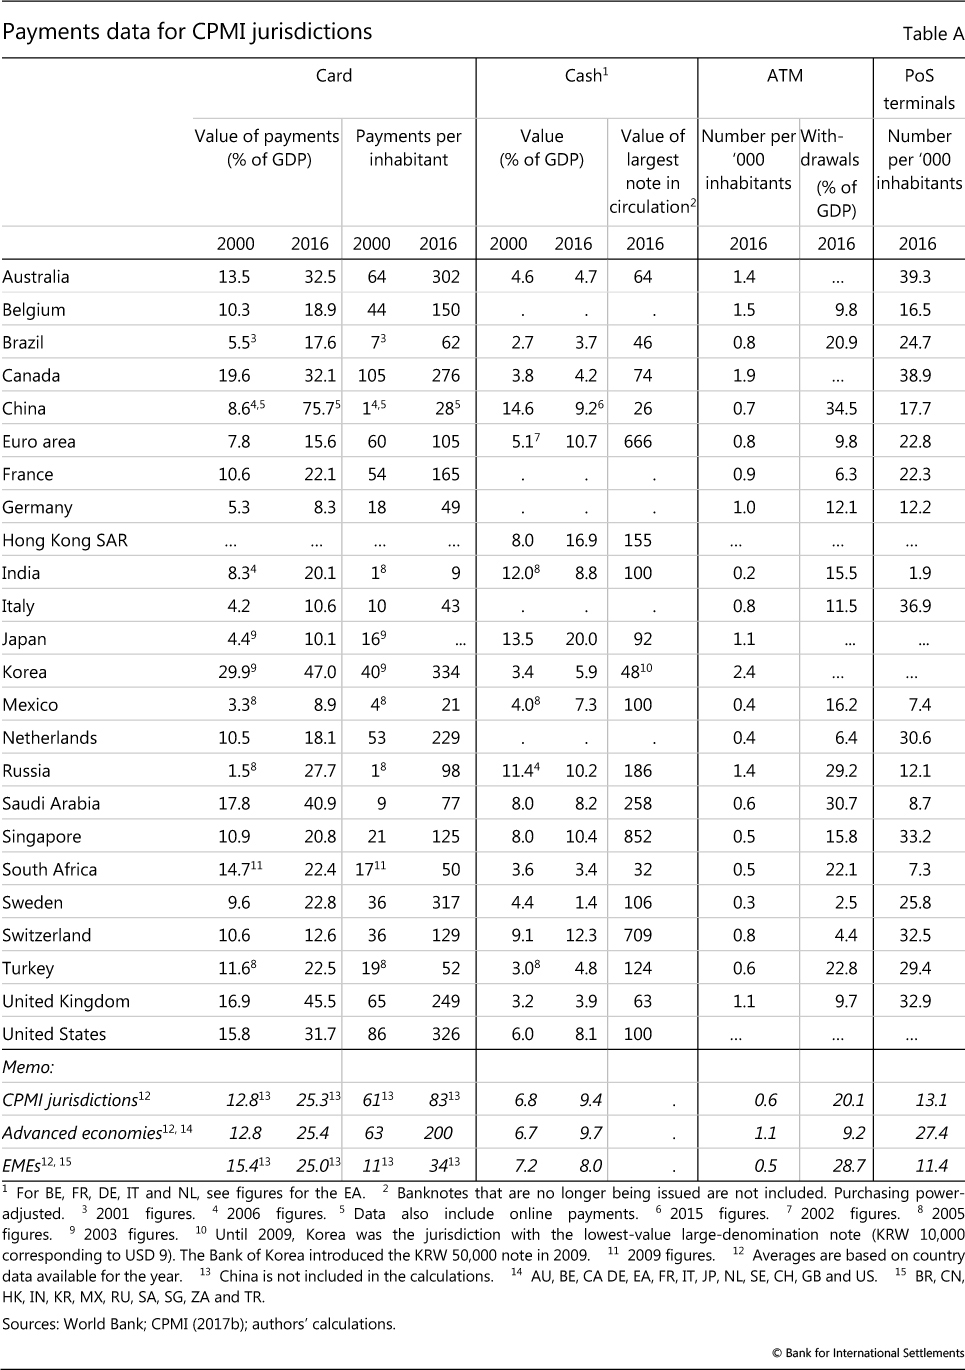
The value of card payments for CPMI member countries increased from 13% of GDP in 2000 to 25% in 2016 (Graph 2, left-hand panel and Annex Table A). Not surprisingly, card use varies significantly across countries but there is no apparent difference between EMEs and advanced economies. The value of card payments (relative to GDP) is only around 10% in Germany, Japan and Mexico, but is over 40% in Korea, Saudi Arabia and the United Kingdom (centre panel).
People hold more cards and use them more often. The average number of payment cards (eg credit and debit cards) per person in CPMI member countries rose from 1.1 to 2.5 in the 2007-16 period. Cards issued in EMEs drove this increase, as cards per person were little changed in most advanced economies. The frequency of card use increased from around 60 transactions per person on average in 2000 to close to 85 in 2016. In Australia, Korea, Sweden and the United States, the average person uses a card more than 300 times per year while in India and Mexico the number is less than 25 times a year (Graph 2, right-hand panel).
At the same time, the value of a typical card payment has declined. Over the last decade and a half, the average value of a card payment (in nominal terms) has dropped from above $60 to less than $40. This decline has been most pronounced in Brazil, Korea and Russia.9 In 2016, the smallest average value of a card payment was around $8, in Brazil and Russia.
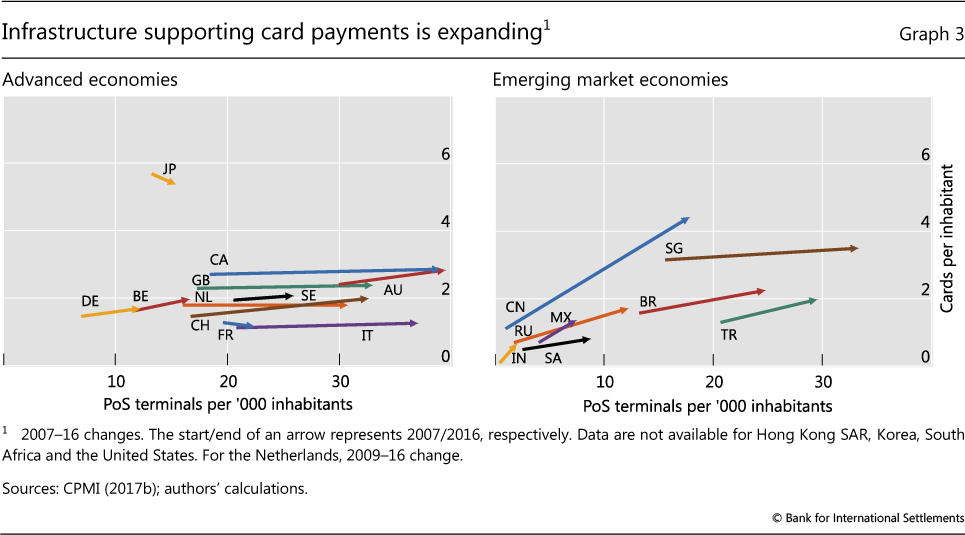
One reason why cards are being used for an increasing number of ever smaller payments is better and more widespread infrastructure. PoS terminals used to be fixed terminals installed on counters but they have increasingly been replaced by more convenient mobile terminals. Lately, lower-cost smartphone or tablet-based PoS terminals have emerged, encouraging even smaller businesses to invest in them.
The density of PoS terminals has correspondingly risen. In CPMI countries, their density has doubled between 2007 and 2016 to 13 per thousand inhabitants. Density went up for all jurisdictions but the largest increases were in Canada and China (Graph 3). On average, there are 27 PoS terminals per thousand people in advanced economies and 11 in EMEs.
...but cash still rules in many places
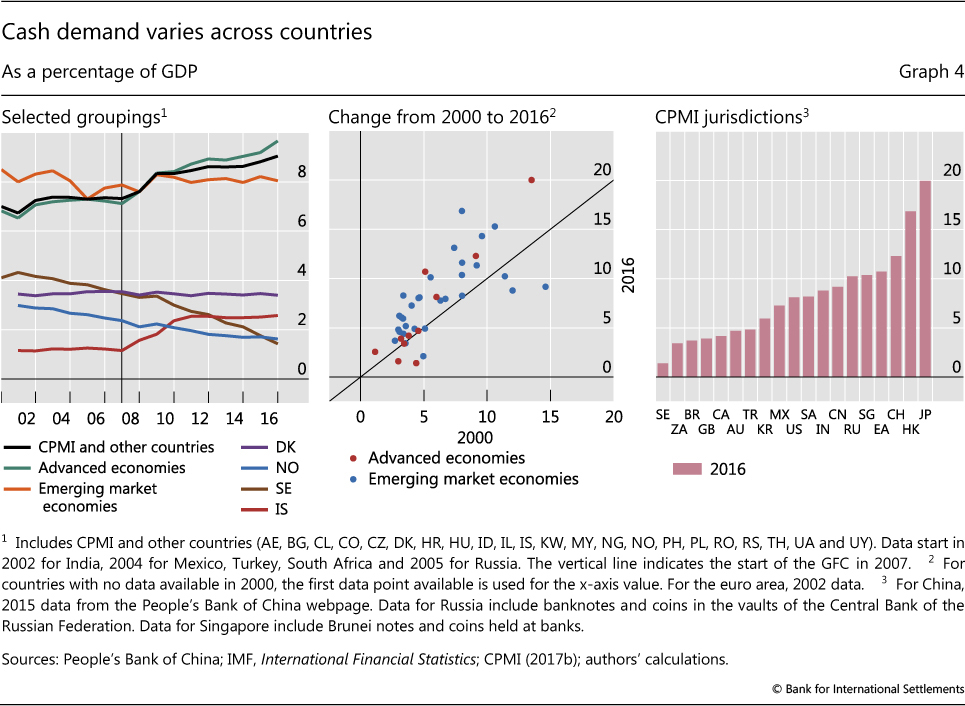
Cash in circulation (scaled by GDP) is frequently used as a proxy for cash demand (eg Amromin and Chakravorti (2007), Williams and Wang (2017)). Since 2000, cash in circulation is up from 7% to 9% of GDP (on average) in a sample comprising CPMI members and 22 additional countries (Graph 4, left-hand panel).10 The increase is primarily due to an uptick in advanced economies following the GFC.11 Overall, a majority of countries saw higher cash in circulation (centre panel), with the largest increases occurring in Hong Kong SAR and Japan (by 9 and 7 percentage points of GDP, respectively). In contrast, in China cash demand declined by 5 percentage points of GDP.12
As noted by other studies (eg Jobst and Stix (2017)), cash demand varies considerably across countries (Graph 4, right-hand panel). While one might expect EMEs to have higher cash demand, no such pattern is evident from the data. According to the latest Red Book, for 2016, cash in circulation is below 2% of GDP in Sweden, but 10 times larger in Japan at 20%. Demand even differs among countries that are otherwise similar in terms of economic and social characteristics. One such example is the Nordic region. At the start of the 2000s, Iceland's cash-to-GDP ratio was as low as 1.2%, while Denmark, Norway and Sweden were clustered at around 3-4% (Graph 4, left-hand panel).13 Since then, cash demand has shown a secular decline in Sweden and Norway, while in Denmark it has remained stable at around 3.5%. However, in Iceland, cash demand has more than doubled since its banking crisis, and now exceeds that of Norway and Sweden.
As with cards, the infrastructure supporting cash has improved. Since their debut in 1967, automated teller machines (ATMs) have become the key means through which people access cash. Like PoS terminals, ATMs have also evolved; most ATMs now accept cash deposits and some also provide other banking services such as bill payments.
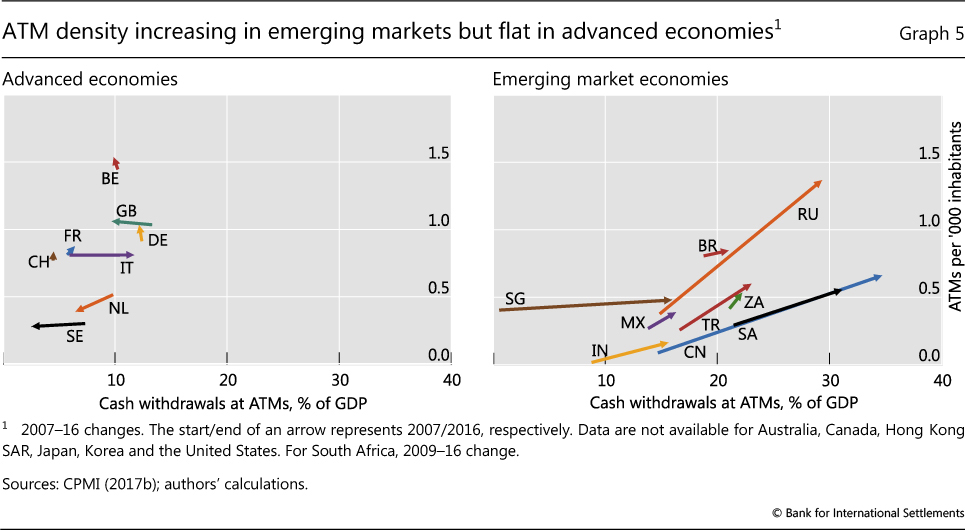
The number of ATM terminals per thousand inhabitants has surged over time. In CPMI countries it has risen by 50% since 2007, from 0.4 per thousand people in 2007 to above 0.6 in 2016. Over the same period, the amount of cash withdrawn rose from 12% to 20% of GDP. These increases were driven by rapid growth in EMEs, where the number of ATMs as well as the amounts withdrawn rose significantly (Graph 5). In contrast, for advanced economies ATM density is, in general, little changed since 2007. An interesting case is the Netherlands, where the density of ATMs declined, in part, because of a shift towards using the "cashback" option at the point of sale (Netherlands Bank (2017)). Lastly, the value of ATM withdrawals in advanced economies saw disparate trends. Withdrawals as a share of GDP fell for the Netherlands, Sweden and the United Kingdom, stayed unchanged for Belgium, France, Germany and Switzerland, and increased for Italy.
The relationship between ATMs and cash demand is not straightforward (Graph 5). ATMs can both boost and constrain cash demand. On the one hand, by facilitating easy access, ATMs increase cash demand. On the other hand, wider distribution of ATMs can reduce the amount of cash consumers hold, since they can withdraw it as needed. Moreover, it can be difficult to determine whether higher cash demand leads to a greater supply of ATMs or vice versa.
What is driving cash demand?
"Money is what money does" (Hicks (1969)). And cash, like other forms of money, is used both as a means of payment and a store of value. Banknotes sewn into a mattress are likely held for store-of-value purposes but it is harder to tell whether a banknote in a wallet is held for one or the other motive. One way to get to at this distinction is to ask people to keep diaries of how they pay (eg Esselink and Hernández (2017), Greene and Schuh (2017)). However, such surveys are costly to run and differences in methodology complicate the comparison of data across countries. In addition, people keeping diaries often underreport smaller-value (mainly cash) transactions (Ilyés and Varga (2017)). For these reasons, a common way to try and disentangle the two types of cash demand is to assume that larger-denomination notes are mostly held as a store of value and smaller ones for payments (Amromin and Chakravorti (2007)).
Of course, what constitutes a "large" note is in the eye of the holder. The most valuable notes currently issued by CPMI members are Switzerland's CHF 1,000 (~$1,060)14 and Singapore's SGD 1,000 (~$760) notes.15 In contrast, countries whose largest-denomination notes have the smallest value are China (CNY 100, ~$16) and South Africa (ZAR 200, ~$17) (Graph 6, left-hand panel).
Here we use a uniform threshold across countries of $75 (purchasing power-adjusted) to distinguish the two components of cash demand.16 We find that the relative share of total cash in circulation accounted for by large notes varies greatly across the CPMI countries. For Mexico and Sweden, the large-denomination notes comprise less than 10% of the outstanding stock of cash in circulation while in Hong Kong SAR, Japan and Saudi Arabia, these notes constitute more than 75% of the total (centre panel).17
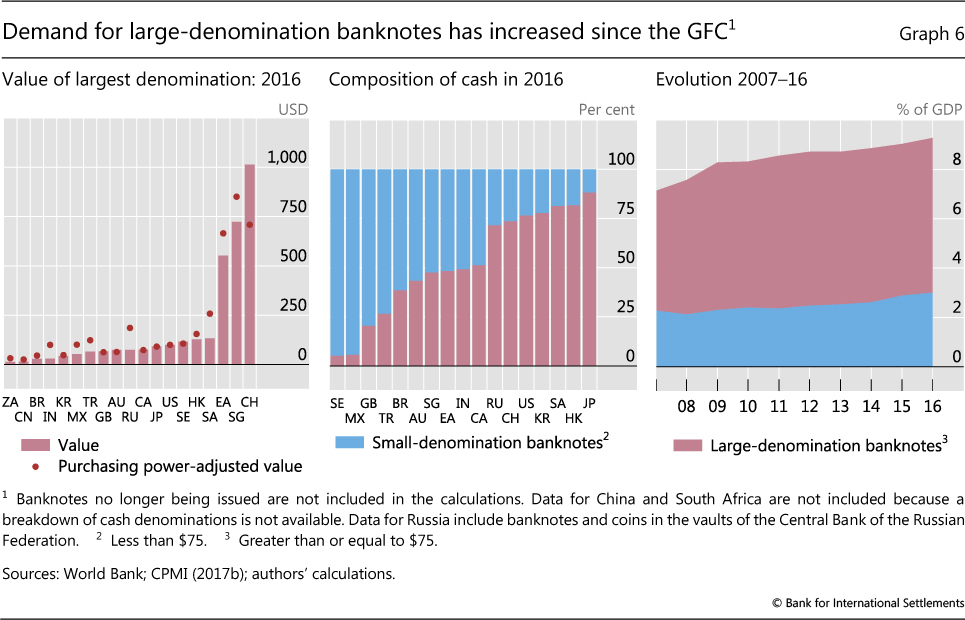
The evolution of large- and small-denomination notes suggests that cash is being increasingly used as a store of value rather than for payments. Over the last decade, the demand for large-denomination notes has outpaced that for smaller denominations (Graph 6, right-hand panel). In fact, a handful of countries (eg Korea and Russia) saw the demand for smaller-denomination notes decline and that for larger-denomination ones increase. Sweden is again an outlier: demand for all notes has decreased since 2007.18
Regression analysis
Panel data analysis can help shed further light on factors driving cash demand. Following Keynes (1936), we focus on three motives for holding cash: transactionary, precautionary and speculative (or portfolio). However, the small size of our data set (fewer than 20 countries, and annual data for 16 years) requires a parsimonious approach.
The econometric model is as follows:

where three different measures of the dependent variable are used: total cash demand, demand for small notes (transactionary), and demand for large notes (store-of-value or speculative).
OpportunityCosti,t is proxied by the central bank policy rate.19 Other things equal, we expect store-of-value demand to fall when the forgone interest of holding cash increases. In contrast, transactionary demand is expected to be less sensitive to movements in the policy rate. Uncertaintyi,t represents country-specific financial and economic uncertainty.20 Higher levels of uncertainty may increase the demand for cash due to a number of precautionary motives, including diminished trust in financial intermediaries and less clarity about future payment needs. If so, Uncertaintyi,t would be positively related to cash demand, especially for the smaller banknotes. In addition to country fixed effects, we control for Agei,t (average age of the population) and GDPPerCapitai,t.21 Everything else equal, cash demand is expected to be higher when the average age of the population increases (affinity for cash among older people) and to be lower as GDP per capita increases (lower cash use as countries become richer over time).
The regression results generally confirm our priors for the explanatory variables (Table 1).22 Conditional on unobserved country characteristics, the average age of the population is positively related to the total and transactionary demand for cash (columns I and II). This is consistent with survey evidence which shows that younger people are more likely to use electronic means of payments, whereas older generations tend to be more attached to cash for payments (eg Stavins (2001), Esselink and Hernández (2017)). Both the total and transactionary demand for cash (columns I and II) is also inversely related to GDPPerCapitai,t.
Interestingly, we do not find a statistically significant effect of uncertainty in our regressions.23 There could be a number of reasons for this. For example, our coefficient estimates reflect an unweighted average across countries. This implies that, even if uncertainty is positively related to cash demand in some large countries, it may not be captured in the average estimate across countries. In addition, some of the currencies in the sample have a non-trivial component related to global demand for cash, which could be affected more by foreign rather than by domestic uncertainty.24 Finally, our uncertainty measure may not fully capture uncertainty related to payment needs.
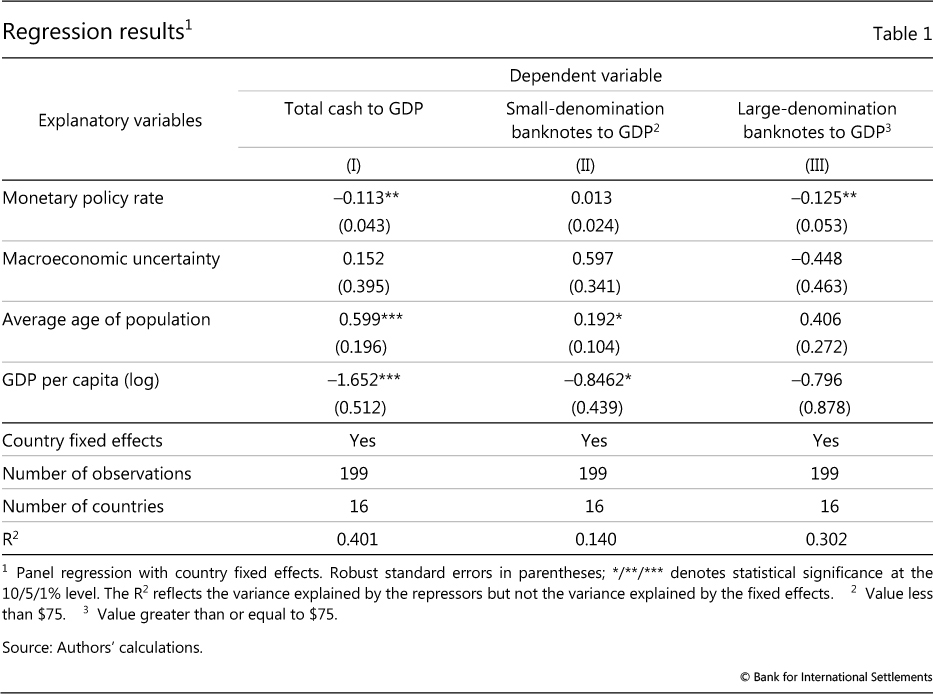
Importantly, the regression analysis suggests that cash demand increases as the opportunity cost decreases.25 The impact of OpportunityCosti,t is statistically significant for total demand and for large notes (columns I and III), but not for small ones (columns II). This is in line with our expectations.
An important caveat is that the strength of our findings is limited by the small sample size.26 For example, in order to keep the model parsimonious, other variables such as the density of ATMs, measures of corruption and tax evasion (eg Drehmann et al (2002)), and unobserved time effects were not incorporated.
Conclusions
Not only are payments arguably the origin of central banking (eg Quinn and Roberds (2007), Schnabel and Shin (2018)), but they have historically been the channel through which technological innovations first affected the financial system. They might even be the area where innovation brings the most benefits: Paul Volcker once quipped that the ATM was the only financial innovation that had improved society (Volcker (2010)).
Payments are currently seeing another period of rapid innovation and transformation. The use of e-payments is booming and technology companies as well as financial institutions are investing heavily to be the payment providers of tomorrow. Yet, despite continuing digitalisation, "reports of the death of cash are greatly exaggerated" (Williams and Wang (2017)). Cash in circulation is, in fact, not dropping for most countries. The continuing demand for cash has been especially noticeable in advanced economies since the start of the GFC, and is likely driven by store-of-value motives rather than payment needs.
Cash is an evergreen topic for central bankers. In the light of the current debate around digital currencies (Carstens (2018)), including those potentially issued by a central bank (eg Skingsley (2016), Bech and Garratt (2017), Mersch (2017), CPMI-Markets Committee (2018)), understanding the costs and drivers of demand is more important than ever.27 For such analysis, more timely, comprehensive and comparable data on the use of cash and e-payments are needed. The upcoming improvements in the Red Book are a step in this direction. However, further efforts are needed to collect more detailed data at the jurisdictional level and to ensure that these data are comparable across countries. With better data, we might be able to finally answer the question of whether notes and coins will continue to stay with us and, if so, for how long.
References
Amromin, G and S Chakravorti (2007): "Debit card and cash usage: A cross-country analysis", Federal Reserve Bank of Chicago, Working Papers, no 4.
Banegas, A, R Judson, C Sims and V Stebunovs (2015): "International dollar flows", Board of Governors of the Federal Reserve System, International Finance Discussion Papers, no 1144, September.
Bech, M, Y Shimizu and P Wong (2017): "The quest for speed in payments", BIS Quarterly Review, March, pp 57-68.
Bech, M and R Garratt (2017): "Central bank cryptocurrencies", BIS Quarterly Review, September, pp 55-70.
Carstens, A (2018): "Money in the digital age: what role for central banks?", Lecture at the House of Finance, Goethe University, Frankfurt, 6 February 2018.
Committee on Payments and Market Infrastructures (2015): Digital currencies, no 137, November.
--- (2016): Fast payments - enhancing the speed and availability of retail payments, no 154, November.
--- (2017a): Methodology of the statistics on payments and financial market infrastructures in the CPMI countries (Red Book statistics), no 168, August.
--- (2017b): Statistics on payment, clearing and settlement systems in the CPMI countries - Figures for 2016, no 172, December.
Committee on Payments and Market Infrastructures and Markets Committee (2018): "Central bank digital currencies", March, forthcoming.
Dittus, P and M Klein (2011): "On harnessing the potential of financial inclusion: The case of 'mobile payments'", BIS Working Papers, no 347, May.
Drehmann, M, C Goodhart, M Krueger, M Boldrin and A Rose (2002): "The challenges facing currency usage: will the traditional transaction medium be able to resist competition from the new technologies?", Economic Policy, vol 17, no 34, pp 193-227.
Esselink, H and L Hernández (2017): "The use of cash by households in the euro area", ECB Occasional Papers, no 201.
Greene, C and S Schuh (2017): "The 2016 diary of consumer payment choice", Federal Reserve Bank of Boston, Research data report, no 17-7.
Handelsrådet (2018): Framtiden för kontanterna, no 1.
Hicks, J (1969): "Critical essays in monetary theory", The Canadian Journal of Economics, vol 2, no 1, pp 141-44.
Ilyés, T and L Varga (2017): "What can we learn about payment choice from seeing all retail transactions?", paper presented at the 30 December-1 November 2017 ECB and Banca d'Italia joint conference.
Jobst, C and H Stix (2017): "Doomed to disappear: the surprising return of cash across time and across countries", CEPR Discussion Paper Series Economic History, no 12327.
Keynes, J (1936): "The general theory of employment, interest and money", Macmillan.
Krüger, M and S Seitz (2014): "Costs and benefits of cash and cashless payment instruments - overview and initial estimates", study commissioned by the Deutsche Bundesbank.
Mersch, Y (2017): "Why Europe still needs cash", contribution to Project Syndicate.
Netherlands Bank (2017): Interim report for 2017 on accessibility of ATMs and cash deposit facilities in the Netherlands, prepared for the National Forum on the Payment System, December.
Öztürk, E and S Sheng (2017): "Measuring global and country-specific uncertainty", IMF Working Papers, no 219.
Quinn, S and W Roberds (2007): "The Bank of Amsterdam and the leap to central bank money", American Economic Review (papers and proceedings), vol 97, no 2, pp 955-78.
Schnabel, I and H S Shin (2018): "Money and trust: lessons from the 1620s for money in the digital age", BIS Working Papers, no 698, February.
Skingsley, C (2016): "Should the Riksbank issue e-krona?", speech at FinTech Stockholm, 16 November.
Stavins, J (2001): "Effect of consumer characteristics on the use of payment instruments", Federal Reserve Bank of Boston, New England Economic Review, no 3.
Sveriges Riksbank (2017a): "The Riksbank's e-krona project, report 1", September.
--- (2017b): "The Riksbank's e-krona project, Action plan for 2018", December.
Volcker, P (2010): "Future of finance: Volcker rules on innovation", (video), Future of Finance Initiative, Wall Street Journal, 26 January 2009.
Williams, J and C Wang (2017): "Reports of the death of cash are greatly exaggerated", San Francisco Fed blog, 20 November 2017.
Annex
1 The authors would like to thank Claudio Borio, Benjamin Cohen, Stijn Claessens, Mathias Drehmann, Leonardo Gambacorta, Marc Hollanders, Hyun Song Shin, Takeshi Shirakami and Paul Wong for helpful comments and Codruta Boar for excellent research assistance. The views expressed are those of the authors and do not necessarily reflect those of the BIS. Frederik Ougaard is a Special Advisor at the Danish Financial Supervisory Authority and co-authored this special feature while seconded to the BIS.
2 Some mobile money services (eg Kenya's M-PESA) do not require users to have a bank account. However, aggregate balances within the service are typically held by the operator in trust in a bank account. See Dittus and Klein (2011) for a discussion of mobile payments and financial inclusion.
3 Like the US Federal Reserve's "Beige Book", the "Red Book" got its name because of the colour of its cover when it was first published in 1985. The Red Book gives an overview of the transactional flows through payment, clearing and settlement systems (ie for retail and wholesale payments, central counterparties and securities settlement systems). Among other things, the data include the value of cash in circulation (by denomination), the number and value of card payments and information on point-of-sale terminals and automated teller machines. The most recent edition, covering data for 2016, was published in December 2017 (CPMI (2017b)).
4 The 24 CPMI jurisdictions are: AU, BE, BR, CA, CN, EA, FR, DE, HK, IN, IT, JP, KR, MX, NL, RU, SA, SG, ZA, SE, CH, TR, GB and US.
5 Cash in circulation (a stock measure) is obviously not equivalent to the use of cash for payments (a flow measure). However, comparable cross-country data on cash use are not available and cash in circulation is often used as a proxy.
6 The arrow for India also indicates substitution between cards and cash. However, towards the end of 2016, the Indian government announced the removal of all INR 500 and 1,000 banknotes (ie demonetisation) and the issuance of new INR 500 and 2,000 banknotes. Cash in circulation dropped by more than 40% between 1 November and 31 December 2016. Latest data from the Reserve Bank of India show that cash in circulation in February 2018 was almost back to its November 2016 level.
7 Includes cards with credit features, debit features or both. Card payments made on the internet or using a smartphone app are not included in the current measure.
8 The scope of the data collected by the Red Book is updated from time to time to reflect and track the latest trends. Starting with 2018 version, the Red Book will be revamped, partly in order to capture more aspects of e-payments, such as online and contactless methods. The upcoming changes are detailed in CPMI (2017a).
9 In Russia, this may, in part, reflect new policies during the sample period. In October 2013, the Russian Ministry of Finance introduced regulation that directed retailers with annual sales of over RUB 60 million (around $1 million) to install PoS terminals to accept card payments.
10 The 22 additional countries report data on cash in circulation to the IMF's International Financial Statistics. These include: DK, NO, IS, CL, CO, UY, IL, KW, AE, ID, MY, PH, TH, NG, BG, UA, CZ, RS, HU, HR, PL, and RO. For BE, DE, FR, IT and NL, cash in circulation is measured at the euro area level.
11 The Wald test confirms the presence of a structural break in cash demand in 2007-08 for advanced market economies, but we find no such break for EMEs.
12 The rapid rise in the mobile payment solutions in China (eg AliPay and WeChat) has likely contributed to this decline in cash demand.
13 Finland was slightly above 2% of GDP before the changeover to the euro.
14 Based on the end-February 2018 exchange rate.
15 The most valuable note still in circulation (but no longer issued) is the SGD 10,000, which at end-February 2018 was worth a cool $7,600. The issuance of the CAD 1,000 bill was stopped in 2000 and the ECB plans to stop the issuance of the EUR 500 banknote at the end of 2018.
16 The purchasing power parity adjustment is based on World Bank estimates. While the choice of the value of the threshold is somewhat arbitrary, varying the value does not materially change the analysis.
17 For countries where all notes are below the $75 threshold, the highest-denomination notes are treated as the "large" notes.
18 Cash demand is expected to continue declining in Sweden, in part, as it is not compulsory for businesses and retailers in Sweden to accept cash as payment (Sveriges Riksbank (2017a)). Handelsrådet (2018) estimates that 25% of Swedish merchants will cease to accept cash by 2020 and the figure is expected to rise to 50% by 2025.
19 Other options for the opportunity cost of cash (eg overnight deposit and three-month interbank rates) were also considered. The regression results are generally robust to these alternative variables, but overall perform somewhat better with the policy rate.
20 The measure is based on Öztürk and Sheng (2017) and is expressed as an index bound by 0 to 2. It is based on subjective forecasts of market participants and reflects their perceived financial and economic uncertainty. Higher values of the measure correspond to higher uncertainty.
21 The country-level fixed effects account for about 40% of the variability in cash demand; this is not shown in the adjusted R2 in Table 1. The country effects likely reflect cultural factors, the black economy, tax evasion characteristics etc that the explanatory variables cannot capture.
22 The panel regression is not weighted, so the coefficient estimates reflect an average impact across countries.
23 The results are similar when using other measures of economic of financial uncertainty such as the implied volatility in stock options.
24 For example, Banegas et al (2015) show that US cash shipments were correlated with domestic uncertainty before the GFC but with global uncertainty afterwards.
25 Our results suggest that the policy rate can account for one third of the variability in total cash demand over time (average across all countries), and 12% of the variability across countries (average over time).
26 Also, a full range of robustness checks was infeasible given the limited degrees of freedom. For example, estimating the equations country by country could have helped to identify misspecification.
27 As the total cost of using cash is difficult to estimate, cross-country data are relatively sparse and often not directly comparable. Krüger and Seitz (2014) provide an overview of these issues. They note that, while estimates of the cost of cash range between 0.2 and 0.7% of GDP for selected advanced economies, these figures are not really comparable. This is due to differences in methodologies, assumptions about the value of time and the opportunity cost (interest rate), and the point in time when the estimates were calculated.