A paradoxical tightening?
Markets and the real economy continued their year-long honeymoon during the period under review, which started in early September. Amid further synchronised strength in advanced economies (AEs), mostly solid growth in emerging market economies (EMEs) and, last but not least, a general lack of inflationary pressures, global asset markets added to their year-to-date stellar performance while volatility stayed low. This "Goldilocks" environment easily saw off the impact of two devastating hurricanes in the United States, a number of geopolitical threats, and further steps taken by some of the major central banks towards a gradual removal of monetary accommodation.
Central banks' actions, on balance, reassured markets. Their varied moves reflected their different positions in the policy cycle. Following its September meeting, the Federal Open Market Committee (FOMC) announced that it would initiate its balance sheet normalisation programme in October, after careful and prolonged communication with markets about strategies and approaches. After 10 years on the sidelines, the Bank of England at its November meeting raised its policy rate by 25 basis points to 0.50%, while keeping the bond purchasing programmes unchanged - which market participants described as a "dovish hike". In October, the ECB extended the Asset Purchase Programme (APP) at least until September 2018 while halving the monthly purchases, starting in January 2018. The central bank also confirmed that it would stand ready to expand the APP again if macroeconomic conditions deteriorated. The Bank of Japan kept its policy stance unchanged.
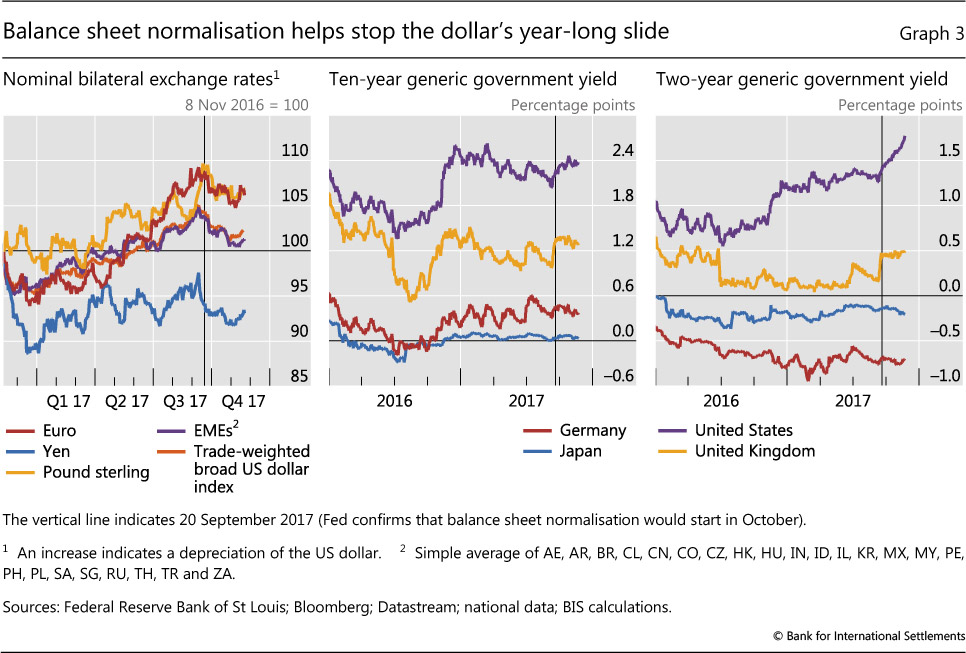
Even as the Federal Reserve implemented its gradual removal of monetary accommodation, financial conditions paradoxically eased further in the United States and globally. Only exchange rates visibly priced in the Fed's relatively tighter stance and outlook, which helped stop and partially reverse the dollar's year-long slide.
As long-term yields remained extremely low, valuations across asset classes and jurisdictions stayed stretched, though to different degrees. Near-term implied volatility continued to probe new historical lows, while investors and commentators wondered when and how this calm would come to an end. Ultimately, the fate of nearly all asset classes appeared to hinge on the evolution of government bond yields.
Markets in a sweet spot
Global stock markets continued the strong rally that had started in the aftermath of the November 2016 presidential election in the United States (Graph 1, first panel). They appeared to gain further momentum in early September, in the wake of the ECB's September meeting and Federal Reserve officials' comments which were taken to confirm that an announcement on balance sheet normalisation would be made later that month. By late November, the S&P 500 had risen almost 14% since the beginning of the year, and more than 5% from early September. After falling sharply following the US presidential election, EME stocks outperformed their AE peers, surging almost 30% in the year to date, and more than 4% in the period under review. Japanese equities staged a rally of almost 15% from early September. European stocks lagged their peers with increases of almost 7% in the year to date, most of which were recorded during the fourth quarter.
The ebullient mood coincided with renewed declines in implied volatility for equities, bonds and exchange rates (Graph 1, second panel). The implied volatilities of bond and equity markets in the United States, the euro area, Japan and the United Kingdom have been significantly below post-Great Financial Crisis (GFC) averages all year. In fact, they have touched the all-time troughs previously reached briefly in mid-2014 and before the start of the crisis in mid-2007. Implied volatility in exchange rate markets is also compressed, nearing the lows recorded during the summer of 2014. For all these series, the 2016 US presidential election appears to have been the turning point.
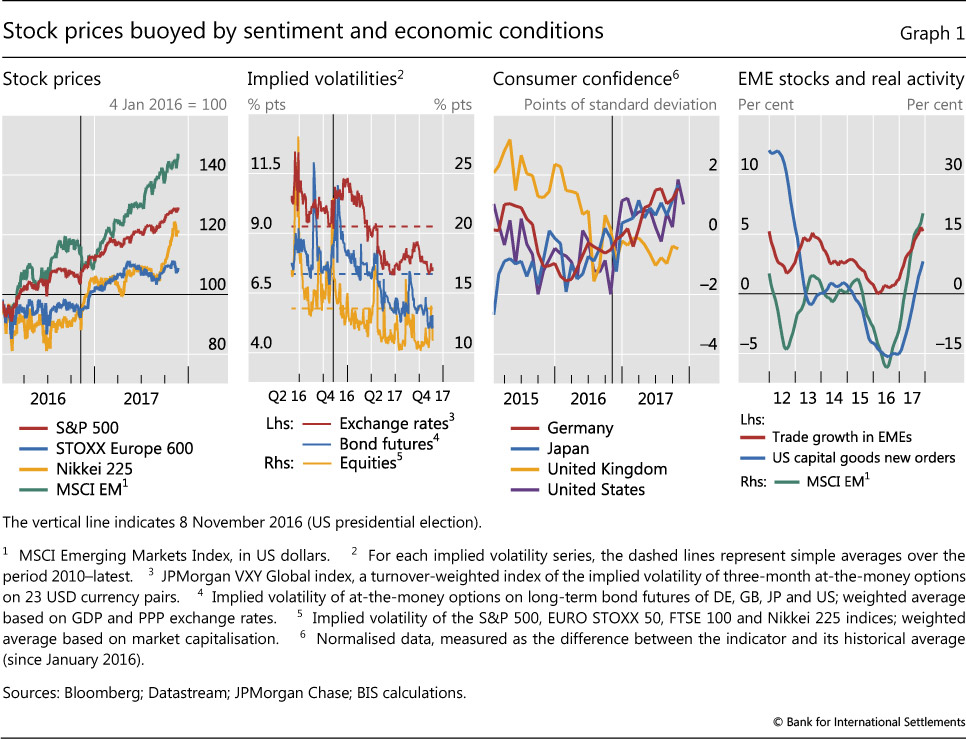
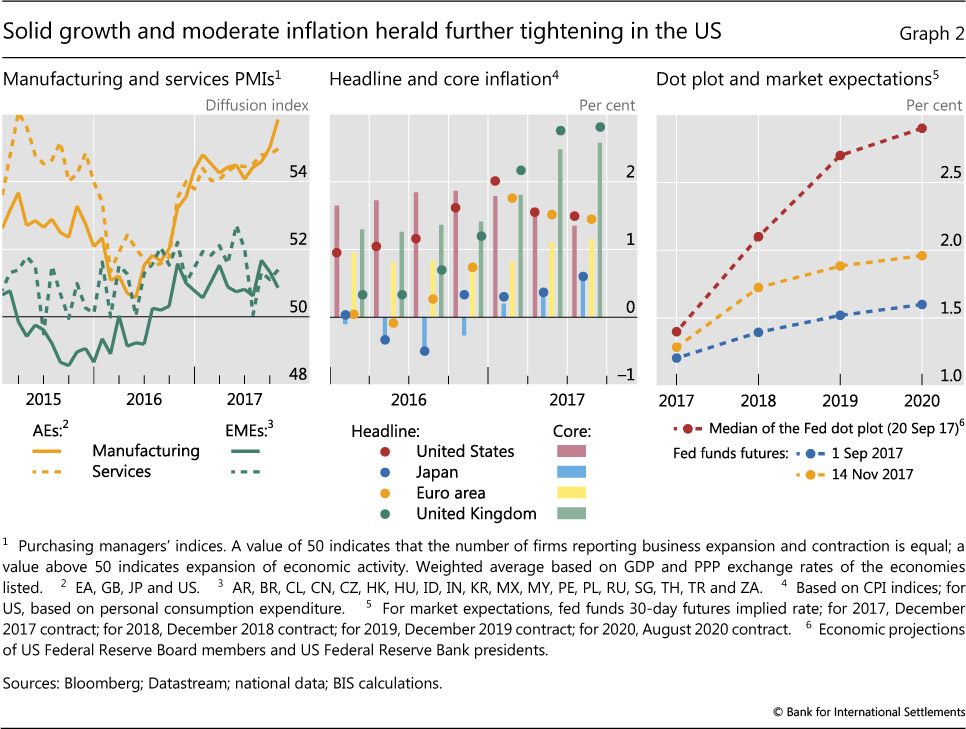
This remarkable performance was once again underpinned by strong economic data. Consumer confidence reached new highs in Germany, Japan and the United States, and stabilised in the United Kingdom (Graph 1, third panel). Growth continued to match or surpass expectations in both AEs and EMEs, and was broad-based. Consumption was strong, and capital expenditure picked up. A revival in trade contributed to the rebound in EME stock markets that had been under way since mid-2016 (Graph 1, fourth panel). Labour markets strengthened further in AEs, helped by the sustained expansion in both manufacturing and services (Graph 2, left-hand panel). Manufacturing activity was also solid, if not as buoyant, in EMEs.
Despite stronger activity, inflationary pressures remained remarkably subdued in most AEs. Inflation rose further above target in the United Kingdom, in the wake of last year's large currency depreciation, and edged up slightly in Japan while still remaining below target (Graph 2, centre panel). Core inflation continued to be weak in the euro area, even though headline inflation moved closer to target. The change in headline personal consumption expenditure stayed close to 2% in the United States, although the core measure softened as the year went by.
Against this backdrop, the Federal Reserve decided at its September meeting to start implementing in October the balance sheet normalisation plan it had announced in June. As a result, futures markets pointed with near certainty to an additional policy rate hike in December. At the same time, investors appeared to remain sceptical about the Federal Reserve's resolve to pursue the pace of policy rate increases implied by the median of FOMC members' "dot plot" forecasts. That said, the gap between those forecasts and market expectations narrowed (Graph 2, right-hand panel).
The triggering of balance sheet normalisation, combined with firming expectations of US corporate tax cuts, appeared to halt the US dollar's year-long slide. The currency appreciated almost 2% in trade-weighted terms from early September to end-November (Graph 3, left-hand panel). The dollar's gains were more sustained against EME currencies, while the remaining major currencies rebounded slightly towards the end of the period.
Subsequent moves by other central banks reinforced the dollar's strength. In October, the ECB extended the APP through September 2018 and reiterated that it expected policy rates to stay unchanged well past the end of net asset purchases. The ECB's Governing Council also announced it would scale down the pace of asset purchases from €60 billion to €30 billion a month, starting next January. But it declined to set an end date for the programme, and retained the option to increase its size and/or duration if macroeconomic conditions deteriorated. Finally, it emphasised that reinvestments would continue for an extended period after the net purchases ended. Markets took this set of decisions as a signal that the ECB intended to maintain an accommodative policy stance. The Bank of England raised its policy rate by 25 basis points to 0.50% on 2 November, as anticipated. Market commentary read the decision as a dovish signal, as the central bank revised its economic outlook downwards.
Major long-term government bond yields traded mostly sideways over the quarter (Graph 3, centre panel). The 10-year Treasury yield received a boost in early September when the beginning of balance sheet normalisation appeared certain, but its momentum fizzled out as the quarter progressed. The response was stronger at shorter tenors, with the two- year Treasury yield increasing about 50 basis points from early September (right-hand panel). Yields at both ends of the term structure barely moved in the euro area and Japan, underlining the overall stability of policy expectations. Only UK gilt yields shifted significantly upwards in late September, with term spreads staying roughly unchanged as short and long yields moved in lockstep.
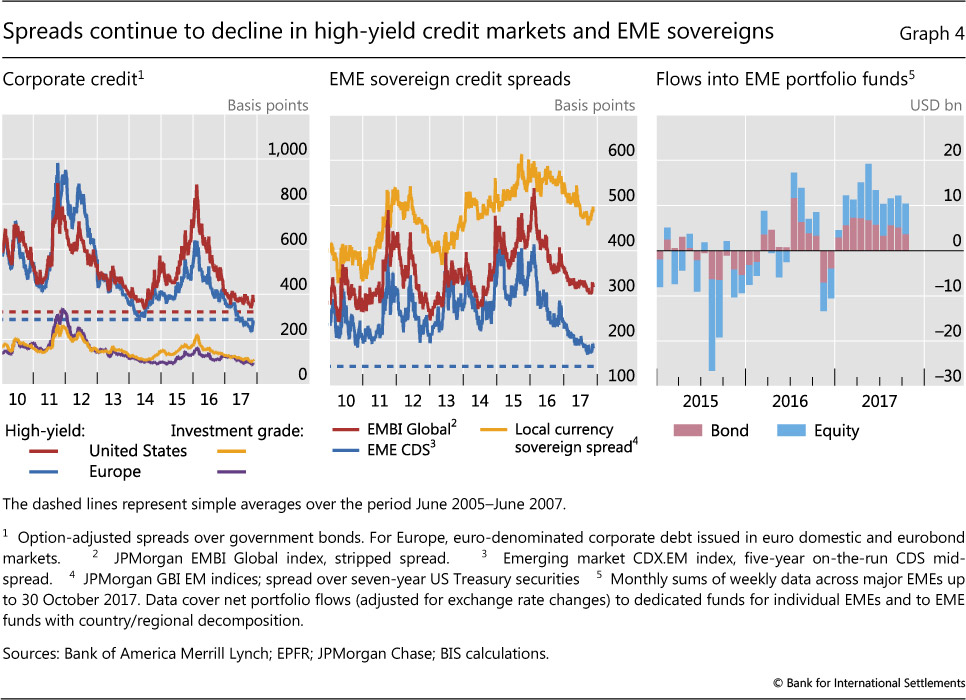
Corporate credit spreads continued to narrow, reinforcing the bullish message of equity markets. European high-yield corporate spreads widened the discount over comparable US spreads, helped by mid-November jitters in US high-yield. Before that, the US high-yield market had been plumbing spreads in the low 300s, a level breached only in the run-up to the 1998 Long-Term Capital Management crisis and again almost 10 years later just before the outbreak of the GFC. On the other side of the Atlantic, European high-yield spreads had been lower only occasionally during the period prior to 2007 (Graph 4, left-hand panel). The compression in investment grade spreads was less sharp but equally steady.
Sovereign spreads in EMEs (Graph 4, centre panel) had also been narrowing further until they were buffeted by the same anxieties that affected the US high-yield sector late in the period. Nevertheless, sovereign credit default swap (CDS) spreads were the lowest since the end of the GFC. The resilience in sovereign spreads and strength in equity markets have been buttressed throughout 2017 by sustained capital inflows (Graph 4, right-hand panel).
Overall, global financial conditions paradoxically eased despite the persistent, if cautious, Fed tightening. Term spreads flattened in the US Treasury market, while other asset markets in the United States and elsewhere were buoyant. We explore the potential reasons for this pattern in the next section.
An elusive tightening
Financial conditions have conspicuously eased in US markets over the last 12 months, despite the Federal Reserve's gradual removal of monetary accommodation. After raising the federal funds rate target range for the first time in almost 10 years in December 2015, the FOMC has taken several further steps in that direction. Since last December, it has raised the target range another three times, amounting to 75 basis points. Finally in October, it started the process of trimming its $4.5 trillion balance sheet, in a move for which it had been preparing financial markets at least since its March meeting.
Yet investors essentially shrugged off these moves. Two-year US Treasury yields have indeed risen by more than 60 basis points since December 2016, but the yield on the 10-year Treasury note has traded sideways (Graph 5, first panel).1 Moreover, the S&P 500 has surged over 18% since last December, and corporate credit spreads have actually narrowed, in some cases significantly. Overall, the Chicago Fed's National Financial Conditions Index (NFCI) trended down to a 24-year trough, in line with several other gauges of financial conditions.
In many respects, the current tightening cycle has so far been reminiscent of its mid-2000s counterpart. During the first year of that cycle, stock markets rose, while long-term Treasury yields and credit spreads dropped in the face of slightly more forceful Fed action (Graph 5, second panel). That said, the broad NFCI did see at least a small tightening then. At the time, Federal Reserve Chair Alan Greenspan had characterised the fall in long-term yields as a "conundrum".
The experience of these two episodes contrasts markedly with previous tightening cycles. In 1994, for example, the Fed's actions triggered sharply higher long-term yields, moderate stock market losses, wider credit spreads and a corresponding surge in the NFCI, pointing to a significant tightening of financial conditions (Graph 5, third panel).
The current market response in EMEs has also been more similar to the mid-2000s episode than to that of 1994. As the Fed removed accommodation this time round, financial conditions remained calm in EMEs. From December 2016, sovereign EME spreads (as measured here by the EMBI index) narrowed and EME currencies, on balance, appreciated moderately vis-à-vis the US dollar (Graph 5, fourth panel). Similar patterns had appeared in the first year of the mid-2000s tightening (fifth panel). In contrast, in 1994 the EMBI spread had widened by almost 800 basis points on the back of massive EME currency depreciation (sixth panel).
In all three cases, the dollar depreciated against major AE currencies, reflecting developments in the United States relative to those in other AEs. In the most recent episode, the dollar weakened for much of 2017 as economic prospects brightened in other regions (especially the euro area), recouping a portion of its previous losses in the past few weeks.
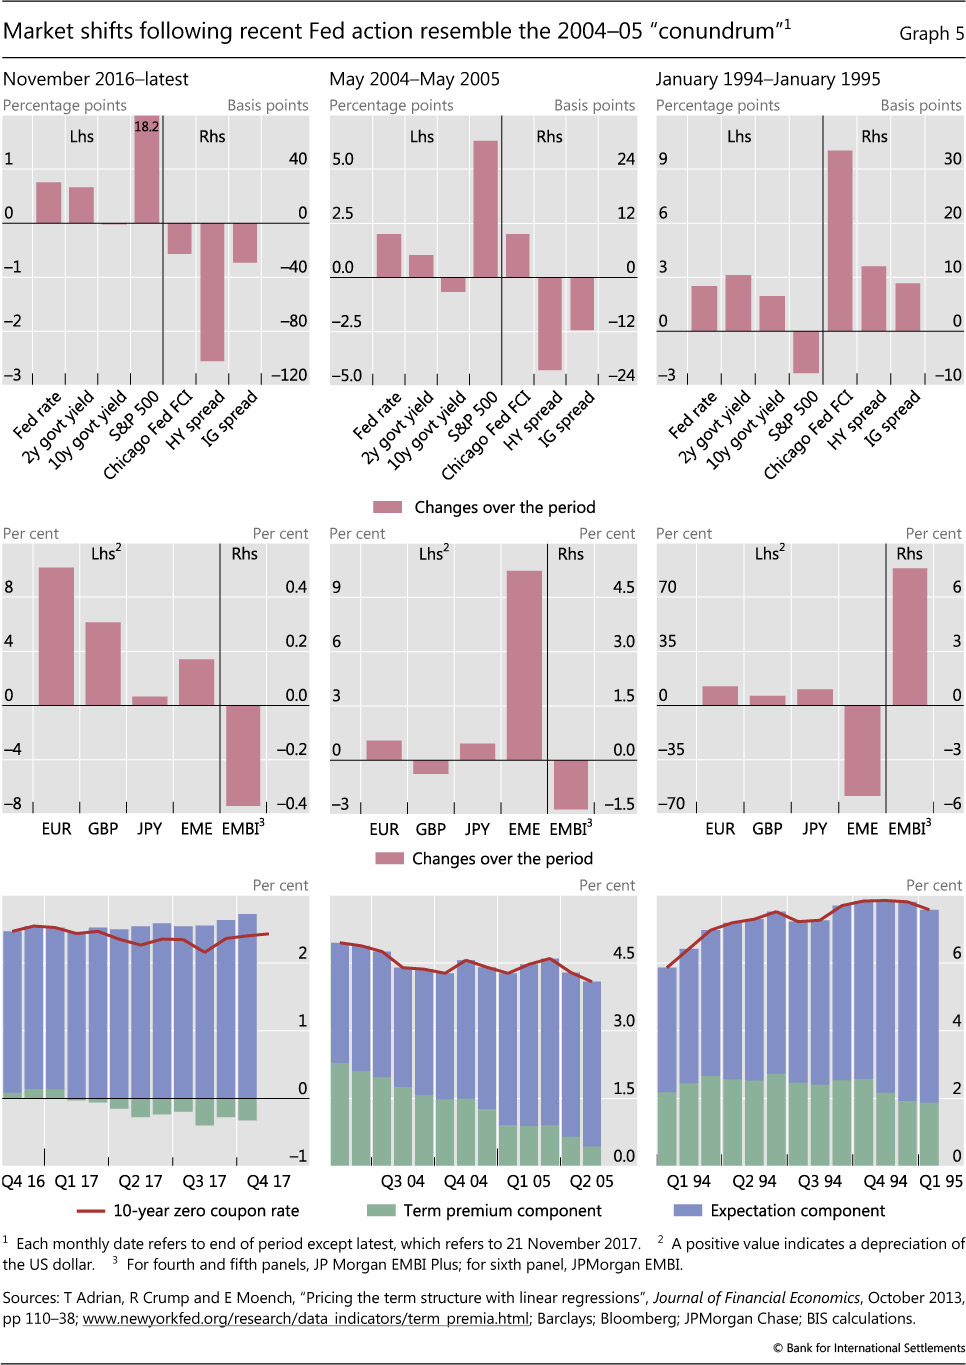
The evolution of the term premium underlies the different market outcomes across tightening episodes. A decomposition of 10-year US Treasury yields into a future rate expectations component and a term premium suggests that declining term premia drove long-term rates lower both now and during the mid-2000s "conundrum" episode. In both cases, the drop in estimated term premia more than offset the upward revision in expectations about the future path of short-term interest rates (Graph 5, seventh and eighth panels). In contrast, in 1994 the term premium initially increased very swiftly before stabilising and gradually declining later in the year. Nevertheless, the rising rate expectations component predominated (ninth panel). The recent decline in term premia is even more puzzling than in 2005, as the current balance sheet run-off process is specifically aimed at decompressing term premia that were squeezed by the large-scale asset purchases (LSAPs).
The difference between the last two episodes and that of 1994 reflects shifts towards greater gradualism and predictability in the Fed's tightening strategies. The Fed's moves in 1994 were steep and less thoroughly communicated to markets. By contrast, gradualism and predictability have characterised the current tightening cycle, with respect to both the policy rate and balance sheet adjustment.
Since December 2016, on average, market participants have been expecting policy rates to rise 40 basis points over the subsequent 12 months (Graph 6, yellow bars in the left-hand panel). While the mid-2000s hiking cycle also featured gradual expectations for rate increases, the 1994 tightening was rather aggressive. On average, the market expected the Fed to raise interest rates at a pace of 100 basis points a year starting in 2004 and 160 basis points in 1994.
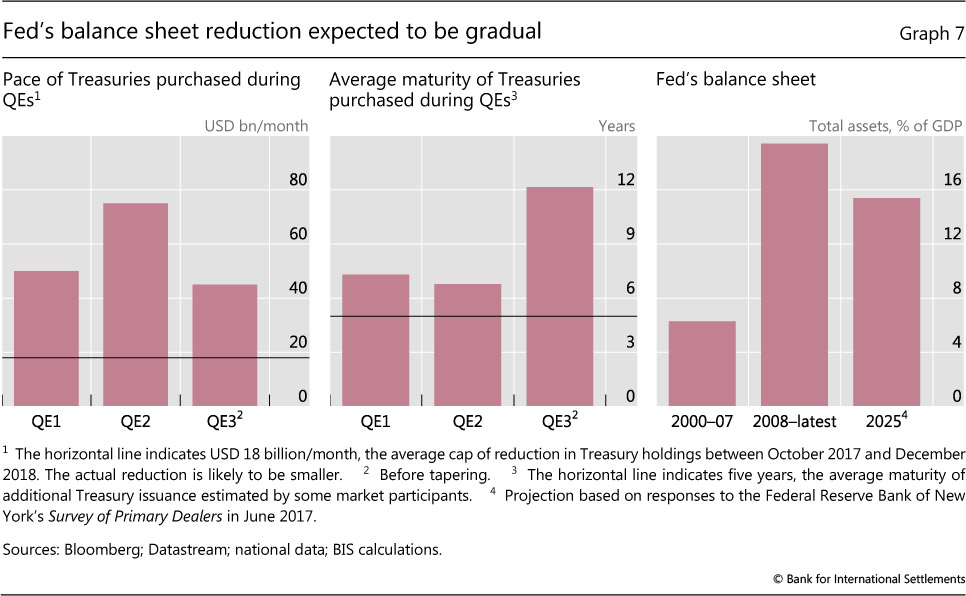
Gradualism also defined the programme announced in June for the balance sheet run-off. The planned reduction in Treasury securities holdings is less than $18 billion a month on average till the end of 2018. The pace at which holdings will fall is thus likely to be substantially slower than the pace of net Treasury purchases during the LSAP programmes, which ranged from $45 billion to $75 billion a month (Graph 7, left-hand panel). Investors also expected that the resulting increase in duration supplied to the private sector would be modest, at least initially. Some market participants have estimated that the instruments issued by the Treasury to offset the Fed's reduced reinvestments would have shorter maturities than those that the LSAPs had originally taken out of the market (centre panel).2 In addition, there is a growing consensus among market participants that the Fed's ultimate balance sheet target size will be much larger than before the GFC. For instance, primary dealers surveyed in June by the Federal Reserve Bank of New York forecasted a balance sheet size of around 15% of GDP as of 2025, compared with the 6% prevailing pre-crisis (right-hand panel).3
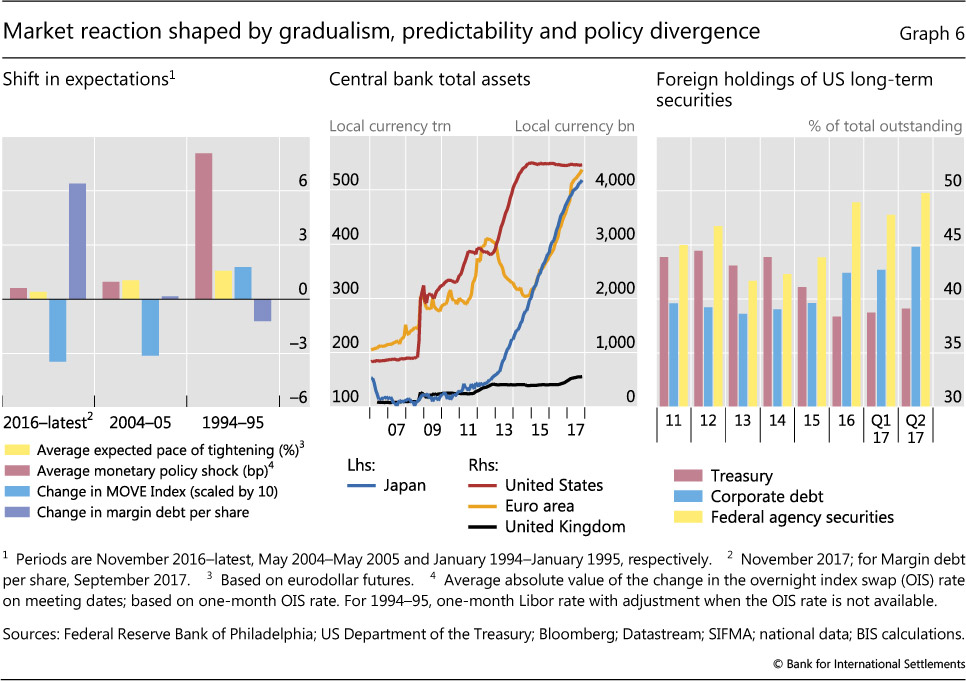
In addition to being perceived as gradual, policy decisions in the current cycle were well anticipated. Little or no additional market information was transmitted by the actual policy rate decisions. Measured by the absolute value of daily change in short-term interest rates on policy rate decision days, the surprise was less than 1 basis point on average (Graph 6, red bars in the left-hand panel). Consistent with this, uncertainty about future interest rates, as measured by the MOVE index, was well contained and actually decreased during the course of tightening (blue bars in the left-hand panel). The balance sheet policy was also carefully and extensively communicated. For example, before the Fed announced the effective beginning of the normalisation process at the September 2017 FOMC meeting, 87% of primary dealers surveyed in September by the New York Fed had already anticipated the announcement.
While rate hikes in 2004 featured similar predictability, the Fed took market participants by surprise in 1994. In the 2004 episode, short-term interest rates moved only around 1 basis point on average on days when the Fed raised the interest rate. The MOVE index declined accordingly. In comparison, short-term interest rates moved by more than 8 basis points on decision days; and the MOVE index rose further as the Fed proceeded with tightening in 1994.
Gradualism and predictability may have contributed to the easing of financial conditions. In the absence of imminent inflationary pressures, such as those prevailing in 1994, in the two more recent episodes the Fed's gradual approach may have supported investors' beliefs that the central bank would not risk impairing growth and damaging valuations. That may have compressed risk premia by reducing perceived downside risks. Moreover, research has investigated the various ways in which predictable central bank actions, by removing uncertainty about the future, can encourage leverage and risk- taking.4 Indeed, while investors cut back on the margin debt supporting their equity positions in 1994, and stayed put in 2004, margin debt increased significantly over the last year (Graph 6, purple bars in the left-hand panel).
The relatively accommodative stance of other major central banks may also have supported easier financial conditions in the current cycle. Central bank balance sheets have continued to expand while yields and term premia have remained low in most of the major AEs (Graph 6, centre panel). As a result, despite the Fed's move towards tightening, the global search for yield has supported buoyant asset prices in the United States. For instance, the growth in the share of US long-term securities held by foreigners, notably corporate debt and federal agency securities, increased in the second quarter of 2017, after a respite earlier in the year (right-hand panel).
High valuations: market complacency?
Tentative moves towards monetary policy normalisation have revived long-standing concerns about asset valuations. Market commentary has increasingly focused on the degree of asset price inflation that unconventional monetary policies may have instilled in different asset classes. Stock market valuations have come under particularly close scrutiny. As the mid-November sell-off illustrated, the spreads on corporate high-yield and sovereign EME bonds have also become more vulnerable to sudden swings in market sentiment. At the root of these uncertainties are questions about how the compression of term premia in core sovereign bond markets may affect other asset valuations. There is also significant uncertainty about the levels those yields will reach once monetary policies are normalised in the core jurisdictions.
According to traditional valuation gauges that take a long-term view, some stock markets did look frothy. At its recent levels in excess of 30, the cyclically adjusted price/earnings ratio (CAPE) of the US stock market exceeded its post-1982 average by almost 25%, comfortably sitting in the highest quartile of the distribution (Graph 8, top left-hand panel). Admittedly, this is still short of the extraordinary peak of 45 reached during the dotcom bubble of the late 1990s. But it is almost twice the long-term average computed over the period 1881- 2017. While the available series do not stretch as far back for European and UK equities, their CAPEs were at their post-1982 averages. Meanwhile, the CAPE for Japanese equities was less than 50% its available long-term average. Price/dividend ratios conveyed a similar message.
At the same time, dividends per share of US equities have been growing at a much faster rate since the GFC, giving rise to questions about long-term sustainability (Graph 8, red line in the top right-hand panel). This is because the faster growth was supported in part by a significant shift in corporates' dividend policy. The share of net income paid out in dividends has increased by more than half over the last five years (blue line in the top right-hand panel). The dividend payout ratio is back to the relatively high levels observed in the 1970s, and thus may be approaching an upper bound. High dividends per share were also supported by stock repurchases. Except for a short interlude in 2008-09, share repurchases have been very large since the early 2000s (bottom left-hand panel). When and if interest rates begin to rise, corporates may have the incentive to tilt their capital structure back to equity, or at least to reduce stock repurchases, which could raise further questions about stock market valuations.
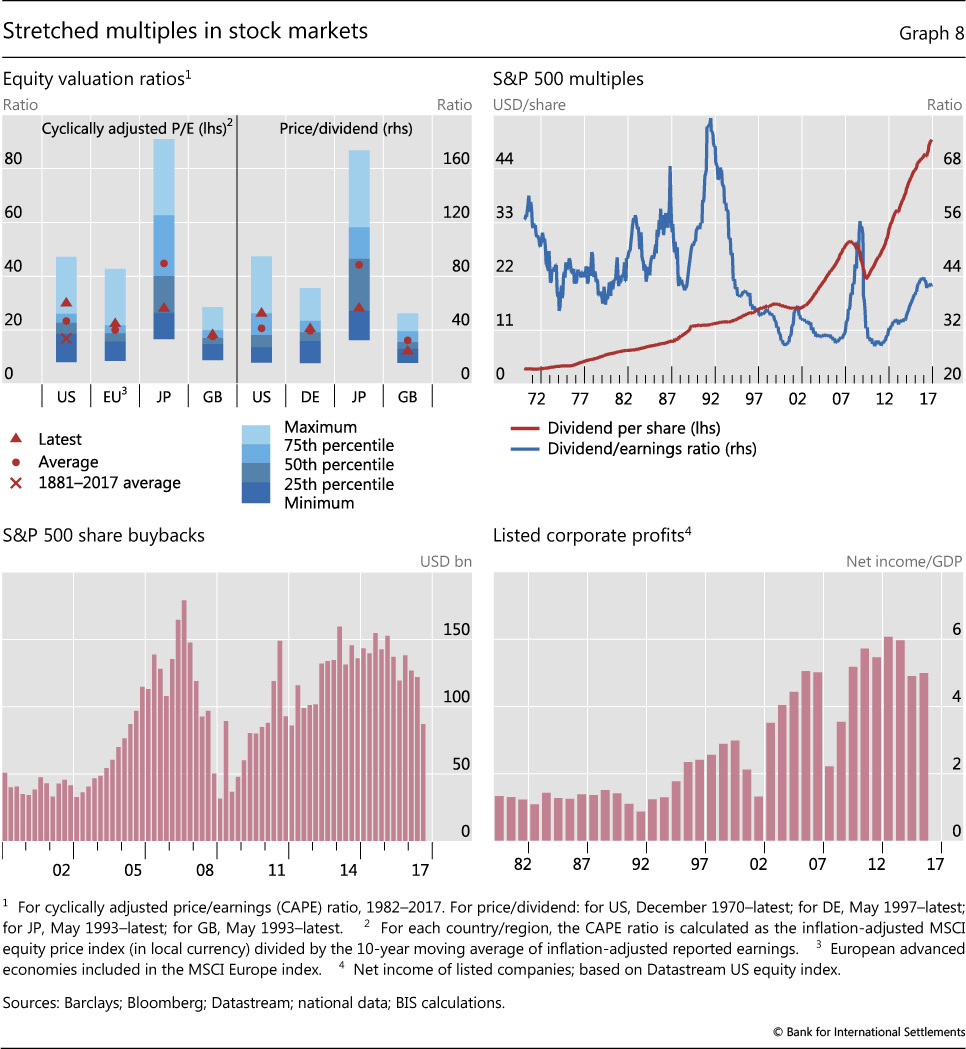
Moreover, the upward potential for dividend growth may be limited. Listed corporates' net income has grown rapidly, in fact much more rapidly than US GDP, since the mid-1990s: the ratio of corporate net income to GDP rose from an average of 1.5% in the 1980s to 5.5% by the mid-2000s, and has fluctuated around that level ever since (Graph 8, bottom right- hand panel). If net income continued growing at this more modest pace, in lockstep with nominal GDP, corporations would not be able to continue growing dividends at current rates while keeping payout ratios constant.
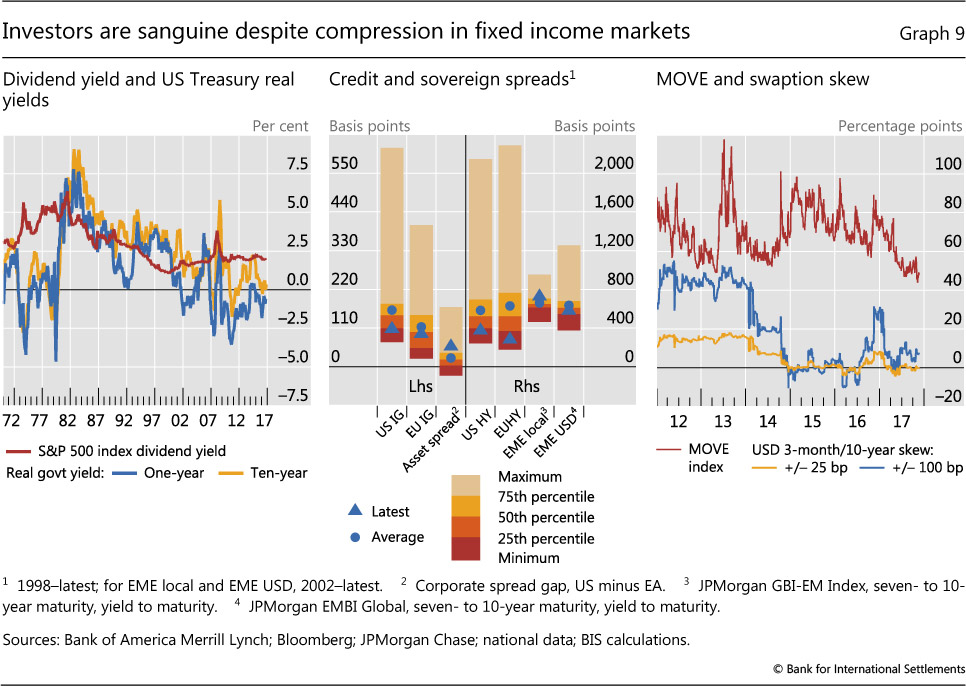
Stock market valuations looked far less frothy when compared with bond yields. Over the last 50 years, the real one- and 10-year Treasury yields have fluctuated around the dividend yield (Graph 9, left-hand panel). Having fallen close to 1% prior to the dotcom bust, the dividend yield has been steadily increasing since then, currently fluctuating around 2%. Meanwhile, since the GFC, real Treasury yields have fallen to levels much lower than the dividend yield, and indeed have usually been negative. This comparison would suggest that US stock prices were not particularly expensive when compared with Treasuries.
Can central counterparties (CCPs) reduce repo market inefficiencies?
Repo markets have taken on an increasingly important role in global money markets since the Great Financial Crisis as unsecured borrowing has dwindled. But repo markets remain segmented. In the United States, there has been a persistent spread between general collateral financing (GCF) and triparty repo rates. Ultimate borrowers that cannot access the triparty market face higher costs. Money market funds (MMFs) that cannot access the delivery-versus-payment (DvP) or GCF markets to lend cash increase their take-up of the Federal Reserve's overnight reverse repurchase (ON RRP) facility, which pays a lower rate. Moreover, the retreat of dealers from repo markets at quarter-ends generates spikes in both prices and volumes: both GCF rates and the take-up of repos by MMFs under the ON RRP increase at quarter-ends (Graph A, left-hand panel).
Against this background, an important recent development is a rule change by The Depository Trust & Clearing Corporation (DTCC), approved by the Securities and Exchange Commission in May. This change allows DTCC's subsidiary, the Fixed Income Clearing Corporation (FICC), to expand the availability of clearing in the repo market to a broader set of institutional investors. Through this rule change, MMFs can provide cash or securities in the DvP markets through a dealer sponsor.
Some MMFs have already started clearing repos through the FICC. The total amount of centrally cleared repos stood at $13 billion at end-October 2017 (Graph A, centre panel). The volumes are still small compared with the total volumes in the triparty market or even compared with other funds belonging to the same fund family. But they have been growing rapidly. Centrally cleared repos made up close to 6% of the total repo volumes of the three fund families that cleared repos through the FICC in October 2017.
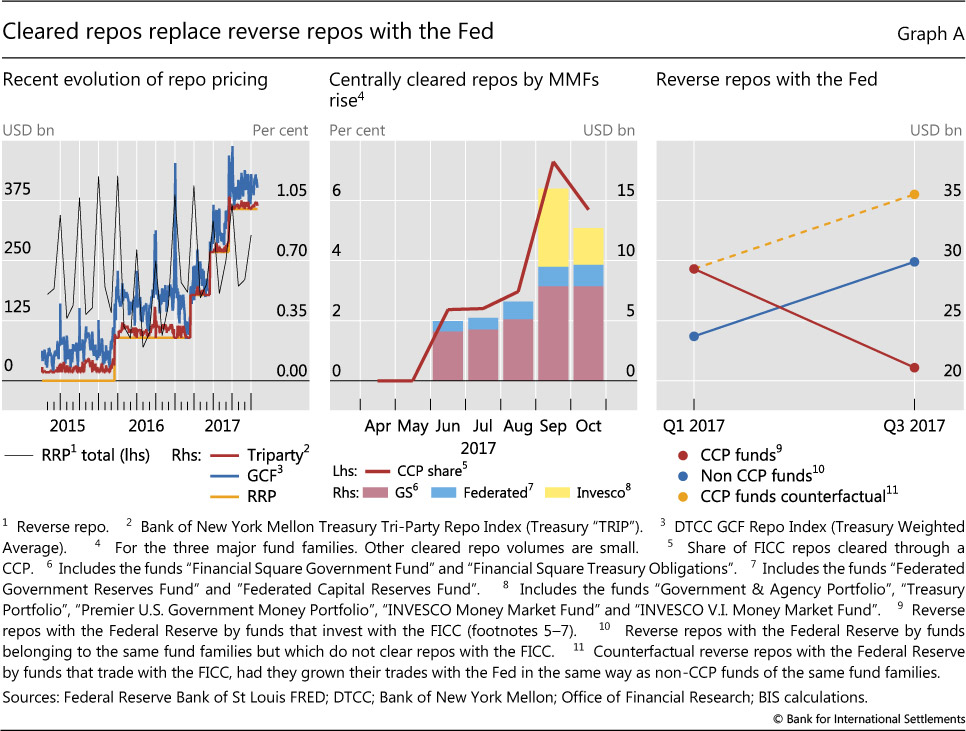
The initial response by the MMFs that clear repos through the FICC suggests that central clearing could potentially reduce market segmentation. There are already signs of convergence of prices, as centrally cleared repo trades earned up to 12 basis points more than the triparty rate index. Furthermore, funds that cleared trades through the FICC reduced their end-of-quarter take-up of the ON RRP compared with their peer funds (Graph A, right-hand panel). If these funds had instead increased their reverse repos with the Fed at the same rate as their peers, Fed RRPs at end-September 2017 would have been around $35 billion instead of the actual and much lower volume of $21 billion.
Source: SEC N-MFP filings.
Some froth was also present in corporate credit markets even in relation to core sovereign bonds. Credit spreads appeared to be rather compressed, especially in the high-yield space. Looking at the last 20 years of data, both US and European investment grade corporate spreads were below their long-term averages (Graph 9, centre panel). In the high-yield segment, European spreads almost touched their all-time lows, whereas US spreads were only at the door of the lowest quartile of the distribution. The US dollar-euro spread differential, which is itself near its maxima outside stress situations, has contributed to the recent expansion in issuance of euro-denominated paper by US corporates.5
In contrast, EME sovereign bond markets looked to be within their historical average ranges. Spreads in both local currency and the US dollar were relatively closer to their historical averages, going back to the early 2000s (Graph 9, centre panel). Spreads on local currency-denominated government debt are actually above the 15-year average. Compression is more visible in US dollar-denominated issues, with EMBI Global spreads sitting about 65 basis points below the long-term mean, in the second lowest quartile of the distribution. In the past, very low spreads in US high-yield and EME dollar sovereign bond spreads were a harbinger of stress.
In spite of these considerations, bond investors remained sanguine. The MOVE index suggested that US Treasury volatility was expected to be very low, while the flat swaption skew for the 10-year Treasury note denoted a low demand to hedge higher interest rate risks, even on the eve of the inception of the Fed's balance sheet normalisation (Graph 9, right-hand panel). That may leave investors ill-positioned to face unexpected increases in bond yields.
1 In fact, after the Fed's December hike and during most of 2017, the 10-year Treasury yield had been slowly drawing away from the level reached after the post-US election jump, reflecting in part the fading expectations of fiscal stimulus. The response to the anticipated start of the balance sheet run-off somewhat reversed that fall.
2 The Treasury's recent announcement that it would keep the size of its auctions of notes and bonds unchanged up to the end of the first quarter of 2018 appeared to validate such expectations. To compensate for the lost funding from the Fed's diminished rollover, the Treasury would change the auction sizes of bills and/or cash management bills, which have maturities of up to one year.
3 The forecasted size is conditional on not hitting the zero lower bound (ZLB) again at any point between now and the end of 2025. Given the non-negligible chance of moving back to the ZLB, as perceived by the primary dealers, the unconditional forecasted size is likely to be even larger.
4 See C Borio and H Zhu, "Capital regulation, risk-taking and monetary policy: a missing link in the transmission mechanism", Journal of Financial Stability, vol 8, issue 4, December 2012, pp 236-51; and V Bruno and H S Shin, "Cross-border banking and global liquidity", Review of Economic Studies, vol 82, April 2015, pp 535-64.
5 This is one of the factors that appear to underlie the persistent breakdown of covered interest rate parity. See C Borio, R McCauley, P McGuire and V Sushko, "Covered interest parity lost: understanding the cross-currency basis", BIS Quarterly Review, September 2016, pp 45-64.