What is driving the renewed increase of TARGET2 balances?
(Extract from page 7 of BIS Quarterly Review, March 2017)
Raphael Auer and Bilyana Bogdanova
TARGET2 (T2) balances are again on the rise. Since early 2015, the T2 balances of euro area national central banks (NCBs) have risen steadily, in some cases exceeding the levels seen during the sovereign debt crisis (Graph A, left-hand panel). However, unlike then, record T2 balances should be viewed as a benign by- product of the decentralised implementation of the asset purchase programme (APP) rather than as a sign of renewed capital flight.
Because liquidity operations in the Eurosystem are decentralised, claims or liabilities of NCBs vis-à-vis the ECB can arise. Market operations are to a large extent implemented by the Eurosystem's NCBs rather than by the ECB. When an NCB disburses liquidity directly to commercial banks, it keeps the claims on those commercial banks on its own balance sheet. But the funds may end up in another commercial bank's account with a different NCB. As a consequence, the liquidity-providing NCB has a liability vis-à-vis the ECB, while the NCB receiving the reserves holds a claim on the ECB.
The net of such claims and liabilities is referred to as a "TARGET2 balance" because it is recorded as such in the main payment settlement system of the euro area, the second edition of the Trans-European Automated Real-time Gross Settlement Express Transfer System.
In the period leading up to mid-2012, T2 balances grew strongly (Graph A, left-hand panel) due to intra-euro area capital flight. At the time, sovereign market strains spiked and redenomination risk came to the fore in parts of the euro area. Private capital fled from Ireland, Italy, Greece, Portugal and Spain into markets perceived to be safer, such as Germany, Luxembourg and the Netherlands.
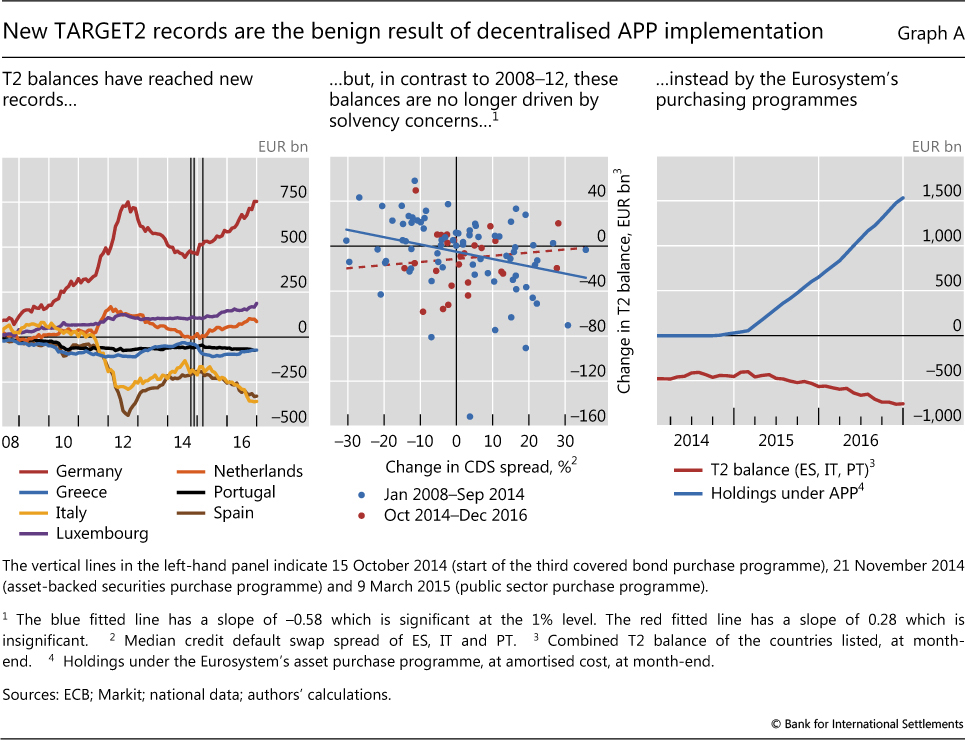
Indeed, during that period, the rise in T2 balances seemed related to concerns about sovereign risk. The blue dots in the centre panel of Graph A show the close relationship between the sovereign credit default swap (CDS) spreads of Italy, Portugal and Spain and the evolution of their combined T2 balance from January 2008 to September 2014. Whenever the CDS spreads of those economies rose, the associated private capital outflows increased their T2 deficit. When the CDS spreads decreased after confidence in the euro area was restored in mid-2012, the capital outflows partly reversed, and T2 deficits dwindled.
In contrast, the current rise seems unrelated to concerns about the sustainability of public debt in the euro area. The red dots in the centre panel of Graph A show that, between October 2014 and December 2016, there was no relationship between the sovereign CDS spreads of Italy, Portugal and Spain and the evolution of their combined T2 balance.
The current rise in T2 imbalances seems to have a different cause: the Eurosystem's APP, which mechanically affects the evolution of these balances. Many APP purchases are conducted by NCBs via banks located in other countries. One example is where the Bank of Italy, as part of its implementation of the APP, buys securities from a London-based bank that connects to the T2 system via a correspondent bank located in Germany. The purchase amount is credited to the account of the German correspondent bank at the Deutsche Bundesbank, thus increasing the T2 surplus of the Bundesbank. Similarly, the Bank of Italy's T2 deficit widens.
Thus, T2 imbalances will increase whenever any T2-debtor NCB conducts an asset purchase with a counterparty that has a correspondent bank located in a T2-creditor NCB. This is very frequently the case. For example, whereas the Bundesbank itself purchases less than a quarter of the total APP purchases, 60% of all Eurosystem purchases under the APP are conducted via banks that connect to the T2 system via the Bundesbank.
As the European interbank market is still fragmented, the liquidity does not circulate in the euro area and T2 imbalances grow as the total holdings under the APP accumulate. Indeed, the overall increase in T2 imbalances can be linked closely to the total purchases under the APP (Graph A, right-hand panel). A recent study, which takes into account the precise geography of the correspondent banks of each and every APP security purchase, shows that APP transactions can almost fully account for the re-emergence of T2 imbalances.
This mechanical impact of the APP on T2 imbalances is also confirmed by the evolution of T2 balances vis-à-vis Greece. The country's sovereign bonds are not eligible for the APP, and consequently the Greek T2 deficit has actually been more or less stable during recent months (Graph A, left-hand panel).
For a detailed description of this system and the origins of T2 imbalances during the European debt crisis, see R Auer, "What drives TARGET2 balances? Evidence from a panel analysis", Economic Policy, vol 29, no 77, 2014, pp 139-97; ECB, "TARGET balances and monetary policy operations", Monthly Bulletin, May 2013; and S Cecchetti, R McCauley and P McGuire, "Interpreting TARGET2 balances", BIS Working Papers, no 393, December 2012. See C-L Thiele, "Das Netz der Notenbanken", Handelsblatt, 7 February 2017. See ECB, "TARGET balances and the asset purchase programme", Economic Bulletin, November 2016.