Does using aggregate information to construct aggregate DSRs introduce distortions?
(Extract from pages 94-95 of BIS Quarterly Review, September 2015)
This box analyses how sensitive our approach is to aggregation assumptions. We start by showing that aggregate amortisation can indeed be estimated by assuming that the outstanding stock of debt is repaid in equal instalments, even though credit contracts are structured in a multitude of fashions at the micro level. Since the instalment loan formula is non-linear, however, the use of aggregates for the interest rate, the average remaining maturity, the debt stock and income will distort the picture relative to what one might obtain if one had access to more granular data. We show in this box that this distortion is relatively constant even when underlying inputs change. This indicates that our approach may lead to a potential misestimation of the level of the DSR, but generally have little influence on dynamics.
To assess potential aggregation effects, we simulate a debt stock consisting of 1,000 artificial loans that differ in size, interest rate, average remaining maturity and income of the borrower. All input variables are random. In the base case, debt-to-income ratios average 150%, interest rates 5% and average remaining maturities 15 years. The distributions of these variables across loans are calibrated in such a way that the resultant distribution of individual debt service ratios in the base case is very similar to the distribution of household debt service ratios in Canada and the United States.
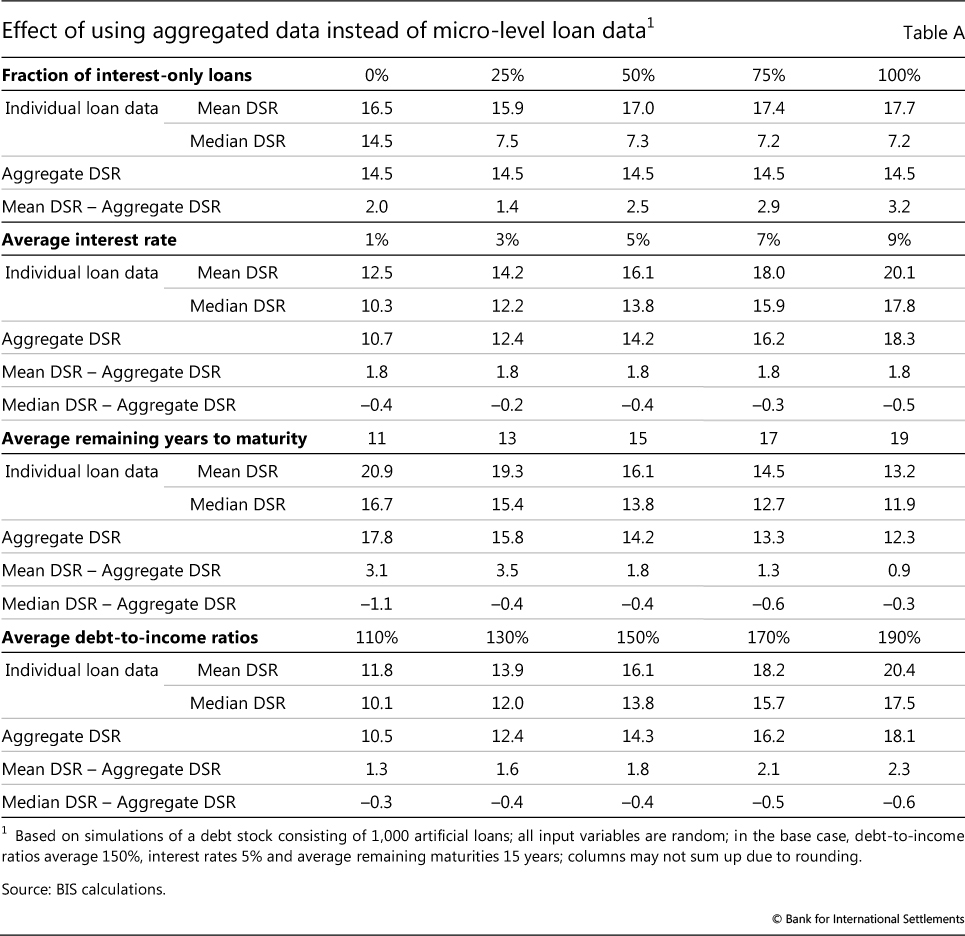
The simulation highlights that, while our methodology produces an approximation error, this is little related to the instalment loan assumption. To check the validity of this assumption, we let the fraction of instalment loans vary between zero and 100%. The remaining loans in this case are interest-only loans, of which only 1/15 involve repaying the principal in each period, in line with an assumption that the average remaining maturity is 15 years. The upper panel of Table A shows the difference between using micro data and relying on aggregate data plus the instalment loan formula. On average, the two approaches differ by around 2.5 percentage points. But this difference varies only between 1.4 and 3.2 percentage points depending on our assumption about the share of interest-only loans.
 This variation is small, especially given that the composition of the loan portfolio is unlikely to change to such a degree within a particular country. As such, it indicates that the instalment loan assumption works well for constructing aggregate DSRs.
As discussed in the main text, while the main source of approximation error arises from the use of aggregate information, this more likely distorts the estimated mean of the DSR than its dynamics. In particular, the size and direction of this error remain fairly constant, as the overall levels of interest rates, debt-to-income ratios or maturities change. In the base case (average debt-to-income ratio = 150%, average interest rate = 5% and average remaining maturity = 15 years), the average DSR of the individual loans is 16.1%, which is 1.9 percentage points higher than the estimated DSR of 14.2%. If interest rates on average increase to 9%, the average DSR of individual loans rises to 20.1% and the estimated DSR rises to 18.3%, but the estimation error remains approximately the same, at 1.8 percentage points. Similar results emerge for changes in the average remaining maturity or debt-to-income ratios. Interestingly, the approximation error is even lower if we compare the estimated DSR with the median of the individual data. In any case, note that the ranges of the input parameters in this simulation are rather large. For instance, we simulate debt-to-income ratios from 110% to 190%, but it took around 20 years for the debt-to-income ratio for the total private sector in the United States to increase from 110% to 150%. Similarly, an increase in the average remaining maturity from 15 to 19 years (we simulate remaining maturities between 11 and 19 years) would require a doubling of the average remaining maturity on more than 25% of the outstanding loans, which is not likely to happen. The characteristics of the loan stock are thus likely to be relatively stable over time. This argues for the accuracy of the aggregate approach for estimating DSRs.
Based on the Consumer Expenditure Survey, Johnson and Li (2010) report the following distribution of household debt service burdens in the United States from 1992 to 2004: 6% (20th percentile), 12% (40th percentile), 19% (60th percentile) and 28% (80th percentile). Calculating debt service burdens based on an instalment loan formula, the corresponding values in our sample are 2% (20th percentile), 10% (40th percentile), 17% (40th percentile) and 27% (80th percentile). The simulated distribution also broadly matches the distribution and main statistics of household DSRs in Canada from 1999 to 2000 (Faruqui (2008)). When checking the instalment loan assumption, we increased the sample size to 30,000, to avoid small-sample problems, when the fraction of interest-only loans that repay the principal is low. The median drops rapidly with the fraction of interest-only loans by construction, as 14/15 of the interest-only loans are not amortised at all.