A new database on general government debt
We present a new data set on credit to the general government sector for 26 advanced and 14 emerging market economies. The main benefit of these new BIS series for "public debt" is that they provide data with similar characteristics from across the globe, facilitating cross-country comparisons. Another distinctive feature is that the data set contains series expressed in both nominal and market value terms, allowing for a wide range of analyses. Lastly, the statistical concepts are identical to those underlying the BIS data set on credit to the private non-financial sector, published since 2013. Taken together, the data sets can thus provide a useful picture of the aggregated indebtedness of all non-financial sectors.1
JEL classification: C82, E51.
The need to monitor public indebtedness has gained importance since the Great Financial Crisis of 2007-09. One reason is the massive increase in public borrowing in many advanced economies, which raises questions about the sustainability of public debt. Another is the growing recognition that the interplay of public and private debt matters for macroeconomic outcomes and financial stability. Both considerations strengthen the case for statistics that comprehensively and consistently measure government borrowing over time and across countries.
Against this background, the BIS has built up a new data set on credit to the government sector, with a focus on cross-country and cross-sector comparability as well as series that extend as far back in time as possible. Produced in liaison with national central banks, these "public debt"2 time series provide information that is complementary to existing fiscal databases. First, cross-country comparisons are facilitated by the homogeneity of the data and the broad country coverage. Second, because the data are comparable conceptually with the other indicators published by the BIS on credit to the private sector,3 this consistency4 allows an aggregated picture of the indebtedness of the non-financial sector as a whole (published as an additional data set) to be presented. Third, the new data set provides relatively long time series on fiscal positions and at a high frequency (quarterly); this type of information has not previously been easily available on a cross-country basis. Fourth, government debt data are shown at both nominal and market value, thus facilitating complementary types of analysis on the risks, exposure and behaviour of debtors as well as creditors. Finally, the data set is presented with extensive metadata: the related national sources and country specificities are listed in the documentation available on the BIS website.5 The new data set currently covers 40 countries (26 advanced economies including the euro area and 14 emerging market economies), on a quarterly basis, and at both market and nominal value. Each indicator is available in three versions: in local currency, in US dollars and as a percentage of GDP.
This article reviews the main features of existing data sources on government indebtedness and describes the new BIS series, highlighting their advantages vis-à-vis publicly available sources. The last two sections show how the unique features of the new data set - the availability of comparable data with two valuation methods (at nominal and at market value) and the possibility of assessing total credit to the non-financial sector - can be usefully applied for analytical purposes.
Measuring government debt across countries
Approaches for computing fiscal data can vary significantly across countries. These differences often reflect the features of each national fiscal framework and the variety of debt instruments used by governments as well as specific accounting systems. The result has been a variety of statistical concepts and practices, in particular on how to define the government sector's perimeter and identify debt instruments, but also on consolidation and valuation.
Specifically, the main discrepancies in the reporting of government debt figures relate to the following dimensions:6
(1) Sector coverage, ie which subsectors are included (eg public enterprises, subnational authorities such as states or regions, social security funds).
(2) Instrument coverage, ie which financial instruments are included in government liabilities.
(3) Consolidation, ie whether or not the government subsectors are presented as a whole (accounts are consolidated when the government's assets and liabilities are booked as a single entity and the claims of one subsector on another subsector are netted out).7
(4) Netting, ie whether the data refer to government liabilities net of government assets, or are presented on a gross basis.
(5) Valuation method: the System of National Accounts 2008 (2008 SNA; see European Commission et al (2009)) recommends valuing liabilities (except loans) at market value whenever possible,8 while nominal values9 can also be reported as a complement. However, practices differ markedly across and even within data sets.
In addition, most existing cross-country government debt data sets are published annually, which does not facilitate the monitoring of intra-year and recent developments.
These factors have tended to complicate the task of making cross-country fiscal comparisons. A number of international initiatives are under way to improve the government debt statistics produced by national authorities. The same applies to the widely used international statistics compiled, for instance, by a number of international organisations. Significant methodological efforts have led to the publication of manuals on government debt statistics, especially under the aegis of the IMF, the World Bank and the OECD (eg IMF (2000, 2014), BIS et al (2011)). Further efforts are in train to improve international measures of government debt, particularly in the context of the Data Gaps Initiative endorsed by the G20 (IMF-FSB (2009)).
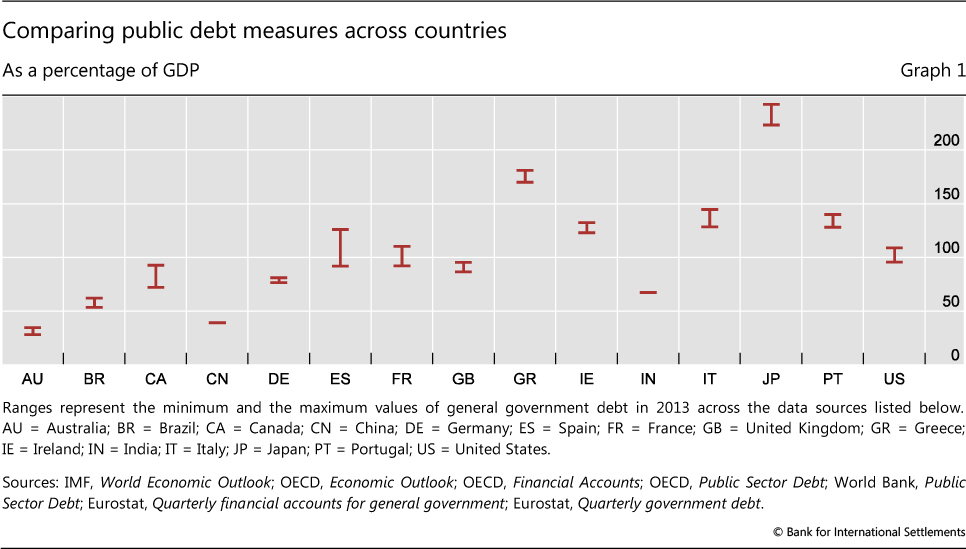
Owing to differences in statistical approaches, government debt estimates for a given country can vary substantially (Graph 1 and Box 1; see also Bloch and Fall (2015)). For example, estimates for Canada's government debt-to-GDP ratios differ by more than 20 percentage points of GDP, depending on the data set. On average across countries, this range is more than 10 percentage points of GDP, a difference that amounts to some $1.5 trillion for the sum of the sample countries. Significant inconsistencies can obtain within the same data sets, especially when data based on differing concepts (eg as regards coverage, valuation or consolidation) are used to extend their country coverage.
Features of the new BIS data set
The main aim of the BIS government debt data set is to facilitate cross-country comparisons by focusing on credit to the general government, defined as "core debt" - a narrow but simple and consistent concept of what constitutes government liabilities (Box 2).10
To facilitate comparisons, the BIS data have the following features:
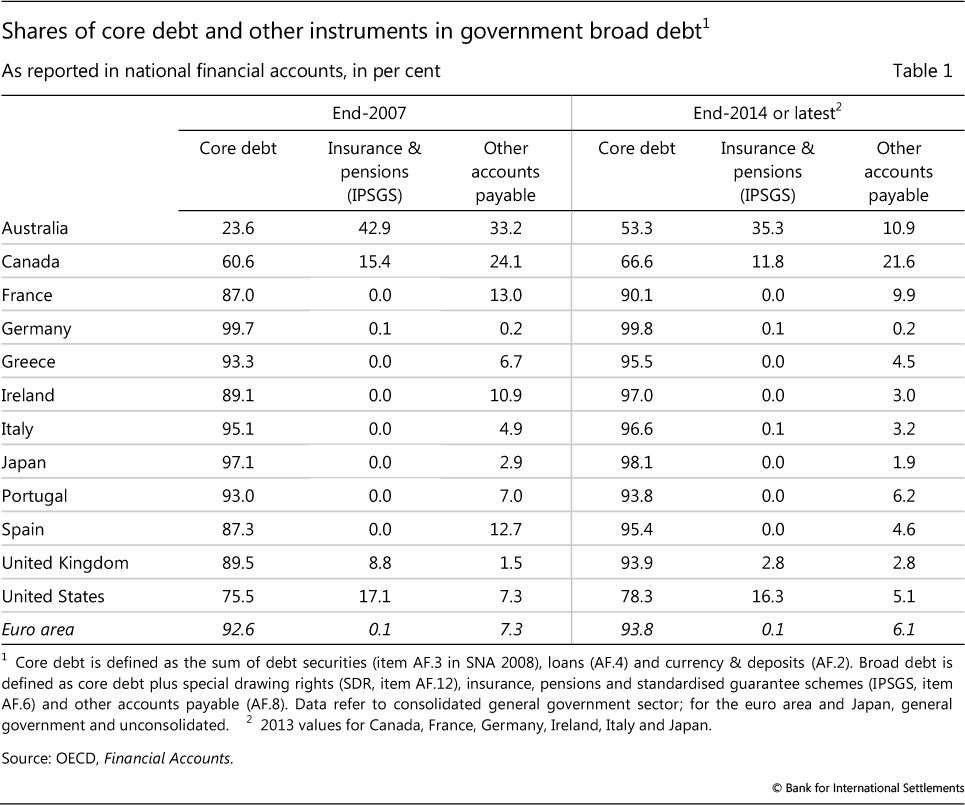
(1) Only core debt instruments are included, defined here to comprise (i) loans; (ii) debt securities; and (iii) currency & deposits (this third category being in general quite small). These three instruments generally represent the bulk of government total debt. Table 1 shows the share of this core debt in the total gross debt of selected countries, as well as the shares of two important debt instruments outside core debt.11 This simple approach facilitates international comparisons, given that the quality of the non-core debt instrument estimates can vary substantially across data sources and countries. Moreover, it also makes the BIS government debt data set consistent with the BIS data set on credit to the private non-financial sector.
(2) Credit is reported for the general government sector, comprising central, state and local governments and social security funds. As with most internationally available databases, public enterprises are excluded, as they do not belong to the general government sector but to the financial or non-financial corporate sectors.
(3) Claims and liabilities between government entities are netted out, ie the debt of the general government sector is presented on a consolidated basis.
(4) Liabilities are reported on a gross basis, and not net of government assets.
Box 1
Why do government debt figures differ so widely across data sets?
Burcu Erik
The wide variations in government debt figures produced by different statistical agencies can arise in several ways. These include differences in how agencies treat the structure of the government sector and consolidate its accounts, in accounting practices, in the types of activity undertaken by the government, and in the country's macroeconomic and financial conditions. In this box, we show how government debt figures produced for selected countries may be affected by differences along four of the five dimensions highlighted in this special feature: consolidation, valuation, instrument coverage and the sectoral perimeter (Table A).
Consolidation among general government institutions provides a simplified view of the government sector's overall debt obligations, by eliminating intrasector transactions and positions. Depending on the government's structure, the impact of consolidation on government debt in 2013 (keeping all other dimensions constant) is estimated to range from 26 percentage points of GDP, as in the case of Portugal, to just 1 percentage point for Germany.
Valuation differences also vary widely, as highlighted in the section on "Measuring valuation effects" in the main text. Keeping all other dimensions constant, Italian general government debt for 2013 turns out to be 10 percentage points of GDP higher at market prices, compared with nominal values, whereas for Sweden the difference is almost negligible. The case of Greece shows how these different valuation effects can reflect idiosyncratic macroeconomic conditions: whereas for most countries the recent decline in interest rates has pushed market values above nominal values, the market value of Greek government debt as of 2013 is 5 percentage points of GDP lower than its nominal value, reflecting adverse interest rate developments for that country, linked to concerns about its creditworthiness.
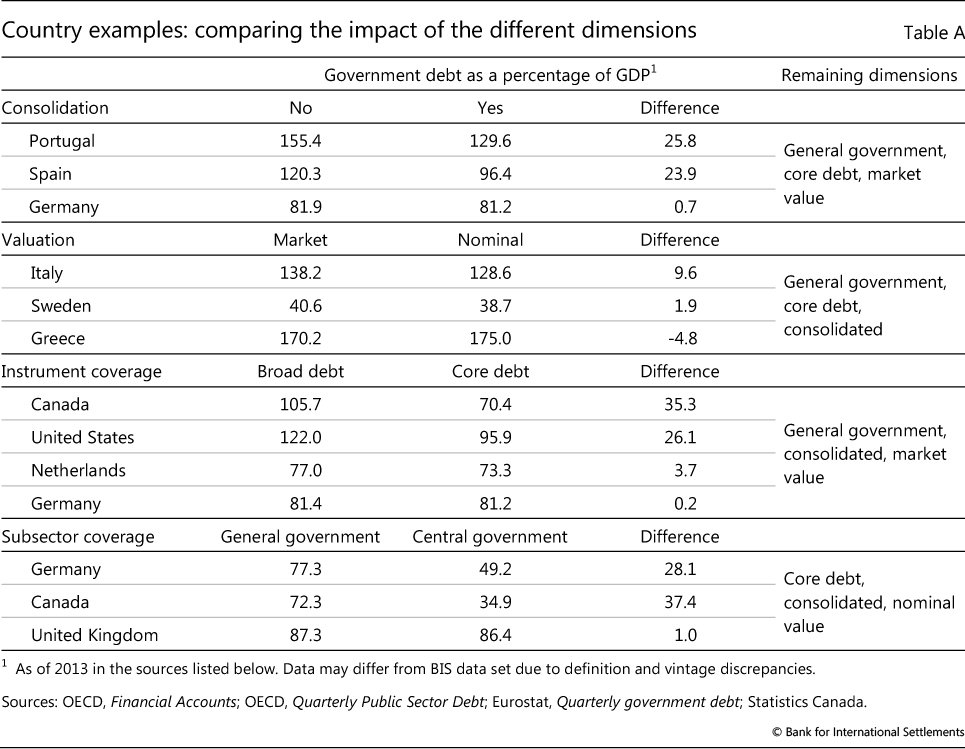
The scope of instrument coverage can also affect estimates. In the case of Germany, for example, using the general government's core debt instead of broad debt would have no significant effect. But the inclusion of non-core debt liabilities would increase government debt by more than 35 percentage points of GDP for Canada. Yet the implied deterioration of Canada's fiscal position, relative to that of other countries, may be misleading. The unfunded liabilities related to government-sponsored employment-related pension schemes in Canada are included in the financial accounts of the general government, which is in line with the standards and should be positively viewed from a fiscal transparency and sustainability perspective. However, many countries do not record such liabilities explicitly; moreover, there are cross-country discrepancies related to the sectoral classification of such pension schemes (funded or not), which should be in the general government sector when they are controlled by government, but may also be classified as pension funds in the financial corporations sector . In the current reporting, therefore, there are differences due to diverse institutional arrangements among countries. These types of discrepancy explain why the BIS data set focuses on core debt for the purpose of cross-country comparisons.
Finally, there are differences as to which subsectors should be included in debt figures for the general government as a whole, despite the clear recommendations contained in 2008 SNA. Considering just the central government instead of the general government sector reduces 2013 government debt by only 1 percentage point of GDP for the United Kingdom, but by up to 37 percentage points of GDP for Canada.
It should be noted, in addition, that general pension- related contingent liabilities associated with pay-as-you-go social security schemes are not recorded by most other countries. For details on these issues, see 2008 SNA, #17.191-206.
(5) Wherever possible, separate data are reported using two distinct valuation methods: one with the SNA-recommended approach (ie market value whenever possible), and a second with nominal values.
(6) Data are reported at a quarterly frequency.
This BIS concept of core debt, measured at nominal value, is identical to the so-called Maastricht debt,12 which is used in the European Union for the purpose of the Excessive Deficit Procedure (EDP) as well as for the Stability and Growth Pact (SGP).13
The BIS data set has a number of advantages. First, the main benefit of the narrower core debt concept is that the data are available for a larger set of countries and with rather homogeneous characteristics. Certainly, some national discrepancies remain, and the data presented by the BIS may not all have exactly the same targeted features as listed above. But these discrepancies are smaller than for other databases, and the related methodological issues are clearly documented on the website.14
Second, the new BIS data set adds value to existing information by presenting government liabilities whenever possible in both nominal and market value terms (this is the case for 26 of the 40 countries). This can facilitate economic analysis in a number of ways, as when determining the effect of interest rate changes on government debt stocks (see below).
Third, the BIS data report debt levels at a quarterly frequency - whereas most international sources are primarily annual - with a focus on extending the series as far back in time as possible.
Lastly, the new data set on government debt complements the data on credit to the private non-financial sector that the BIS has published since 2013. These two government and private credit data sets rely on identical instrument coverage and are presented in gross terms (although the data set for the private sector is not on a consolidated basis).15 Aggregate data on credit to the non-financial sector are therefore made available in parallel.
One disadvantage of the new government debt data set is that its coverage may be too limited for some purposes. As mentioned earlier, it excludes important financial liabilities that are undoubtedly part of government debt, such as SDR, IPSGS and other accounts payable. In this sense, the BIS data are intended to complement, rather than replace, the other widely used international databases, in particular when precise cross-country comparisons are required. In any case, a careful analysis of a country's fiscal position should always rely on a wide range of fiscal indicators, including both non-core debt instruments and explicit as well as implicit government contingent guarantees and liabilities (especially those related to ageing and unfunded social security schemes).16
Another limitation is that, for some purposes, net debt may be more appropriate. The main challenges of any netting, however, would be to decide which assets can be deducted from the debt, at what value, and how to handle cross-country differences in valuing government assets.
Measuring valuation effects
Uniquely, the new BIS data set tracks the evolution of government core debt at nominal and market value.
Market value is the amount for which a creditor could exchange assets or settle a liability at any moment in time.17 In particular, changes in the market value of debt affect the financial position of investors that mark their portfolios to market or monitor market values in order to assess potential gains or losses. Market values may fluctuate significantly because of changes in risk-free interest rates, but also in credit and other risk premia.
In contrast, the nominal value of a debt instrument, ie "the amount that at any moment in time the debtor owes to the creditor" (Handbook on Securities Statistics; see BIS-ECB-IMF (2015)), is stable from the moment of issuance till full repayment (except when accrued interest has not yet been paid; see below). The difference between the market and nominal value of a security reflects changes in yields since issuance.
In cases where nominal values are not available, face values are commonly used. These concepts are close but not identical. Nominal value consists of the sum of funds originally advanced, plus any subsequent advances less any repayments, plus any accrued interest not yet paid; face value (also known as "par18 value" or simply "par") refers only to the principal amount to be repaid at maturity (2008 SNA and Handbook on Securities Statistics). To illustrate the differences implied by these valuation definitions, Table 2 shows an example of a five-year fixed interest rate bond issued at par with annual coupon payments of 10%, as taken from the Handbook on Securities Statistics.
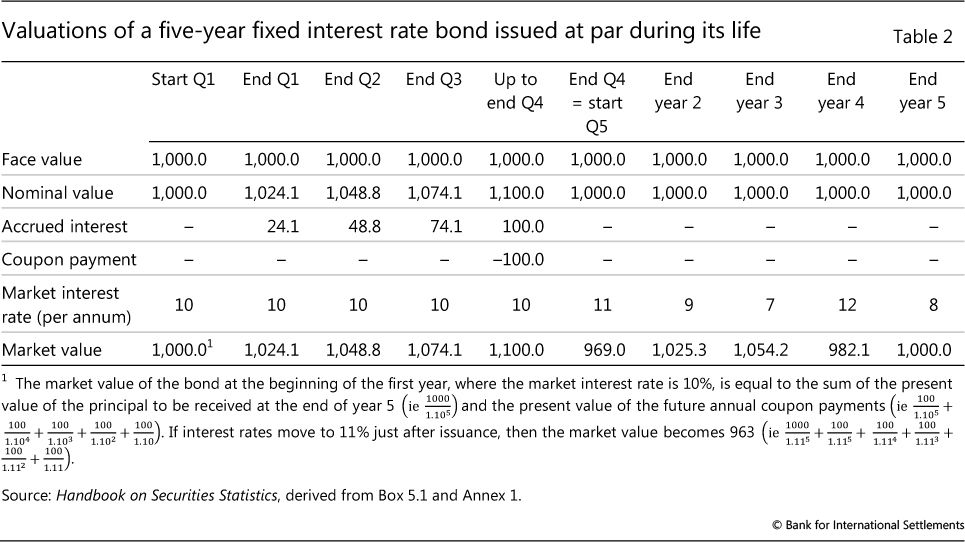
In this example, the face value of the bond is constant at 1,000 throughout its life. Its nominal value ranges from 1,000 to 1,100 throughout each year, depending on the elapsed time since last coupon payment and thus the amount of interest accrued (but not yet paid). The market value of the bond, however, is influenced not only by the treatment of accrued interest, but also by changes in market interest rates (ie the market value increases as the market interest rate falls, raising the present value of future coupon and principal payments, and vice versa when the interest rate rises). The Handbook on Securities Statistics (Annex 1) provides additional detailed examples for other types of bonds.
The market and nominal value concepts provide complementary perspectives. Generally, market values provide information on the relative size and depth of different markets, the value of collateral or the investors' exposure to government. Nominal values are particularly useful for some types of debt sustainability analysis (eg the effect of interest rate changes on debt servicing).
When data sets on government core debt are comparable and available in both market and nominal value terms, debt valuation effects can be readily monitored. This is useful in tracking the impact of, say, changes in interest rates and yields, including those driven by market participants' perceptions of creditworthiness.
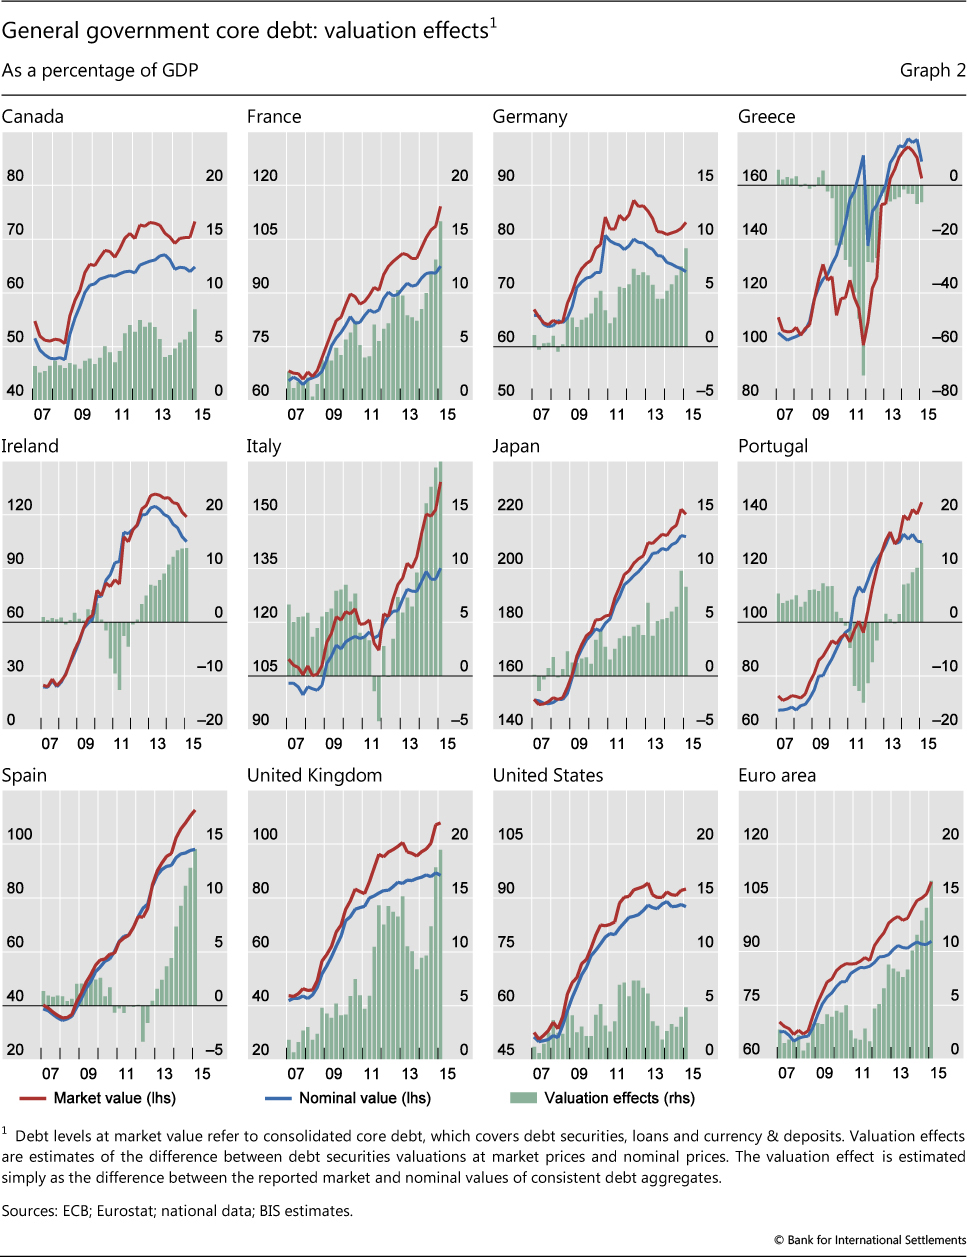
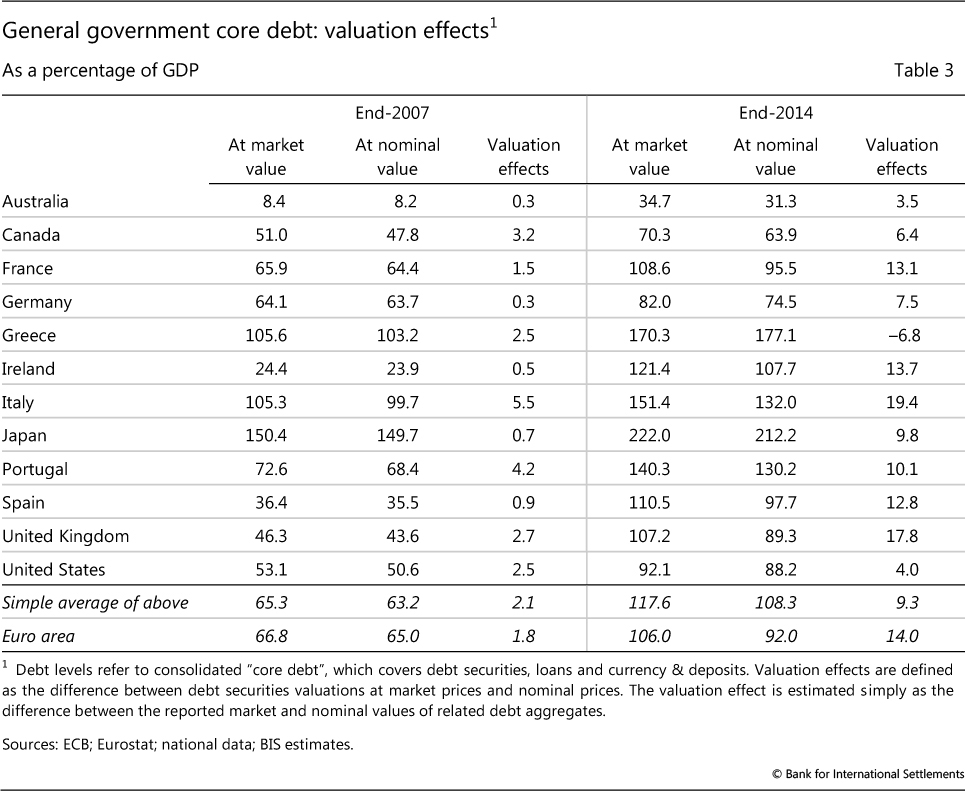
Graph 2 and Table 3 present market and nominal values of government core debt relative to GDP, as well as the valuation effect (estimated simply as the difference between the two), for a selected group of 12 countries and the euro area.19 It is clear, first, that government debt (both market and nominal values) has been rising strongly for most countries since the crisis. Second, market values have outpaced nominal values in most cases due to falling interest rates. Before the beginning of the financial crisis in 2007, credit to the government valued at market prices was already more than 2 percentage points of GDP higher than at nominal value, on average, for this group of 12 countries. This average gap between nominal and market values had widened to 9 percentage points of GDP by end-2014 - reaching a level as high as 19 and 18 percentage points of GDP for Italy and the United Kingdom, respectively. In some countries, especially Canada, Germany and Ireland, core debt appears to have started declining recently when measured at nominal value, while the change is much smaller when looking at market values (Graph 2).
Box 2
Where do the data come from?
Government debt data at nominal value are derived mainly from government fiscal indicators compiled by the agencies responsible for public finance management or national statistical institutes. In Europe, the statistical office of the European Union, Eurostat, provides data on the so-called Maastricht debt, which corresponds to the BIS target definition of government core debt in terms of instrument and sector coverage, consolidation and netting. For example, in the euro area at the end of Q4 2014, Maastricht debt was 91.9 % of GDP, which is identical to the BIS core debt figure (using nominal value).
Credit figures at market value are provided by data on the balance sheet of the government sector that are included in the sectoral financial accounts. These financial accounts form part of the 2008 SNA and are sometimes also labelled as the "Flow of funds" (FOF). However, some countries have not yet begun to compile financial accounts and typically record their debt liabilities at nominal value in their fiscal accounts. This explains why fewer countries are listed in the BIS market value data set than in the nominal value one.
For cases where it is not possible to retrieve data that already have the features targeted by the BIS, partial information can be mobilised to complement missing financial accounts data. Data on debt securities issued by the general government are a case in point. As argued in the main text ("Measuring valuation effects"), debt securities account for the main difference between the market and nominal values of core debt estimates. In the United States, for instance, the debt securities are compiled in the FOF at face value, and are made only partially available at market value by the Federal Reserve Bank of Dallas. The BIS market value data set is constructed by extrapolating these figures for the whole government sector. By contrast, in Australia, government debt data are published only at market value. To construct BIS nominal core debt estimates, figures from the financial accounts have to be replaced by data on debt securities at nominal value as reported by the Australian Office of Financial Management. In Canada, to offer yet another example, consolidated core debt at nominal value is derived from unconsolidated data, using information provided at market value for both the consolidated and the unconsolidated general government core debt figures. For Japan, both market and face values of outstanding debt securities are reported in the FOF, but the general government sector is not consolidated. Inter-government claims, to the extent that they can be identified in the financial accounts, must therefore be removed from the debt data in order to arrive at an estimate for the consolidated sector.
The Maastricht debt concept is measured at nominal (face) value. See European Council regulation no 479/2009 of 25 May 2009.
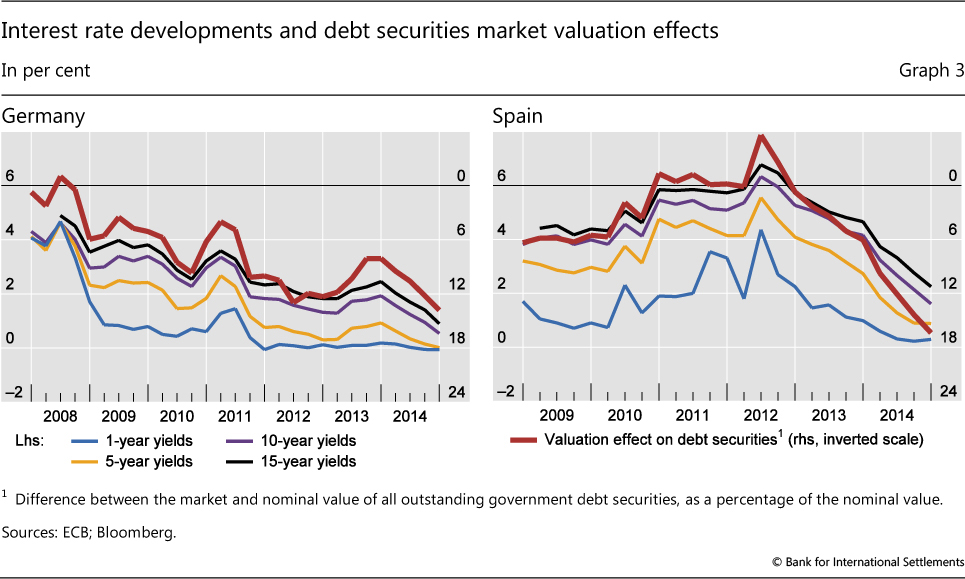
For given changes in market interest rates, the valuation effect increases with the maturity (or, strictly speaking, the duration)20 of the corresponding debt security.21 Graph 3 illustrates this point. It shows interest rate changes related to four maturities in Germany and Spain. The red line plots the valuation effect defined as the difference between the market and nominal value of all outstanding debt securities (irrespective of maturity), presented here as a percentage of their nominal values and with an inverted scale. This chart clearly shows that the aggregate valuation effect appears to be driven essentially by the interest rate movements related to longer-term debt securities (here the five-, 10-, and 15-year maturities displayed in the graph), as compared with the shorter ones (illustrated by a one-year bond with a blue line in the graph). In Germany, the valuation effect was positive over the entire 2008-14 period, showing that the market value of debt securities consistently exceeded their nominal value. The valuation effect has recently become more substantial, in line with the significant further fall in market interest rates. In Spain, the valuation effect on government debt securities was slightly negative in 2011-12, but has kept growing ever since. While interest rates are still lower in Germany than in Spain, interest rates have fallen more in Spain since 2012, explaining why the valuation effect has increased more markedly.
Valuation effects due to changes in interest rates and credit quality can obviously be calculated only for traded instruments, such as debt securities, since other instruments are typically only reported at nominal value. Hence it can be argued that these effects are underestimated to the extent that a significant share of government debt takes the form of loans rather than securities.
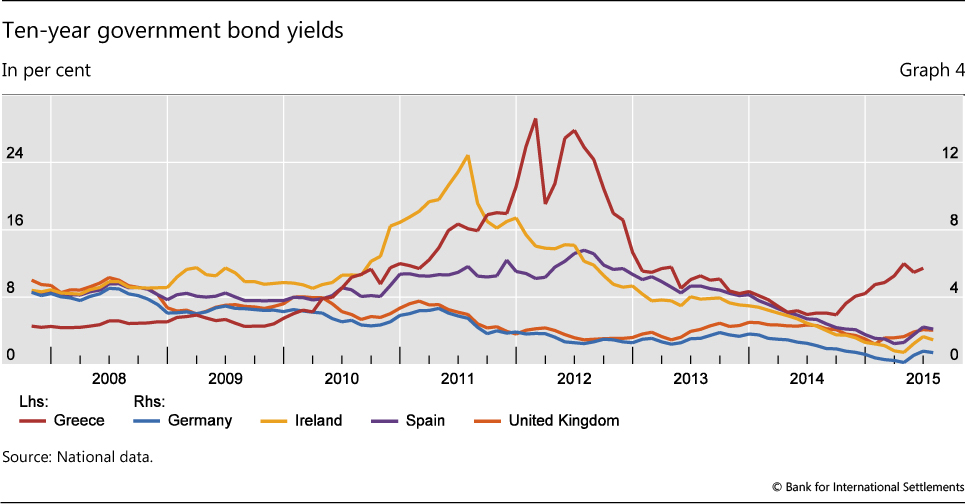
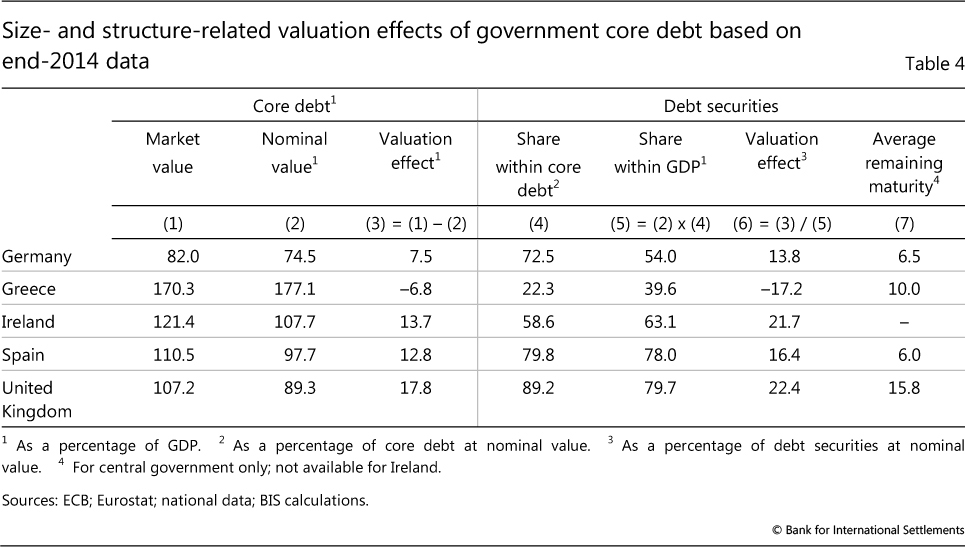
The United Kingdom and Ireland are good illustrations of this point. In the United Kingdom, interest rates dropped less in recent years than did those in Germany or Spain (Graph 4), but the measured valuation effect was significantly higher (18 percentage points of GDP compared with 8 for Germany; see Table 4). This can be explained at least in part by the higher share of debt securities within UK government core debt (compared with German debt), while the higher remaining maturity of UK government debt securities also played a role (Table 4). In Ireland, the relatively low share of debt securities has dampened the substantial revaluation impact due to the significant post-crisis fall in interest rates.
The relative share of loans in government debt also affects the valuation effects of interest rate changes. In Greece, for example, credit to the government currently consists predominantly of loans from EU institutions and other international organisations. The share of debt securities is therefore much lower than in any other country in the BIS data set. As a result, while worsening credit quality has undoubtedly reduced the market value of the stock of Greek debt securities in recent years, the reported valuation of the official loans has remained unaffected (since they are typically measured at nominal values). This has greatly moderated the effect of interest rate changes on the valuation of core debt.
Tracking debt dynamics around crises
Combined with the BIS data series on private sector credit,22 the BIS government core debt data allow for a more consistent comparison between credit to the government, corporate and household sectors across countries. This can provide useful policy insights, especially when analysing debt dynamics around episodes of financial stress.
Indeed, the analysis of aggregate data for advanced and emerging market economies as separate groups reveals at least four interesting facts (Graph 5). First, debt in the non-financial private sector was generally already on a rising path before the crisis; in contrast, government debt was actually falling in aggregate.
Second, government debt has kept rising since the crisis. Particularly in crisis-hit advanced economies, fiscal deficits rose and GDP fell immediately after the crisis, leading to a fast and protracted expansion of government credit-to-GDP ratios (Graph 5, first panel).
Third, non-financial private sector debt in advanced and emerging market economies has exhibited divergent paths since the crisis. In advanced economies, although with some variation across countries, private debt has stabilised and even started to come down one or two years after the crisis as a percentage of GDP. In emerging market economies, by contrast, the debt ratios of both households and non-financial corporates have been growing steadily for the last six years (Graph 5, second and third panels).
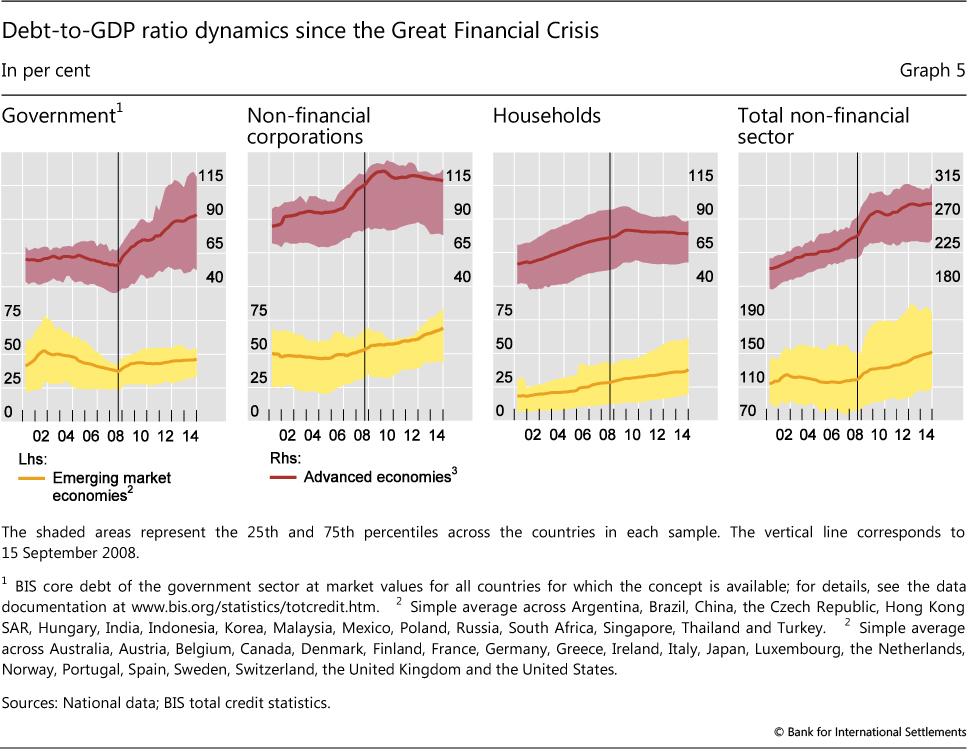
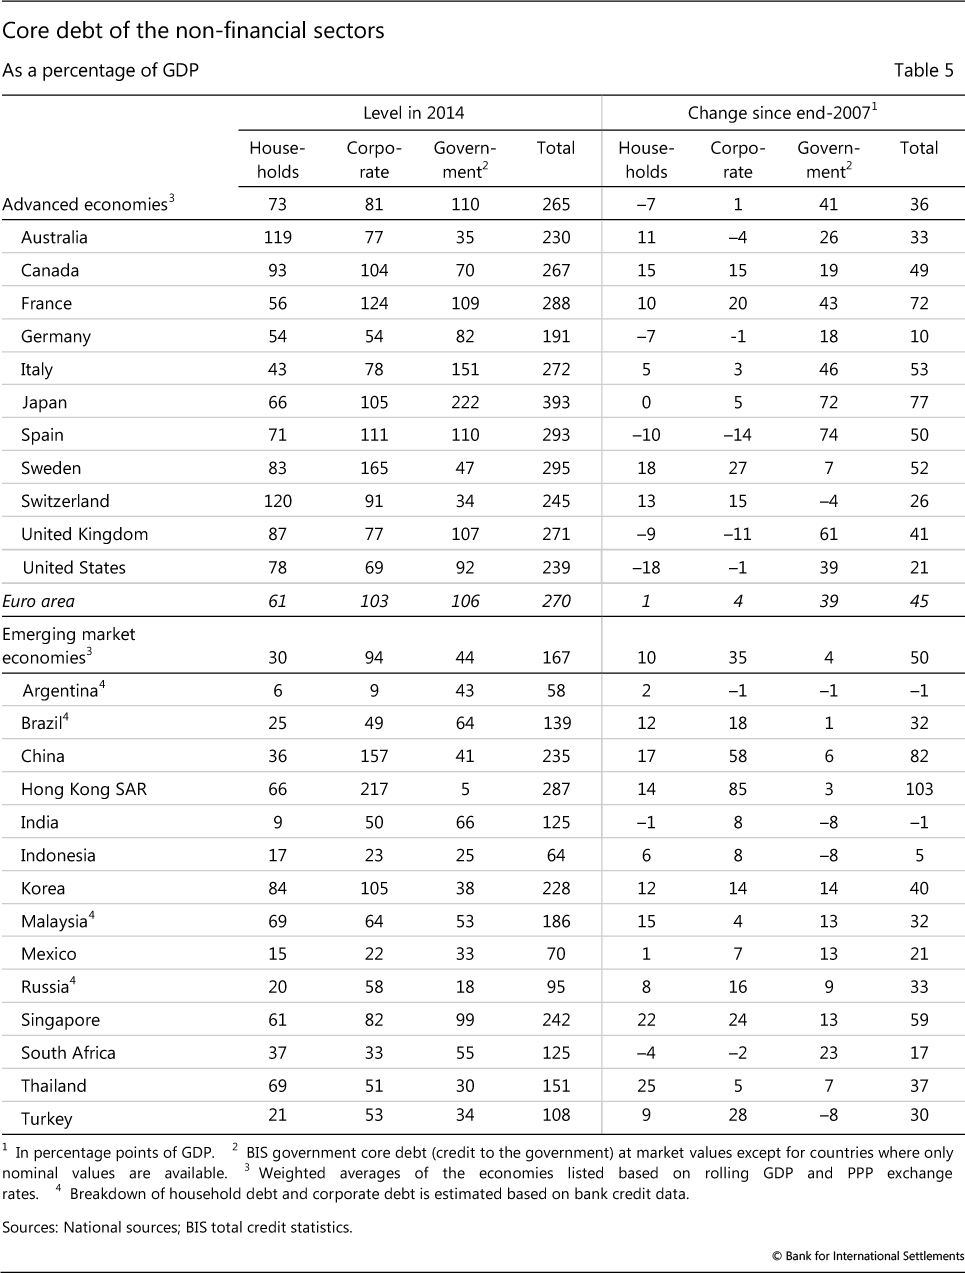
Fourth, the sum of non-financial private and government debt has not fallen since the crisis (Graph 5, last panel, and Table 5).23 Total debt in advanced economies has continued to expand (by 36 percentage points of GDP since 2007), with some exceptions mainly reflecting the recent decline in private sector debt in a limited number of countries. Meanwhile, total debt in emerging market economies has risen even more (by 50 percentage points).
The BIS data also allow for a historical comparison of debt dynamics around crisis episodes. Graph 6 shows the evolution of government, non- financial corporates and household debt relative to GDP before and after the crises in Japan (in 1992), Finland and Sweden (both in 1991). These three events are compared with a set of the recent stress episodes in national banking systems amid the Great Financial Crisis, as taken from Laeven and Valencia (2012). These various examples show that the speed of debt reduction can differ significantly, both across sectors and across crisis episodes.
As regards the Nordic examples, private sector debt grew for at least eight years before the crisis but, thereafter, it came down in about half the time in both Sweden and Finland (Graph 6, centre and right-hand panels). Finland, in particular, saw a reduction in private debt from about 155% of GDP to just over 117% (due to a lowering of both corporate and household debt) in just five years. Sweden also experienced a significant reduction in private debt in the aftermath of the crisis, though to a lesser extent. Both Sweden and Finland recorded sharp increases in government sector debt ratios immediately after the crisis. This reflected the strain on public finances of bailing out the financial system as well as the effect of output losses on fiscal revenues. But these government ratios started to come down noticeably once most of the deleveraging of the private sector had been completed.
The example of Japan was quite different. Private sector deleveraging was more muted after the crisis, and was mainly concentrated in the non-financial corporate sector. Household debt as a percentage of GDP continued to rise slightly several years after the crisis and did not correct afterwards. Initially, government debt rose less rapidly than it did in the Nordic cases, not least since the repair of banks' balance sheets started much later, but the government debt position continued to worsen for much longer and ended up much larger.
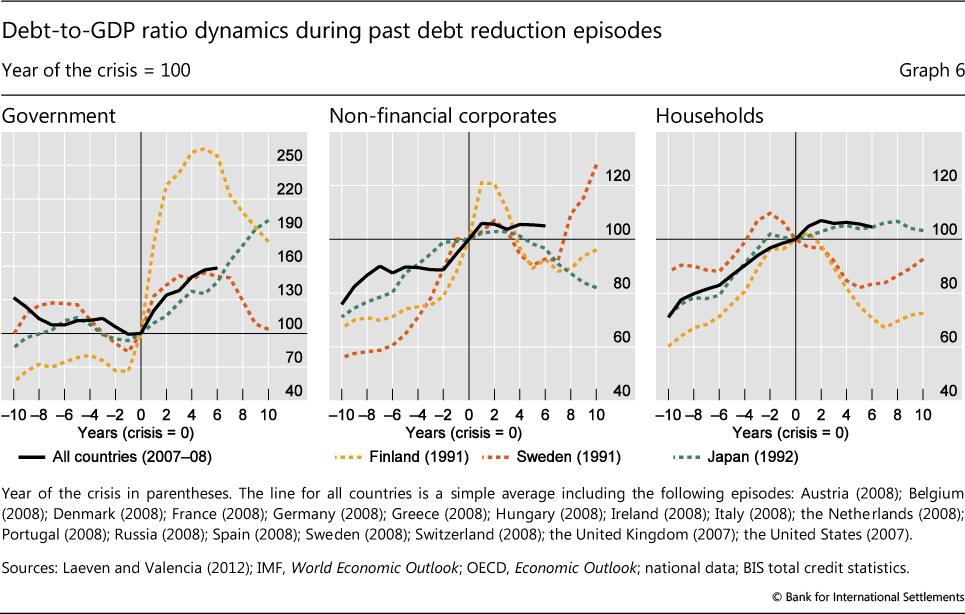
Turning now to the 2007-08 examples, Graph 6 shows that, seven years into the latest financial crisis, debt reduction seems to have only just started. There are certainly important differences between countries, with for example a somewhat quicker paydown of debt in the United States and the United Kingdom. In aggregate, however, the debt dynamics of the advanced economies resemble more the pattern of those of Japan in the early 1990s than of the Nordic countries in 1991. Aggregate private debt has barely stabilised, let alone started to correct downwards, even in the corporate sector. And government debt continues to rise steadily, in a manner reminiscent of Japan's trend deterioration in the 1990s - and unlike the large but temporary deterioration followed by a rapid improvement in fiscal positions experienced by the Nordic states during the same period.
Conclusions
The new data set on government debt for 26 advanced and 14 emerging market economies presented in this special feature has three main objectives. First, the definition and coverage of these indicators is consistent across countries, facilitating cross-country comparisons, and with a relatively high (quarterly) frequency.
Second, the underlying concepts are also consistent with those used to build the existing BIS data set on credit to the non-financial private sector, publicly available since 2013. As a result, BIS data now support the analysis of country debt patterns at the level of both subsectors and the entire non-financial sector.
Third, a key distinctive feature of the government debt data set is that it contains series expressed in both nominal and market terms. The latter feature appears particularly topical at present when large changes in interest rates - owing to the trend decline in benchmark yields and changing perceptions of sovereign creditworthiness - have increased the size of valuation effects.
The new BIS data sets support the analysis of credit developments both by region and by sector. These data show that non-financial private sector indebtedness was already on the rise before the Great Financial Crisis, while the reduction in government debt was quite modest in comparison. In the most crisis-hit advanced economies, government debt started to rise after 2008 at an especially fast and persistent pace. At the same time, private sector credit has barely stabilised, even if it has started to edge downwards noticeably in a few jurisdictions. The combined effect of these developments (minor private deleveraging, sharp deterioration in fiscal positions) has been a further increase in total debt in the advanced economies' non-financial sectors from 229% of GDP on average in 2007 to 265% in 2014 (using PPP weights). Turning to emerging market economies, we see that government debt has been relatively stable on average, while non-financial private debt has been on the increase for the last seven years. As a result, the total credit-to-GDP ratio went from 117% to 167% for this group of economies.
References
Avdjiev, S, P McGuire and P Wooldridge (2015): "Enhanced data to analyse international banking", BIS Quarterly Review, September, pp 55- 70.
Bank for International Settlements (2015): 85th Annual Report, June, Chapter I.
Bank for International Settlements, Commonwealth Secretariat, European Central Bank, European Commission-Eurostat, International Monetary Fund, Organisation for Economic Co-operation and Development, Paris Club Secretariat, United Nations Conference on Trade and Development and World Bank (2011): Public sector debt statistics: Guide for compilers and users.
Bank for International Settlements, European Central Bank and International Monetary Fund (2015): Handbook on Securities Statistics.
Bloch, D and F Fall (2015): "Government debt indicators: understanding the data", OECD Economics Department Working Papers, no 1228, June.
Carnot, N, V Koen and B Tissot (2011): Economic forecasting and policy, second edition, Palgrave Macmillan, Chapter 5.
Dembiermont C, M Drehmann and S Muksakunratana (2013): "How much does the private sector really borrow - a new database for total credit to the private non-financial sector", BIS Quarterly Review, March, pp 65-81.
Dippelsman, R, C Dziobek and C Gutiérrez Mangas (2012): "What lies beneath: the statistical definition of public sector debt", IMF Staff Discussion Notes, SDN/12/09, July.
European Commission (2012): "European Commission scoreboard for the surveillance of macroeconomic imbalances", European Economy Occasional Papers, no 92.
European Commission, International Monetary Fund, Organisation for Economic Co-operation and Development, United Nations and World Bank (2009): System of National Accounts 2008.
Eurostat, definition of general government gross debt defined in the Maastricht Treaty, http://ec.europa.eu/eurostat/en/web/products-data sets/-/TSDDE410.
International Monetary Fund (2000): Monetary and Financial Statistics Manual.
--- (2014): Government Finance Statistics Manual.
International Monetary Fund and Financial Stability Board (2009): The financial crisis and information gaps - report to the G20 Finance Ministers and Central Bank Governors.
Laeven, L and F Valencia (2012): "Systemic banking crises database: an update", IMF Working Papers, no 12/163, June.
1 The construction of the series would have been impossible without the extensive help of Burcu Erik and Marjorie Santos. We are also grateful for the inputs provided by national central banks, as well as for the useful comments by Claudio Borio, Ben Cohen, Dietrich Domanski and Hyun Song Shin, and for research assistance from Tracy Chan. The views expressed are those of the authors and do not necessarily reflect those of the BIS.
2 Strictly speaking, the widely used concept of public debt is misleading, as it is not the same as general government debt. Public debt is the sum of the debt of the general government (sector S13 in the System of National Accounts 2008 (2008 SNA) classification) and the debt of public enterprises, which are part of the non-financial corporations (S11) and financial corporations (S12) sectors, and not of S13. In this special feature, we will refer only to the debt of the general government sector, in line with the SNA classification.
3 The new government debt indicators presented here follow the series of steps taken by the BIS to better assess "credit" in recent years. The first step was the decision in 2013 to publish such series for the private non-financial sector for 40 advanced and emerging market economies, responding to strong demand from policymakers, market participants and researchers. This information has now been expanded to cover credit to the government sector. The measurement and dissemination of international banks' asset and liability positions have been enhanced, as discussed by Avdjiev et al (2015). The dissemination of data on debt securities issuance has also been strengthened.
4 In particular, there is no sectoral coverage overlap between the data on credit to the private sector and the data on government debt. Public enterprises are excluded from the government sector, and public non-financial corporations are included in the non-government non-financial sector.
5 At www.bis.org/statistics/totcredit.htm.
6 See Dippelsman et al (2012) for a detailed description of the five dimensions of public debt.
7 A basic SNA principle is that sectoral consolidation is not encouraged, meaning that, in principle, flows and positions between constituent units within a subsector should not be consolidated (except for complementary analyses). However, for the general government sector in particular, the consolidation of transactions between the various levels of government is recognised to be "instructive", especially for policy purposes (see 2008 SNA, #11.43, for detailed explanations).
8 Valuation principles in the 2008 SNA state: "Ideally, values observed in markets or estimated from observed market values should be used, with nominal values used for some positions in instruments where market prices are not observable." This means that debt securities should be recorded at market value - although there might be different practices for doing so across countries. As regards loans, "unless a loan becomes tradable and is traded with established market value, it is always recorded in the SNA at nominal value". Nevertheless, the SNA "recommends memorandum items recording fair values only for loans specifically characterised as non-performing" (2008 SNA, #A4.40). Moreover, once a loan (or any debt) is forgiven, the SNA recommends a specific treatment (2008 SNA, #22.107-8).
9 Face values are used whenever nominal values are unavailable. For the (minor) difference between face and nominal values, see the section on "Measuring valuation effects".
10 According to the SNA, debt can be "defined as a specific subset of liabilities identified according to the types of financial instruments included or excluded. Generally, debt is defined as all liabilities that require payment or payments of interest or principal by the debtor to the creditor at a date or dates in the future. Consequently, all debt instruments are liabilities, but some liabilities such as shares, equity and financial derivatives are not debt. However, due to specific legal, institutional or practical arrangements some other definitions of debt may also exist. It is therefore useful in all cases to clearly identify the definition of debt according to the instruments included" (2008 SNA, #22.104).
11 In addition to the three components of core debt identified here, debt instruments comprise special drawing rights (SDR), insurance technical reserves and provision for calls under standardised guarantee schemes (IPSGS), and other accounts receivable/payable (2008 SNA, #26.103). These three additional types of financial facility should therefore be included in any comprehensive picture of government debt (here called "broad debt"). However, they have been excluded from the BIS core debt measure mainly because of the lack of international comparability. For instance, SDR are registered as liabilities of the general government in some countries, but in others as liabilities of the central bank (which is located not in the general government but in the financial institutions sector). The size of the IPSGS also varies substantially between countries, depending in particular on whether pension liabilities for government employees are recorded under this debt instrument (as, for instance, in Australia, Canada and the United States), which is not the case in most other countries - indeed, the international community is currently working in the context of the Data Gaps Initiative on clarifying the existence of "employment-related pension schemes other than social security" sponsored by government and the proper recording of their liabilities in general government debt. The recording of "other accounts payable" also varies across countries. In particular, these can include trade credits, which are not recorded in the same way in all countries. They can also be inflated by intra-government transfer payments (pensions, social security) or by institutional changes in the pension system.
12 See Eurostat definition of general government gross debt as defined in the Maastricht Treaty: http://ec.europa.eu/eurostat/en/web/products-datasets/-/TSDDE410.
13 See European Commission (2012).
14 www.bis.org/statistics/totcredit.htm.
15 This apparent inconsistency between the private and government debt data sets is warranted, since one single entity is usually "responsible" for the operations of the government sector, although the appropriateness of this assumption depends on country-specific factors. In contrast, netting credit relationships within the private non-financial sector would be misleading for debt sustainability assessment, since intrasector financial flows can be large and may have destabilising systemic effects, as seen in the last financial crisis (Dembiermont et al (2013)).
16 See eg Carnot et al (2011) for an overview of the issues related to fiscal policy analysis.
17 Market value is "the price at which debt securities are acquired or disposed of in transactions between willing parties, excluding commissions, fees, and taxes, but including accrued interest" (Handbook on Securities Statistics).
18 A bond trades "at par" when its nominal and market value are the same (ie the yield equals the coupon and the investor expects the same return).
19 See also BIS (2015).
20 Duration being "the weighted average term to maturity of a debt instrument" (Handbook on Securities Statistics).
21 Assuming a fixed interest rate at issuance (the valuation impact will be much lower, for instance, if the debt security is indexed to short-term interest rates).
22 See Dembiermont et al (2013).
23 The government debt data are here presented at market value, but the picture is broadly comparable using nominal values.