Diversity of residential property price statistics: the German case
(Extract from pages 68-69 of BIS Quarterly Review, September 2014)
The Detailed data set (see main text) includes 48 indicators for Germany covering different segments of the market and following different methodologies. The four most representative series are all reported at least quarterly and are quality-adjusted, but differ in many other aspects (Table A). Two indices are compiled by the private sector and the other two by public sector agencies. More importantly, the indicators vary in their regional coverage, refer to different types of property, use different approaches for the quality adjustment and have different starting dates as well as reporting lags.
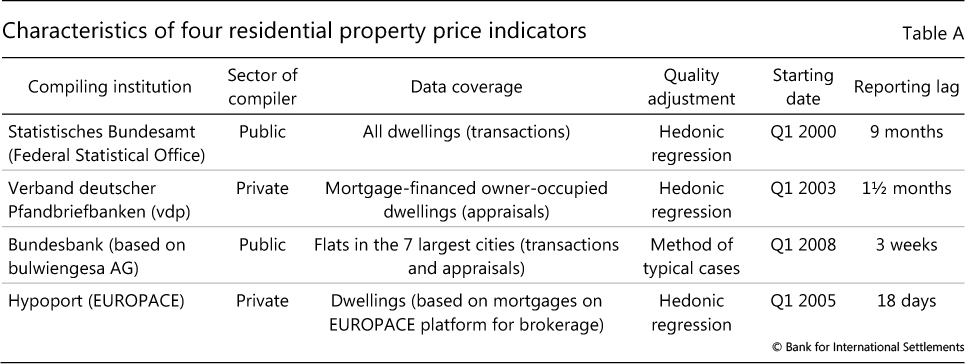
The official indicator compiled by the Federal Statistical Office covers most of the housing market, but it is only available with a long reporting delay. Analysts interested in the most recent developments might prefer the Verband deutscher Pfandbriefbanken (vdp) indicator. The Hypoport (EUROPACE) indicator is even more timely but covers just 15% of overall transactions, and even though it has a monthly frequency, the data represent moving quarterly averages. The Bundesbank indicator, based on data from bulwiengesa AG, is the only one focusing solely on urban properties. The Bundesbank compiles an indicator that covers the entire country (not listed in the table) that is available only at an annual frequency.
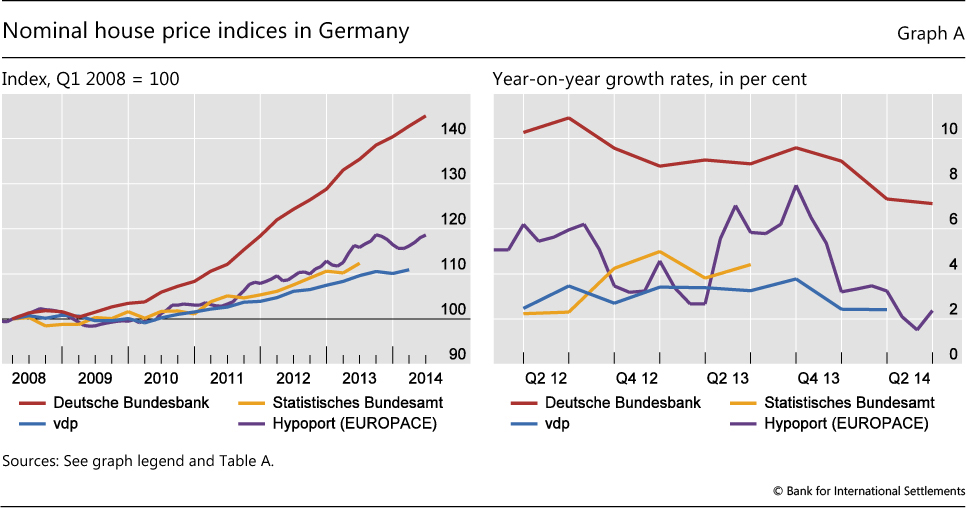
The four price indicators convey somewhat different messages both about longer-term trends and about shorter-term developments. Graph A plots the recent history of the four indicators. Looking at longer-term trends (Graph A, left-hand panel), the three country-wide indicators convey a similar picture, placing the cumulative growth rate since the beginning of 2008 in the range of 11% (vdp) to 16% (Hypoport). However, only the Bundesbank indicator shows the pronounced price increase registered for flats in major cities, where prices have climbed by a cumulative 45% since 2008. The picture is even more mixed in quarter-to-quarter movements (Graph A, right-hand panel). House price growth estimates calculated on the basis of the Bundesbank and vdp indices differ substantially, but they are both much less volatile than that based on the Hypoport series, arguably reflecting the shifting sample of the properties listed on the online brokerage that supplies the price information. The graph also illustrates the reporting lag of the Federal Statistical Office indicator.
The BIS has chosen the vdp index for inclusion in the Selected data set (see main text) because of its broad coverage of properties and its short reporting lag.
The Long data set series (see main text) for Germany also uses the vdp index for the period starting in 2003. Prior to that date, the long series is constructed on the basis of price indices referring to properties in western Germany. Going backwards in time, the long series uses the historical time series of the Bundesbank on western German dwelling prices for the period 1975-2002 and sales price data in four cities from a private sector source (Ring Deutscher Makler) for the period 1972-74. For the first two years (1970-71) and in the absence of house price data, the series uses construction cost data as a proxy indicator. For the years where only annual data were available (ie prior to 2003), the quarterly series was constructed using the Chow-Lin (Chow and Lin (1971)) interpolation procedure based on the quarterly pattern of the construction cost index.