Emerging economies respond to market pressure
The retrenchment from emerging market economies resumed in full force around the turn of the year, as their subdued growth outlook continued to diverge from the optimistic sentiment in mature markets and as US monetary policy reduced the flow of easy money. Investors were also unsettled by signs of economic weakening and growing financial risks in China. The upshot was portfolio outflows and declining asset values. In parallel, some emerging market currencies depreciated sharply, prompting authorities to defend them by raising policy rates and intervening in foreign exchange markets.1
While the average exchange rate dynamics during the January sell-off were similar to those in mid-2013, the underlying drivers differed. After the unexpected official announcement that the Federal Reserve envisaged tapering its large-scale bond purchases, the large depreciations in the earlier episode tended to be by the currencies of emerging market economies with large external imbalances, high inflation or rapidly growing domestic credit. By contrast, the recent depreciations reflected political uncertainties and differences in growth prospects. Central banks in emerging market economies also intervened much more forcefully this time round, thereby stabilising and in some cases boosting their currencies.
In advanced economies, markets maintained their rally into the first weeks of 2014. Investors there rode on policy commitments to support growth as well as on positive economic surprises, notably in the euro area and the United Kingdom. Thus, they took in their stride the announcement and subsequent start of US tapering. The tightening of credit spreads continued until mid-January, while steady inflows into equity funds maintained upward pressure on stock prices. However, towards the end of January, disappointing data on US job growth and headwinds from emerging market economies led to a sharp, albeit temporary, drop of valuations in all but the safest asset classes.
Emerging market economies
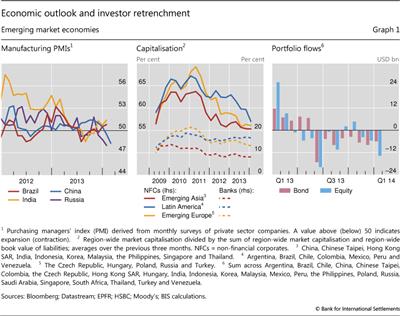
The recent sell-off in emerging market economies occurred against the backdrop of their subdued growth outlook. In January, a survey-based indicator of conditions in China's manufacturing sector dropped into contraction territory for the first time since September 2012, leading market analysts to envisage adverse effects on exporters to China (Graph 1, left-hand panel). In the case of Brazil, India and Russia, the indicator had hovered around its neutral level since mid-2013, signalling minor contractions and expansions. Coupled with a better outlook in advanced economies and a reduction in easy money from the United States, these developments weakened the appeal of emerging markets to international investors.
Perceptions of growing financial risks had also gained momentum. To an extent, these perceptions were fuelled by political tensions in several countries. But the underlying financial conditions played an important role as well. In January, market participants were unsettled by a near default in China's shadow banking sector. The growing importance of this sector had been revealed in a doubling of the volume of credit provided by Chinese non-banks over the past 18 months, to 25% of total credit in the country. More generally, in parallel with expanding balance sheets, the capitalisation of both non-financial corporates and banks in emerging market economies had deteriorated. The region-wide average ratio of equity over total balance sheet size had fallen gradually but steadily from 2010 to the end of 2013 (Graph 1, centre panel).
Emerging markets under pressure
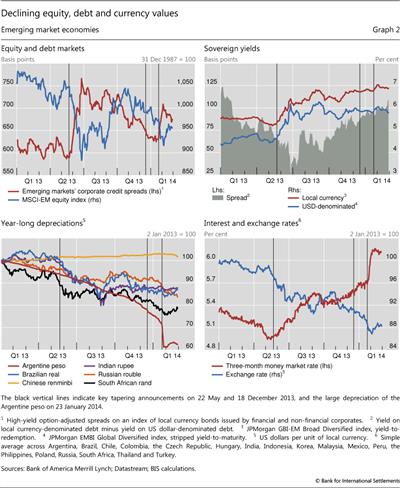
After subsiding in September and October, investors' retrenchment from emerging markets gathered speed in November. As a direct manifestation, the outflows from both bond and equity funds intensified and remained sizeable up to end-January (Graph 1, right-hand panel). Retail investors accounted for the bulk of these outflows, while inflows from institutional investors continued. In parallel, and on the heels of a strong two-month rally, a broad equity index lost more than 10% of its value over the three months to end-January (Graph 2, top left-hand panel).
These developments were mirrored in foreign exchange markets, where renewed currency depreciations put pressure on central banks to raise policy rates or tap their reserves. The depreciations started at end-October, maintained their course through the Federal Reserve's tapering decision on 18 December, and accelerated on 23 January (Graph 2, bottom panels). On that date, in an effort to preserve foreign exchange reserves, Argentina's central bank scaled back support for the peso, which immediately lost 10% of its value with respect to the US dollar. This event spilled over, leading to sharp concurrent depreciations of a number of other emerging market currencies and to an upward spike of the credit spreads on a broad domestic currency bond index (Graph 2, top left-hand panel).
Policy interventions in emerging market economies bore fruit in February. These interventions stabilised and in some cases boosted emerging market currencies, providing breathing space to local corporates that had increasingly tapped international markets by issuing foreign currency bonds.2 Likewise, stock indices recovered most of their January losses and credit spreads tightened.
Comparing sell-off episodes: mid-2013 and January 2014
Despite similarities in aggregate exchange rate dynamics, the last two emerging markets sell-offs differed in important ways. The episode in mid-2013 was triggered by an unexpected official announcement that the Federal Reserve envisaged tapering its large-scale bond purchases. This announcement had been preceded by a period of relatively stable exchange rates and low and falling interest rates in emerging economies (Graph 2, bottom right-hand panel). In contrast, by end-2013 markets had digested the actual start of US tapering and the macroeconomic outlook had deteriorated in many emerging markets. Thus, during 2013, emerging market exchange rates had already depreciated by around 10% on average vis-à-vis the US dollar. At the same time, interest rates had risen continuously as several emerging market countries, such as India, had already tightened policy rates in response to the sell-off in mid-2013. And when market pressure escalated on 23 January, strong policy responses translated into a much steeper interest rate hike than during the previous episode (Graph 2, bottom right-hand panel).
In addition, foreign exchange risk gradually assumed a dominant role in sovereign credit markets over the second half of 2013. During the first sell-off in June, the yields on domestic currency and US dollar debt went up in sync, driven by perceptions of increased sovereign credit risk (Graph 2, top right-hand panel). By contrast, while the yield on domestic currency debt increased by 80 basis points from July to January, there was virtually no change in the yield on corresponding US dollar debt over the same period. This suggests that exchange rate risk substituted for credit risk as a key driver of the borrowing costs of emerging market sovereigns.
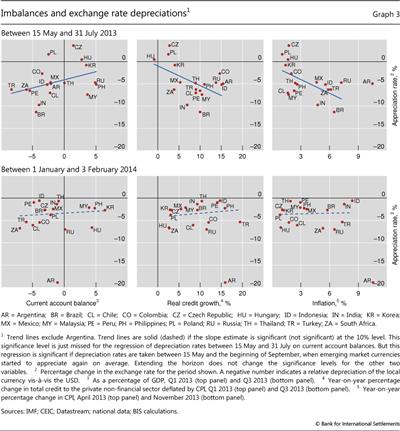
This provided the backdrop for different developments in foreign exchange markets across the two sell-off episodes. From mid-May to end-July, it was the currencies of emerging market economies with greater external and internal imbalances that depreciated most. For instance, large current account deficits were associated with downward pressure on currency values (Graph 3, top left-hand panel). Foreign exchange investors were also wary of those emerging markets that had high inflation rates or had seen rapidly expanding credit to the private non-financial sector (Graph 3, top centre and right-hand panels). Being among the more vulnerable emerging market economies, India and Brazil saw their currencies depreciate by roughly 10% vis-à-vis the US dollar during that episode.
Even though emerging market currencies did depreciate substantially from early 2014 until they stabilised on 3 February, forceful policy actions dampened the effect of market pressure on exchange rates. As the sudden depreciation of the Argentine peso spilled over, markets did penalise countries with large current account deficits. Thus, the Turkish lira and the South African rand were among the currencies that depreciated the most in the following days. In order to contain these developments and their fallout, a number of central banks responded with strong policy rate hikes in late January and early February. This stabilised exchange rates and even brought them into appreciation territory more recently (Graph 2, bottom right-hand panel). For their part, the Russian authorities defended the rouble by drawing on their substantial foreign exchange reserves. The Russian central bank sold $7.8 billion in January, compared to a combined $7 billion in June and July. Such actions - as well as the increasing importance of political tensions as a differentiating risk factor - blurred the relationship between depreciations of emerging market currencies and the above indicators of economic imbalances (Graph 3, bottom panels).
How does US monetary policy affect policy rates in emerging market economies?
Előd Takáts
Monetary policy in advanced economies, especially in the United States, appears to have a significant influence on the conduct of monetary policies in many emerging market economies (EMEs). During the global "search for yield", many EMEs were concerned that large interest rate differentials vis-à-vis advanced economies would lead to destabilising capital inflows and overvalued exchange rates. In recent years, this seems to have kept EME policy rates lower than what purely domestic conditions would have implied. Conversely, the beginning of the normalisation of US monetary policy has already started to induce upward adjustments in policy rates, amplified by a turn in investor sentiment, a reversal of capital flows and strong downward pressure on exchange rates.
One way to assess the factors driving EME policy rates is to estimate a Taylor equation. The standard Taylor equation uses two domestic variables to explain policy rates: inflation (or its deviation from the target) and the output gap. The intuition is straightforward: countercyclical monetary policy should raise rates if inflation is rising or the economy is overheating - and lower rates if inflation is declining or output falls short of its potential. We augment this standard Taylor equation with an additional term in order to assess the impact of US monetary policy. Formally, we estimate the equation below for each EME:

where rEME denotes the monetary policy rate of the EME in question, π the inflation rate and y the output gap; rUS denotes the "shadow" policy rate of the United States. As usual, ε denotes the error term and t is the quarterly time index. The sample covers 20 EMEs over the Q1 2000-Q3 2013 period.
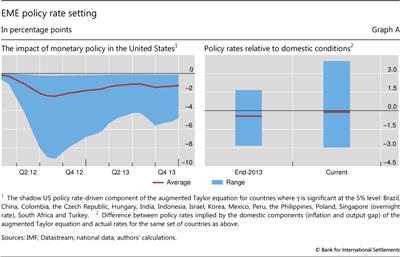
The results confirm that the augmented Taylor equation is broadly consistent with the evolution of EME policy rate setting, ie the regression fits the observed policy rates well. They confirm that US monetary policy has a significant effect over and above domestic conditions: US monetary policy, captured by parameter γ, is statistically significant for most emerging markets (16 out of 20). More specifically, the results indicate that in these economies US monetary policy is associated with on average 150 basis points lower policy rates since 2012 (Graph A, left-hand panel, red line), albeit with substantial heterogeneity across countries and time (blue shaded band). This is consistent with recent findings suggesting that EME monetary policy tended to be more accommodative than the Taylor rule prescription. For example, even at the end of 2013, after the adjustments induced by the May sell-off, EME policy rates tended to be lower by an average of 50 basis points than the levels suggested by the domestic components of the Taylor equation estimates (Graph A, right-hand panel, red line on the first column). The recent policy tightening in EMEs helped to eliminate this gap on average (red line on the second column). However, these averages hide a substantial increase in dispersion (blue bars), which reflects some sudden and concentrated shifts as opposed to a broad-based realignment of policy rates
Of course, a comparison of policy rates with a simple benchmark should be interpreted with caution. Measuring unobservable variables, such as the output gap, is fraught with difficulties. Even the policy rate might not be an accurate measure of monetary conditions, because EMEs have increasingly used non-interest rate monetary policy measures and macroprudential tools to affect monetary conditions. And the results, even if representative for EMEs as a group, should not be seen to apply to all individual EMEs. That said, the finding of unusually accommodative conditions in EMEs seems rather robust. It would survive the use of other benchmarks, such as the growth rate of the economies. And it is consistent with the presence of strong credit and asset price booms in several countries. In particular, recent evidence suggests that potential output tends to be overestimated when such booms are under way.
 For more details on the estimation, see E Takáts and A Vela, "International monetary policy transmission", BIS Papers, 2014 (forthcoming), available upon request. The paper shows that the standard Taylor rule does not fully capture the development of policy rates in most EMEs, and that including a measure of the US policy rate improves the estimates significantly.
  The shadow policy rate was developed in M Lombardi and F Zhu, "Filling the gap: a factor based shadow rate to gauge monetary policy", 2014 (mimeo), in order to account for the impact of unconventional US monetary policies once the zero lower bound was reached. Naturally, this shadow rate can be negative.
  See further in B Hofmann and B Bogdanova, "Taylor rules and monetary policy: a global 'Great Deviation'?", BIS Quarterly Review, September 2012.
  C Borio, P Disyatat and M Juselius, "Rethinking potential output: embedding information about the financial cycle", BIS Working Papers, no 404, February 2013.
In raising interest rates to defend their currencies, policymakers face a trade-off. On the one hand, higher rates can stabilise the exchange rate. On the other hand, they could undermine the macroeconomy. At the current juncture, assessing the appropriate monetary stance in many emerging market economies is further complicated by the fact that monetary policy conditions have been extremely accommodative in past years (see box). Tightening could thus normalise the stance of policy, better aligning interest rates with underlying domestic macroeconomic conditions. Yet the prolonged period of low interest rates has fuelled the rapid build-up of debt in several countries. Coupled with a weakening economic outlook, raising rates in such an environment could precipitate a disorderly unwinding of financial imbalances by increasing the debt servicing costs of overextended borrowers.
Advanced economies
In recent months, investors in advanced economies acted on perceptions of a favourable growth outlook and in an environment of extraordinary monetary accommodation. The upbeat sentiment manifested itself in substantial gains in equity markets, sizeable inflows into equity funds and unabated tightening of credit spreads. This strong performance was tested at end-January by the emerging market sell-off and weaker than expected macroeconomic data from the United States.
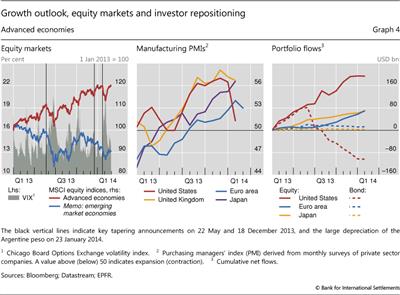
From November to mid-January, stock prices in advanced economies maintained their upward trend, in contrast to those in emerging markets (Graph 4, left-hand panel). On the back of a positive growth outlook (Graph 4, centre panel), the broad stock indices in the United States, the euro area and Japan gained 5%, 4% and 10%, respectively, between 1 November and 22 January. In the process, markets took in their stride the 18 December announcement of US tapering. The rise in valuations went hand in hand with strong inflows into equity funds, especially in the euro area (Graph 4, right-hand panel).
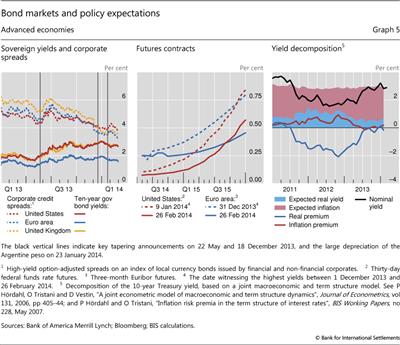
In line with their appetite for equities, investors searched for yield in advanced economies' bond markets. As a result, high-yield spreads continued to narrow towards their pre-crisis lows. The spreads on broad corporate bond indices in the United States, euro area and United Kingdom decreased steadily up to mid-January to reach their lowest levels since October 2007 (Graph 5, left-hand panel). In parallel, there was a similar squeeze of the spreads on investment grade corporate bond indices, while the yields on debt issued by sovereigns in the euro area periphery remained flat at lower levels than in mid-2013. Coupled with an improved growth outlook and expectations of monetary policy tightening, the appeal of relatively risky debt contributed to a repricing of assets in the safest part of the spectrum. US and UK 10-year sovereign yields rose by roughly 40 basis points over the last two months of 2013, while the corresponding German bund yields edged up by 25 basis points. At the same time, there were outflows from bond funds (Graph 4, right-hand panel). These outflows were particularly sizeable in the United States, where the Federal Reserve started tapering its bond purchases.
Market tensions surfaced briefly in advanced economies at end-January but dissipated by mid-February. Data revealing disappointing job growth in the United States, coupled with a sell-off of emerging market assets, led to a sharp drop in valuations and a rise in equity market volatility (Graph 4, left-hand panel) as well as in high-yield credit spreads (Graph 5, left-hand panel). In parallel, the yields on 10-year core sovereign bonds dropped, as did sovereign yields in the euro area periphery, where investor sentiment had been improving.
Authorities in advanced economies maintained their support of the economic recovery. Central banks on both sides of the Atlantic had committed explicitly and repeatedly to keep policy rates at ultra-low levels until recovery is well entrenched (see previous issues of this Review). More recently, the US and UK central banks revised their forward guidance to emphasise that the monetary stance would remain accommodative despite a faster than expected reduction in the unemployment rate. Consistent with this, markets pushed back the expected date of policy rate hikes by several months (Graph 5, centre panel). Futures curves at end-February imply that markets did not expect US or euro area policy rates to rise before late 2015. Likewise, little uncertainty about monetary policy and its impact on inflation, as well as perceptions that markets would absorb the decline in official demand for long-term paper, kept the risk premium of the US 10-year Treasury yield close to zero over the past eight months (Graph 5, right-hand panel).
1 This article was prepared by the BIS Monetary and Economic Department. Questions about the article can be addressed to Mathias Drehmann (mathias.drehmann@bis.org) and Nikola Tarashev (nikola.tarashev@bis.org). Questions about data and graphs should be addressed to Alan Villegas (alan.villegas@bis.org) and Agne Subelyte (agne.subelyte@bis.org).
2 For a further discussion of potential financial stability implications of foreign currency borrowing by non-bank financials in emerging markets, see P Turner, "The global long-term interest rate, financial risks and policy choices in EMEs", BIS Working Papers, no 441, February 2014.

