The anatomy of the global FX market through the lens of the 2013 Triennial Survey
Trading in the FX market reached an all-time high of $5.3 trillion per day in April 2013, a 35% increase relative to 2010. Non-dealer financial institutions, including smaller banks, institutional investors and hedge funds, have grown into the largest and most active counterparty segment. The once clear-cut divide between inter-dealer and customer trading is gone. Technological change has increased the connectivity of participants, bringing down search costs. A new form of "hot potato" trading has emerged where dealers no longer play an exclusive role.1
JEL classification: F31, G12, G15, C42, C82.
This article explores the anatomy of the global foreign exchange (FX) market, drawing on the 2013 Triennial Central Bank Survey of Foreign Exchange and Derivatives Market Activity (in short, "the Triennial"). The Triennial covers 53 countries and represents the most comprehensive effort to collect detailed and globally consistent information on FX trading activity and market structure.2
Global FX turnover climbed to $5.3 trillion per day in 2013 from $4.0 trillion in 2010 (Graph 1, left-hand panel). This 35% rise outpaced the 20% rise from 2007 to 2010, but falls short of the strong increase in the pre-crisis period 2004-07.
We study the structural drivers and trends behind the growing FX volumes. New counterparty information collected in the 2013 Triennial provides a much more detailed picture than before of the trading patterns of non-dealer financial institutions (such as lower-tier banks, institutional investors and hedge funds) and their contribution to turnover. Improved data on execution methods further enable us to give a better description of the current state of market structure.
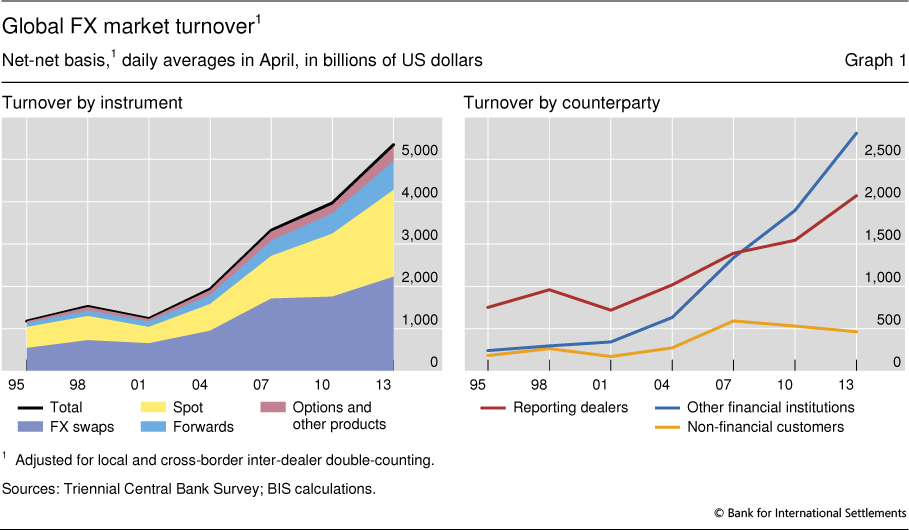
Non-dealer financial institutions were the major drivers of FX turnover growth over the past three years, confirming the trend in prior surveys (Graph 1, right-hand panel). The inter-dealer market, by contrast, has grown more slowly, and the trading volume of non-financials (mostly corporates) has actually contracted. These trends are most visible in the main FX trading centres, London and New York, where close to two thirds of all deals involved non-dealer financial counterparties.
The climb in FX turnover between 2010 and 2013 appears to have been mostly a by-product of the increasing diversification of international asset portfolios rather than a rise in interest in FX as an asset class in its own right.3 With yields in advanced economies at record lows, investors increasingly diversified into riskier assets such as international equities or local currency emerging market bonds. By contrast, returns on currency carry trades (narrowly defined) and other quantitative FX investment strategies were quite unattractive in the run-up to the 2013 survey, suggesting that they were unlikely to have been significant drivers of turnover.
The FX market has become less dealer-centric, to the point where there is no longer a distinct inter-dealer-only market. A key driver has been the proliferation of prime brokerage (see glossary at the end of the article), allowing smaller banks, hedge funds and other players to participate more actively. The evolving market structure accommodates a larger diversity, from high-frequency traders, using computers to implement trading strategies at the millisecond frequency, to the private individual (retail) FX investor. Trading costs have continued to drop, thus attracting new participants and making more strategies profitable. This trend started with the major currencies, and more recently reached previously less liquid currencies, especially emerging market currencies.
Today's market structure involves a more active participation of non-dealer financial institutions in the trading process. Trading activity remains fragmented, but aggregator platforms allow end users and dealers to connect to a variety of trading venues and counterparties of their choice. With more counterparties connected to each other, search costs have decreased and the velocity of trading has increased. The traditional market structure based on dealer-customer relationships has given way to a trading network topology where both banks and non-banks act as liquidity providers. This is effectively a form of "hot potato" trading, but where dealers are no longer necessarily at the centre.4
In the next section, we start with a bird's eye view of the main facts to shed light on FX turnover growth since 2010. We then put the trading patterns of financial counterparties and recent changes in market structure under the microscope. Finally, we explore underlying drivers of FX trading volumes between 2010 and 2013 in greater detail.
FX turnover growth: a look at the main facts
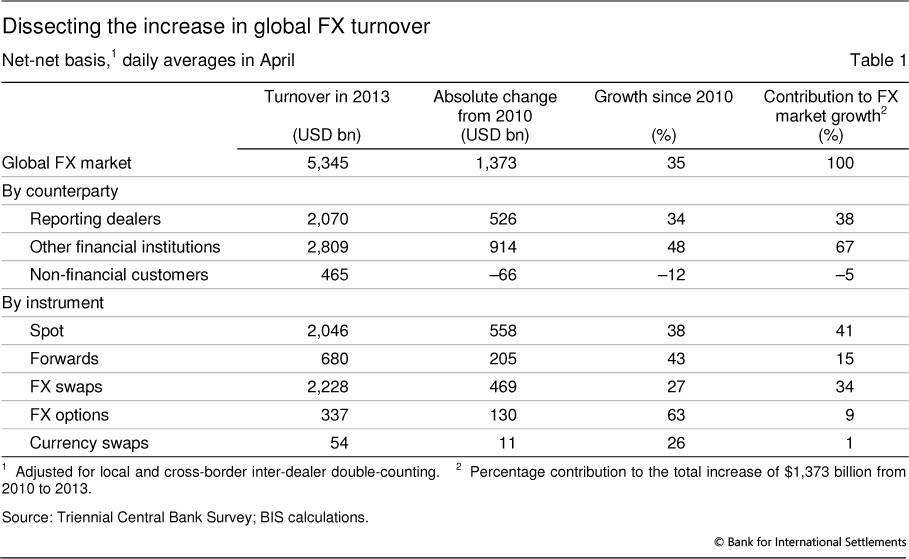
Trading in currency markets is increasingly dominated by financial institutions outside the dealer community ("other financial institutions" in the survey terminology). Transactions with non-dealer financial counterparties grew by 48% to $2.8 trillion per day in 2013, up from $1.9 trillion in 2010, and accounted for roughly two thirds of the rise in the total (Table 1). These non-dealer financial institutions are very heterogeneous in their trading motives, patterns and horizons. They include lower-tier banks, institutional investors (eg pension funds and mutual funds), hedge funds, high-frequency trading (HFT) firms and official sector financial institutions (eg central banks or sovereign wealth funds).
Non-financial customers - mostly comprising corporations, but also governments and high net worth individuals - accounted for only 9% of turnover, the lowest level since the inception of the Triennial in 1989. Reasons for their shrinkage include the sluggish recovery from the crisis, low cross-border merger and acquisition activity and reduced hedging needs, as major currency pairs mostly traded in a narrow range over the past three years. Another key factor is more sophisticated management of FX exposures by multinational companies. Firms are increasingly centralising their corporate treasury function, which allows hedging costs to be reduced by netting positions internally.
The declining importance of inter-dealer trading is the flip side of the growing role of non-dealer financial institutions (Table 1). The inter-dealer share is now down to only 39%, much lower than the 63% in the late 1990s. The primary reason is that major dealing banks net more trades internally. Due to higher industry concentration, top-tier dealers are able to match more customer trades directly on their own books. This reduces the need to offload inventory imbalances and hedge risk via the traditional inter-dealer market.
Trading activity since 2010 has risen fairly evenly across instruments (Graph 1, left-hand panel, and Table 1). That said, spot was the largest contributor to turnover growth, accounting for 41% of the turnover rise. At $2.05 trillion per day, spot trading almost reached the same volume as FX swaps ($2.23 trillion).5 Turnover in FX OTC derivatives such as forwards (up 43%) and FX options (up 63%) also grew strongly, albeit from a lower base.6
Trading by non-dealer financials under the microscope
Non-dealer financial institutions have become the most active participants in currency markets. Who exactly are these players? What do they trade and why do they trade FX? With the new and more granular description of the group of non-dealer financial counterparties in the 2013 Triennial, we can now shed light on these important (yet hitherto unanswered) questions.
Who are the key non-dealer financials and what do they trade?
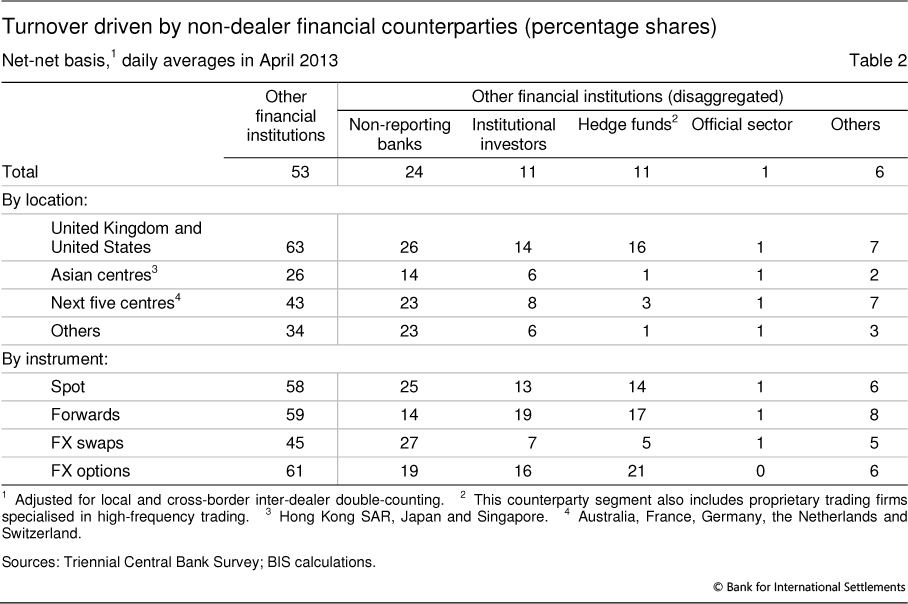
A significant fraction of dealers' transactions with non-dealer financial customers is with lower-tier banks. While these "non-reporting banks" tend to trade smaller amounts and/or only sporadically, in aggregate they account for roughly one quarter of global FX volumes (Table 2). Smaller banks do not engage in market-making, but mostly serve as clients of the large FX dealing banks. As they find it hard to rival dealers in offering competitive quotes in major currencies, they concentrate on niche business and mostly exploit their competitive edge vis-à-vis local clients.7 Like dealers, they extensively trade short-tenor FX swaps (less than one week), which are commonly used for short-term liquidity management.
The most significant non-bank FX market participants are professional asset management firms, captured under the two labels "institutional investors" (eg mutual funds, pension funds and insurance companies) and "hedge funds". The two groups each accounted for about 11% of turnover (Table 2).
Institutional investors differ from hedge funds not only in terms of their investment styles, horizons and primary trade motives, but also the mix of instruments they trade. These counterparties - also often labelled "real money investors" - frequently transact in FX markets, as a by-product of rebalancing portfolios of core assets, such as international bonds and equities. They were behind a large fraction (19%) of trading volumes in forward contracts (Table 2), which they primarily use to hedge international bond (and to a lesser extent equity) portfolios. The management of currency exposure is often passive, requiring only a periodic resetting of the hedges, but can also take a more active form, resembling strategies of hedge funds.8
Hedge funds are especially active in options markets, accounting for 21% of the options volume (Table 2). Options provide them with a convenient way to take leveraged positions to express their directional views on exchange rate movements and volatility. Some of the more actively trading hedge funds and proprietary trading firms also specialise in algorithmic and high-frequency strategies in spot markets. Hedge funds were behind significant volumes in both spot and forwards, accounting for 14% and 17% of total volumes, respectively.
FX trading by official sector financial institutions, such as central banks and sovereign wealth funds, contributed only marginally (less than 1% according to the most recent Triennial data) to global FX market turnover. This small share notwithstanding, these institutions can have a strong impact on prices when they are in the market.
Non-dealer financials and the geography of FX trading
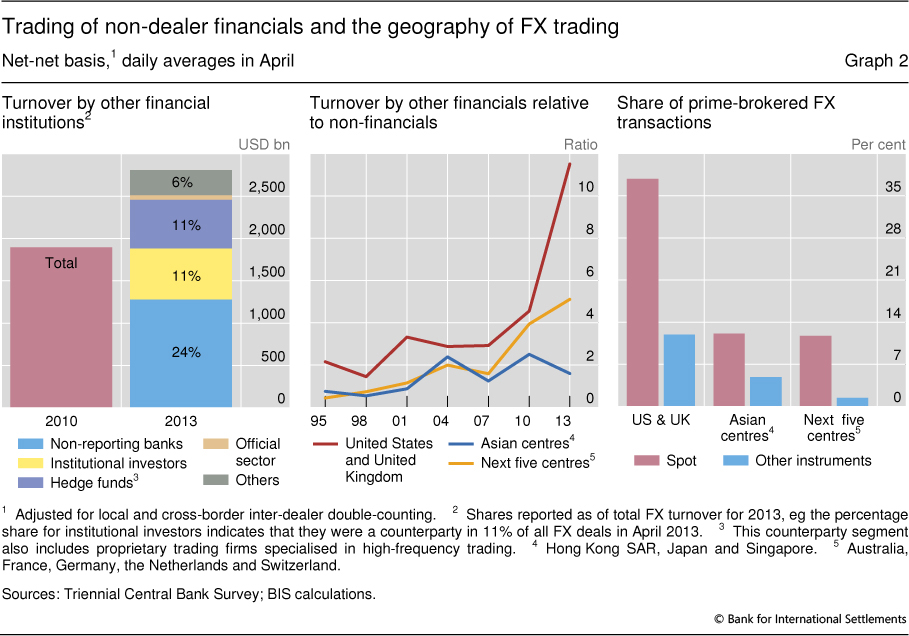
The trading of non-dealer financials such as institutional investors and hedge funds is concentrated in a few locations, in particular London and New York, where major dealers have their main FX desks (Table 2). With a share of over 60% of global turnover, these two locations are the centre of gravity of the market. Dealers' trading with non-dealer financial customers exceeds that with non-financial clients by a factor greater than 10 in these centres (Graph 2, centre panel), much higher than in other key FX trading locations, eg Singapore, Tokyo and Hong Kong SAR. Investors seeking best trade execution often prefer to trade via sales and trading desks (see glossary) in London or New York (even though these investors may have their head office in other time zones). This is because liquidity in currency markets is typically highest at the London open and in the overlapping hours of London and New York.
Prime brokerage has been a crucial driver of the concentration of trading, as such arrangements are typically offered via major investment banks in London or New York (Graph 2, right-hand panel). Through a prime brokerage relationship with a dealer, non-dealer financials gain access to institutional platforms (such as Reuters Matching, EBS or other electronic communications networks (ECNs)) and can trade anonymously with dealers and other counterparties in the prime broker's name. Prime-brokered trades accounted for 23% of total FX volume in the United Kingdom and the United States, against an average of 6% in Asian and other FX trading locations. In spot, the share of prime-brokered trades by US and UK dealers was even higher, at 38% (Graph 2, right-hand panel). The rise in electronic and algorithmic trading also contributed significantly to the concentration in centres. For certain types of algorithmic trading, speed advantages at the millisecond level are critical. Such high-frequency trading requires co-location close to the main servers of electronic platforms typically in the vicinity of London and in New Jersey.
Trading by financials and the rise of emerging market currencies
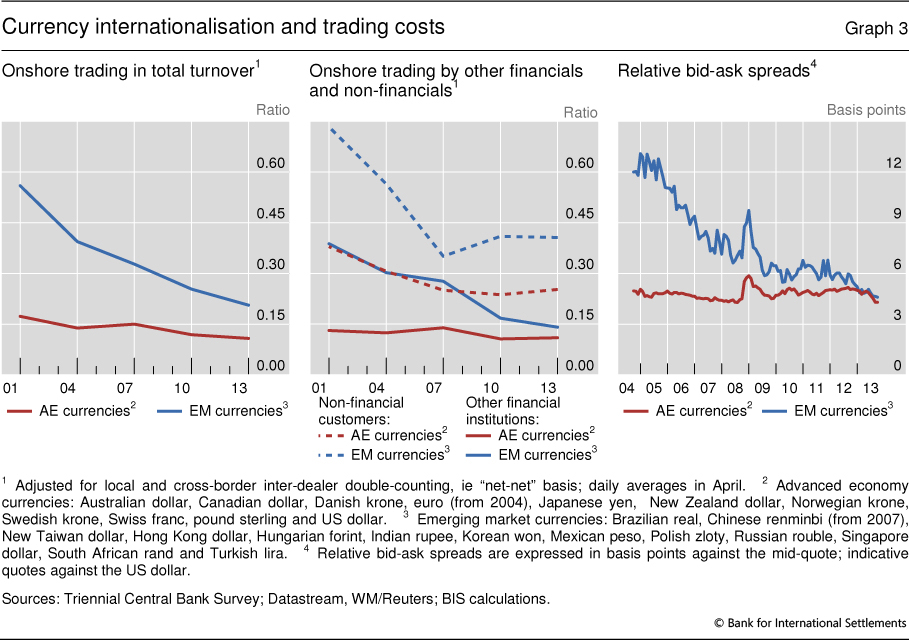
The trend towards more active FX trading by non-dealer financial institutions and a concentration in financial centres is particularly visible for emerging market (EM) currencies. A decade ago, EM currency trading mostly involved local counterparties on at least one side of the transaction (eg McCauley and Scatigna (2011)). Now, trading of EM currencies is increasingly conducted offshore (Graph 3, left-hand panel). It has especially been non-dealer financials (often trading out of financial centres) that have driven this internationalisation trend (Graph 3, centre panel).
The ease and costs of trading minor currencies have improved significantly in this process. Transaction costs in EM currencies, measured by bid-ask spreads, have steadily declined and converged to almost the levels for developed currencies (Graph 3, right-hand panel). As liquidity in EM currencies has improved, these markets have attracted the attention of international investors. Naturally, this has also boosted the share of key EM currencies in total global turnover, from 12% in 2007 to 17% in 2013. The strong growth is particularly visible in the case of the Mexican peso, whose market share now exceeds that of several well established advanced economy currencies. Another case is the renminbi, where most of the 250% growth is due to a surge in offshore trading. China set itself to promote more international use of its currency and introduced offshore renminbi (CNH) in 2010 (Ehlers and Packer (2013)).9
The evolving market structure of FX trading
The growing participation of non-dealer financial institutions has been facilitated by the availability of alternative electronic platforms. The FX market of the 1990s was a two-tier market, with the inter-dealer market as clearly separate turf. This has changed. There is no distinct inter-dealer market any more, but a coexistence of various trading venues where also non-banks actively engage in market-making.
In today's market structure, electronic trading dominates. It is the preferred trading channel, with a share above 50% for all customer segments (Table 3), and is available for all instruments and investors across the globe. This market-wide presence, together with its slowing expansion, suggests that electronic trading has matured. Spot is the segment with by far the highest fraction of trades conducted electronically, at 64%.10 Despite the prevalence of electronic trading, voice (via the phone) and relationship trading remain sizeable in some segments (Table 3). The voice contact may, for instance, provide advice on alternative order execution strategies or ways to implement a trade idea. It may also help to avoid high-frequency traders as a counterparty, or to ensure execution in a busy market. Voice remains the preferred execution method for more complex FX derivatives such as options, where 62% of the deals were done by phone.
The emerging microstructure caters to the demands of a more diverse set of market participants. Non-financial institutions mostly prefer direct contact with their relationship bank, either via the phone or via a single-bank platform. Financial customers are less loyal to their dealer than non-financials and have more dispersed trading patterns (Table 3). They often trade either directly with dealers electronically (eg via Bloomberg Tradebook or direct electronic price streams), or indirectly via multi-bank platforms and electronic brokerage systems that were previously the exclusive venues of inter-dealer trading (EBS and Reuters Matching).
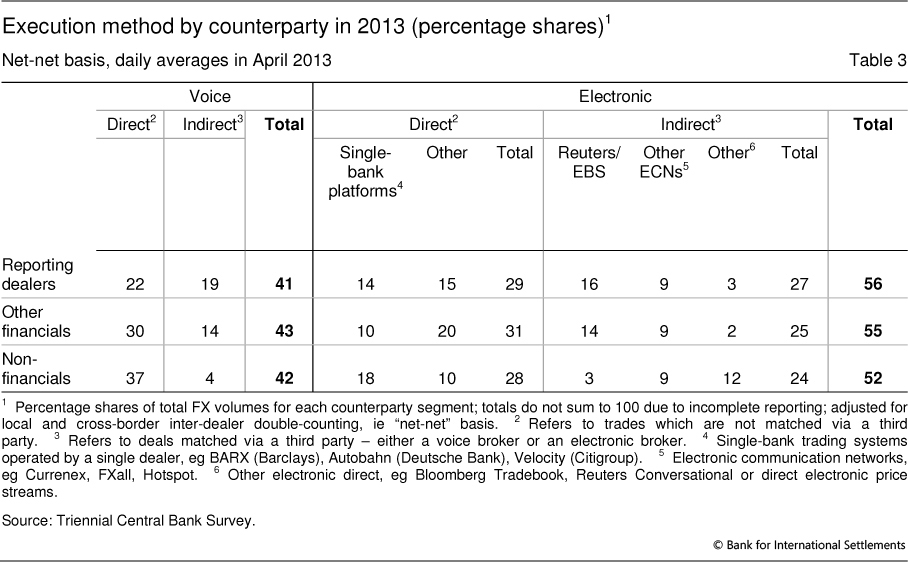
The shift away from a clearly delineated inter-dealer market is reflected in the execution methods data in the Triennial. On EBS and Reuters Matching, which used to be dealer-only electronic platforms, the absolute volume of dealers' trading with other financial customers is actually 17% larger than the volumes between dealers. There are two main reasons for this shift. First, as a response to competition from multi-bank platforms (eg FXall, Currenex or Hotspot), EBS and Reuters opened up to hedge funds and other customers via prime brokerage arrangements in 2004 and 2005, respectively. These platforms became active arenas for proprietary trading firms specialised in high-frequency trading. Second, due to increased concentration of FX flows in a handful of major banks, top-tier banks have been able to net more flows internally. By internalising trades, they can benefit from the bid-ask spread without taking much risk, as offsetting customer flows come in almost continuously. As these banks have effectively become deep liquidity pools, their need to manage inventory via traditional inter-dealer venues is much reduced.
The trend towards flow internalisation left its traces in the data. Traditional inter-dealer venues (EBS and Reuters Matching) have seen their market share shrink.11 Three years ago, dealers conducted 22% of their trades with other dealers via these venues. This is now down to 16%. The flip side is that dealers try to attract flows to their single-bank platforms to benefit further from internalisation. The share of dealer volume on single-bank platforms went up from 8% in 2010 to 14% in 2013.
Underlying drivers of FX trading volumes
Why has FX turnover grown strongly over the past three years to exceed $5 trillion in April this year? We now explore possible factors behind the rise in FX trading volumes in more detail, from both a macro and a micro perspective.
When interpreting the 2013 Triennial, it is necessary to bear in mind that the survey month was probably the most active period of FX trading ever recorded. The monetary policy regime shift by the Bank of Japan in early April triggered a phase of exceptionally high turnover across asset classes. In the months that followed, the rise in yen trading partly reversed (Bech and Sobrun (2013)). Without this effect, however, FX turnover would probably still have grown by about 25%.12 Hence, we need to look beyond this scenario for reasons behind the growth in FX volumes.
To gain a better understanding of the drivers in FX volumes between 2010 and 2013, it is important to take a closer look at the trading motives of non-dealer financials, which have grown into the most dominant players. One possibility is that FX turnover rose due to growing interest in FX as a separate asset class; another is that trading volumes in currency markets grew as a by-product of international portfolio investments in other asset classes. It is also relevant to elicit the implications of the evolving market structure, characterised by an increased participation of non-dealer financial institutions, greater diversity and lower search costs.
FX as an asset class vs international portfolio diversification
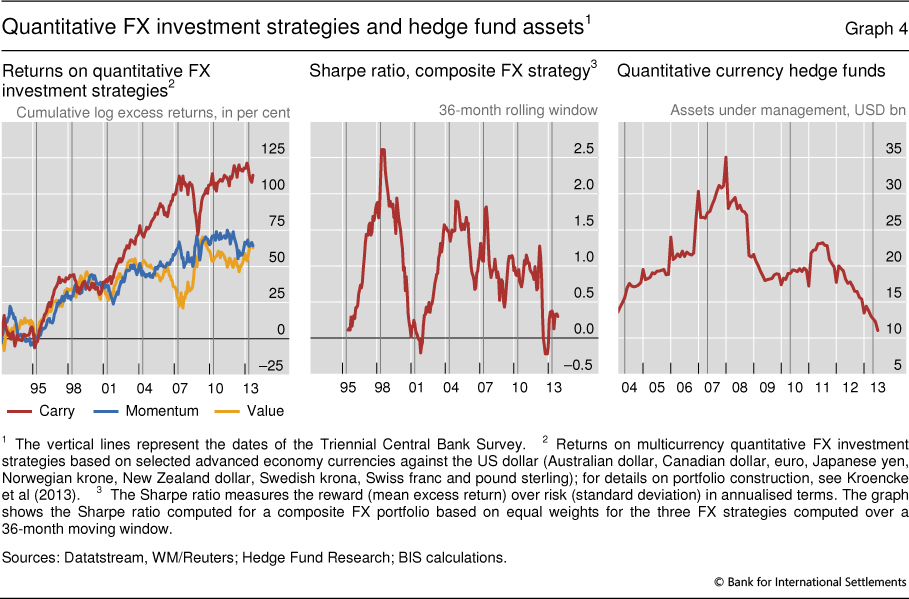
Market participants generally regard FX as an asset class in its own right. To exploit profit opportunities, currency hedge funds and overlay managers (see glossary), for instance, frequently pursue quantitative strategies that involve the simultaneous purchase and sale of multiple currencies (eg Menkhoff et al (2012)). The most popular and best known is the carry trade, which seeks to exploit interest rate differentials across a range of countries. Another popular strategy is momentum trading, a bet on the continuation of exchange rate trends. A less known value strategy involves buying currencies perceived to be undervalued and selling those perceived to be overvalued, where the fundamental value can be determined by, for instance, a long-run equilibrium concept like purchasing power parity.
Such simple strategies have been profitable for some time (Graph 4, left-hand panel), attracting new entrants into the market. In particular, the carry trade provided investors with attractive and not very volatile returns in the run-up to the crisis. The 2004 and 2007 surveys also reported that turnover growth largely reflected the activity of investors engaged in such strategies (Galati and Melvin (2004), Galati and Heath (2007)).
It is unlikely, however, that quantitative FX strategies were the main drivers of turnover growth this time. Interest rate differentials have shrunk, as many central banks have been easing monetary policy. Major exchange rates mostly traded in a narrow range, characterised by temporary bouts of volatility and sudden policy actions, eg during the European sovereign debt crisis. Neither carry trades (narrowly defined) nor momentum trades performed well in these conditions (Graph 4, left-hand panel). Consequently, currency hedge funds suffered significant outflows over this period (Graph 4, right-hand panel), with some funds going out of business.13
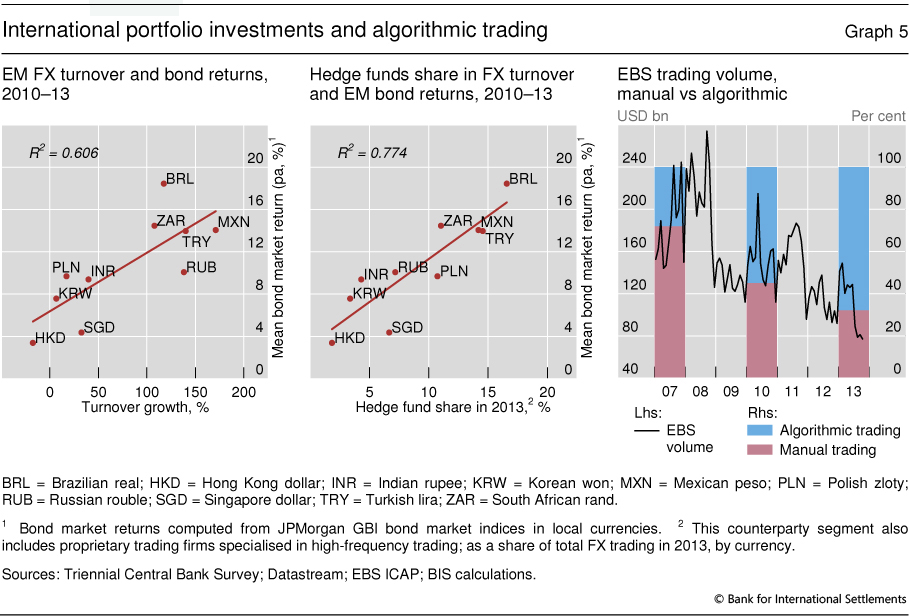
A more compelling explanation for the stronger FX activity of non-dealer financials is the rise in international diversification of asset portfolios, triggering currency trading as a by-product. Over the past three years, equities provided investors with attractive returns and emerging market bond spreads dropped, while issuance in riskier bond market segments (eg local currency emerging market bonds) soared. Not only did this give rise to the need to trade FX in larger quantities and to rebalance portfolios more frequently, but it also went hand in hand with a greater demand for hedging currency exposures. Among the currencies of advanced economies, FX turnover picked up the most for countries that also saw significant equity price increases.14 In the case of emerging markets, turnover mostly increased in currencies where local bond market investments offered attractive returns (Graph 5, left-hand panel). In fact, for these currencies the participation of hedge funds was particularly strong (Graph 5, centre panel).
A new form of hot potato trading
Factors at the micro level have also contributed to the growth in FX volumes in recent years. First, a greater diversity and involvement of non-dealer market participants have increased the scope for more gains from trade; second, a rise in the connectivity among the different players has led to a significant drop in search costs; and third, the velocity of trading has increased due to a proliferation of computerised (algorithmic) strategies.
Recent years have seen a greater diversity of participants active in the global FX market. New types of participants have entered, such as retail investors (see box), high-frequency trading firms and smaller regional banks (eg headquartered in emerging markets). Greater activity by more heterogeneous players expands the universe of trade motives, and extends investment horizons, factors associated with more scope for trading (Banerjee and Kremer (2010)).
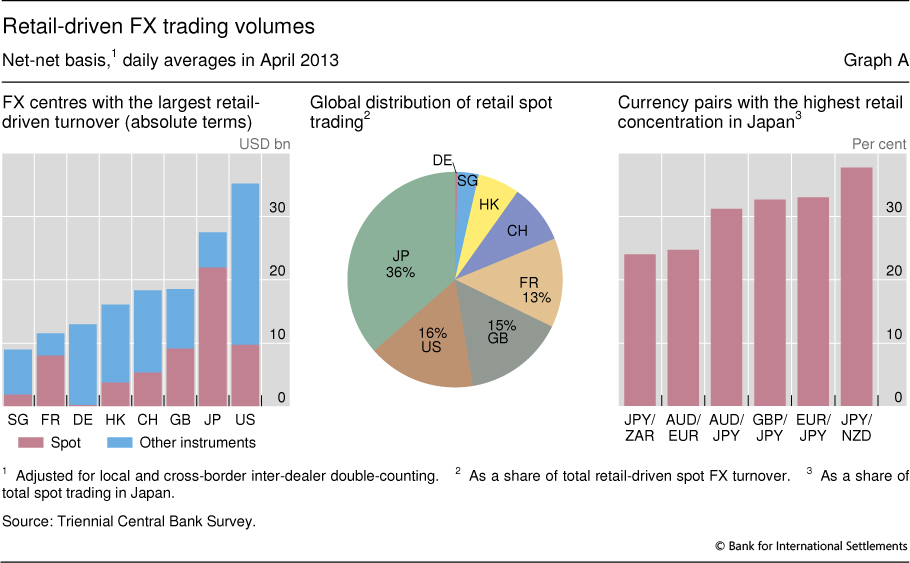
Retail trading in the FX market
In the late 1990s, FX trading was mainly the domain of large corporations and financial institutions. Banks charged small "retail" investors prohibitively high transaction costs, as their trades were considered too tiny to be economically interesting. This changed when retail-oriented platforms (eg FXCM and OANDA) started offering online margin brokerage accounts to private investors around 2000, streaming prices from major banks and EBS. Their business model was to bundle many small trades together and lay them off in the inter-dealer market. With trade sizes now much larger, dealers were willing to provide liquidity to such "retail aggregators" at attractive prices.
Retail FX trading has since grown quickly. New breakdowns collected in the 2013 Triennial show that retail trading accounted for 3.5% and 3.8% of total and spot turnover, respectively. The largest retail volumes in absolute terms are in the United States and Japan. That said, Japan, which has a very active retail segment, is clearly biggest in spot (Graph A, left-hand panel). In April 2013, retail trading in Japan accounted for 10% and 19% of total and spot, respectively. Retail investors differ from institutional investors in their FX trading patterns. They tend to trade directly in relatively illiquid currency pairs rather than via a vehicle currency (Graph A, right-hand panel).
The retail figures in the 2013 Triennial are lower than the level King and Rime (2010) reported based on anecdotal evidence. By design, the Triennial only captures retail trades that ultimately end up with dealers directly or indirectly through retail aggregators. Trades internalised on the platform are not captured. Nevertheless, this is probably not a big problem, as the scope for internalisation on retail platforms is limited.  The boundaries of retail are also becoming more blurred. Regulatory changes (eg leverage limits for margin brokerage accounts for private investors) in countries such as the United States have slowed growth in the retail segment and led some platforms to target themselves towards professional investors (eg small hedge funds). Furthermore, the recent poor returns on popular strategies, such as momentum and carry trades, suggest that growth in the retail segment may have slowed.
For example, to conduct a carry trade, they go long in NZD/JPY, instead of entering a long position in NZD/USD and a short position in JPY/USD. Internalisation is crucial for large dealers in major pairs, where internal netting may be as high as 75-85%. But the scope for internalisation is limited for retail platforms with smaller flows, predominantly in minor currencies. Reports indicate that even a liquid pair such as GBP/USD has an internalisation ratio of 15-20%, suggesting that the scope for internalisation in eg JPY/ZAR is much lower. That said, internalisation ratios can differ strongly across retail platforms and jurisdictions but are unlikely to exceed 50%.
The more fragmented structure that emerged after the demise of the inter-dealer market as the main pool of liquidity could potentially harm trading efficiency by raising search costs and exacerbating adverse selection problems. Yet, one of the most significant innovations to prevent this has been the proliferation of liquidity aggregation. This new form of aggregation effectively links various liquidity pools via algorithms that direct the order to a preferred venue (eg the one with the lowest trading costs). It also allows market participants to pick preferred counterparties and choose from which liquidity providers, both dealers and non-dealers, to receive price quotes. This suggests that search costs, a salient feature of OTC markets (Duffie (2012)), have significantly decreased.
Widespread use of algorithmic techniques and order execution strategies allows the sharing of risk to occur faster and among more market participants throughout the network of connected venues and counterparties. The opening of EBS and Reuters to non-dealers via prime brokerage agreements was a key catalyst, but today all platforms offer ways to connect computer-generated trading. Over the period 2007-13, algorithmic trading at EBS grew from 28% to 68% of volumes (Graph 5, right-hand panel).
Furthermore, non-dealer financial institutions are increasingly engaged in providing liquidity, as the ease of customising the types of counterparty connections reduces exposure to adverse selection risk. As a consequence, a given imbalance can be matched against the quotes of more liquidity providers, both dealers and non-dealers, and shuffled faster through the network of trading venues (via algorithms). This has increased the velocity of trading, and effectively is a new form of hot potato trading, but no longer with only dealers at the centre.
Algorithmic trading is essential to the efficiency of this process, and has become pervasive among dealers and end users alike. It is, however, important to distinguish algorithmic from high-frequency trading (HFT), a subset characterised by extremely short holding periods at the millisecond level and a vast amount of trades often cancelled shortly after submission (eg Markets Committee (2011)). EBS estimates that around 30-35% of volume on its trading platform is HFT-driven. HFT strategies can both exploit tiny, short-lived price discrepancies and provide liquidity at very high frequency benefiting from the bid-ask spread. Speed is crucial, and as competition among HFT firms has increased, additional gains from being fast have diminished.15 It is thus unlikely that HFT has been a significant driver of turnover growth since 2010.16
Conclusion
Trading activity in the foreign exchange market reached an all-time high of $5.3 trillion in April 2013, 35% higher than in 2010. The results of the 2013 Triennial Survey confirm a trend in the market already seen in prior surveys: first, a growing role of non-dealer financial institutions (smaller banks, institutional investors and hedge funds); second, a further internationalisation of currency trading and at the same time a rising concentration in financial centres; and lastly, a fast-evolving market structure driven by technological innovations that accommodates the diverse trading needs of market participants.
New and more granular breakdowns introduced in the 2013 Triennial allow a more detailed analysis of these developments. With more detailed information on non-dealer financial institutions, the linkages between their trading motives and FX turnover growth can be better understood. The once clear-cut two-tier structure of the market, with separate inter-dealer and customer segments, no longer exists. At the same time, the number of ways the different market participants can interconnect has increased significantly, suggesting that search costs and trading costs are now considerably reduced. This has paved the way for financial customers to become liquidity providers alongside dealers. Hence, financial customers contribute to increased volumes not only through their investment decisions, but also by taking part in a new hot potato trading process, where dealers no longer perform an exclusive role.
References
Banerjee, S and I Kremer (2010): "Disagreement and learning: dynamic patterns of trade", Journal of Finance, no 65(4), pp 1269-1302.
Bech, M and J Sobrun (2013): "FX market trends before, between and beyond Triennial Surveys", BIS Quarterly Review, December
Duffie, D (2012): Dark markets: asset pricing and information transmission in over-the-counter markets, Princeton University Press.
Ehlers, T and F Packer (2013): "FX and derivatives markets in emerging economies and the internationalisation of their currencies", BIS Quarterly Review, December.
Galati, G and A Heath (2007): "What drives the growth in FX activity? Interpreting the 2007 triennial survey", BIS Quarterly Review, December, pp 63-72.
Galati, G and M Melvin (2004): "Why has FX trading surged? Explaining the 2004 Triennial Survey", BIS Quarterly Review, December, pp 67-74.
King, M and D Rime (2010): "The $4 trillion question: what explains FX growth since the 2007 survey?", BIS Quarterly Review, December, pp 27-42.
Kroencke, T, F Schindler and A Schrimpf (2013): "International diversification benefits with foreign exchange investment styles", Review of Finance (forthcoming).
Lyons, R (1997): "A simultaneous trade model of the foreign exchange hot potato", Journal of International Economics, no 42, pp 275-98.
Markets Committee (2011): High frequency trading in the foreign exchange market, BIS, Basel, September.
McCauley, R and M Scatigna (2011): "Foreign exchange trading in emerging currencies: more financial, more offshore", BIS Quarterly Review, March, pp 67-75.
Menkhoff, L, L Sarno, M Schmeling and A Schrimpf (2012): "Currency momentum strategies", Journal of Financial Economics, no 106(3), pp 660-84.
Pojarliev, M and R Levich (2012): A new look at currency investing, CFA Institute Research Foundation Publications.
Secmen, A (2012): "Foreign exchange strategy based products", in J James, I Marsh and L Sarno (eds), Handbook of Exchange Rates, Wiley.
Glossary
Algorithmic trading: Automated transactions where a computer algorithm decides the order submission and execution (also see "High-frequency trading").
Bid-ask spread: The difference in the price the customer receives for selling a security or currency (bid) and the price at which the customer buys (ask).
Broker: A financial intermediary who matches counterparties to a transaction without being a party to the trade. The broker can operate electronically (electronic broker) or by telephone (voice broker).
Buy-side: Market participants that act as a customer of the dealer. This need not mean that the specific entity is actually buying or selling.
Dealer: A financial institution that is entering into transactions on both sides of markets, seeking profits by taking risks in those markets and by earning a spread; sometimes also referred to as "sell-side".
Electronic communications network (ECN): A computer system that facilitates electronic trading, typically in OTC markets.
High-frequency trading (HFT): An algorithmic trading strategy that profits from incremental price movements with frequent, small trades executed in milliseconds for very short investment horizons. HFT is a subset of algorithmic trading.
Liquidity aggregator: Technology that allows participants to stream prices from several liquidity providers/pools simultaneously. Computer algorithms allow customisation of the price streams, by both the liquidity provider and the receiving counterparty.
Multi-bank trading platform: An electronic trading system that aggregates and distributes quotes from multiple FX dealers.
Overlay management: The management of the currency exposure of international bond and equity portfolios.
Prime brokerage: A service offered by banks that allows a client to source funding and market liquidity from a variety of executing dealers while maintaining a credit relationship, placing collateral and settling with a single entity.
Reporting dealer: A bank that is active as a market-maker (by offering to buy or sell contracts) and participates as a reporting institution in the Triennial.
Retail aggregator: A term used for online broker-dealers who stream quotes from the top FX dealers to customers (individuals and smaller institutions) and aggregate a small number of retail trades.
Sales and trading desk: FX deals are traditionally arranged via sales desks, which are responsible for maintaining the relationship with the customer. Once an incoming client order is received, it is passed on to the trading desk for execution.
Single-bank trading system: A proprietary electronic trading system operated by an FX dealer for the exclusive use of its customers.
1 The authors would like to thank Claudio Borio, Stephen Cecchetti, Alain Chaboud, Richard Clarida, Dietrich Domanski, Jacob Gyntelberg, Michael King, Colin Lambert, Michael Melvin, Lukas Menkhoff, Michael Moore, Richard Olsen, Richard Payne, Lucio Sarno, Elvira Sojli, Christian Upper, Clara Vega, Philip Wooldridge and seminar participants at the Central Bank of Norway for useful comments and suggestions. We greatly appreciate the feedback and insightful discussion with numerous market participants at major FX dealing banks, buy-side institutions and electronic trading platforms. We are particularly grateful to Denis Pêtre for compiling the data and Anamaria Illes for excellent research assistance. The views expressed are those of the authors and do not necessarily reflect those of the BIS or the Central Bank of Norway.
2 Due to the decentralised structure of the FX market, where deals take place over the counter (OTC) and where liquidity is fragmented across different venues, the market is rather opaque and quantitative information on market activity quite sparse.
3 Over the last 10-15 years, market participants have increasingly recognised FX as a separate asset class. This is reflected in the number of products offered by major banks to institutional and retail investors (Secmen (2012), Pojarliev and Levich (2012)).
4 The term "hot potato trading" was coined by Lyons (1997) and described the passing of currency inventory imbalances (due to an exogenous shift in the demand and supply of currencies) around the inter-dealer market.
5 To put these numbers into perspective, it is useful to compare these figures with those of other main asset classes. Total trading volume in all equity markets around the world, for instance, reached roughly $300 billion per day in April this year, about 25% of the global FX spot volumes of non-dealer financial institutions.
6 The surge in options reflects the period of intense yen trading in April 2013 (see below): almost half of the options traded that month were linked to JPY/USD. At the time, hedge funds expressed their directional views via the options market, where they accounted for 24% of turnover.
7 While the 2013 Triennial is the first to collect information on lower-tier banks, stable numbers of reporting dealers suggest that it is unlikely that such trades were previously reported as inter-dealer trades. According to market sources, lower-tier banks have become more active in the FX market in recent years. A recent trend for these banks is to source liquidity from top-tier dealers and to effectively "resell" it (often referred to as "white-labelling") to smaller, local clients, who are less attractive to top dealers.
8 Management of the FX component of asset portfolios is often delegated to overlay managers (see eg Pojarliev and Levich (2012)). Some of the FX management can be passive and simply targeted towards removing currency risk exposure. Under more active mandates, the goal is to add extra return to the portfolio and to generate diversification benefits via currency investments.
9 Non-financial customers (still) play a larger role in renminbi trading than they do in other important EM currencies. They contributed about 19% to renminbi turnover in April 2013, whereas professional asset managers (institutional investors and hedge funds) accounted for only 9%.
10 Due to the practical benefits from electronic execution, such as straight through processing, most of the voice trades are in fact eventually booked electronically. Some market reporters suggest that as much as 95% of all spot transactions could in fact be electronic.
11 EBS has so far experienced the largest drop in volumes (Graph 5, right-hand panel), which is natural given its lead in currency pairs where the internalisation ratios are the largest (as high as 75-85% for key EUR and JPY pairs). As internalisation ratios increase also for the smaller currency pairs that typically have been traded at Reuters, it is likely that Reuters will also experience a decrease in volume.
12 This estimate is based on the assumption that yen trading would have grown at a similar rate as trading in other important advanced economy currencies such as the US dollar, euro, pound sterling and Swiss franc.
13 While quantitative currency hedge funds faced a challenging environment, macro hedge funds with a discretionary investment style performed better, according to market sources. Such funds are likely to have played a significant role as drivers of yen volumes between late October 2012 and April 2013.
14 The Japanese case clearly stands out, where equity prices surged more than 55% in local currency terms between October 2012 and April 2013. Given the depreciation pressure faced by the yen over this period, real money investors heavily engaged in hedging. Triennial data show that institutional investors were behind 32% of the volume in yen forward contracts in April 2013.
15 Some electronic platform providers have also recently introduced microstructural changes to reduce competition for speed (eg by increasing minimum tick size or by modifying the treatment of incoming orders in the queue).
16 According to market sources, the HFT segment in foreign exchange markets has seen a consolidation in recent years. In this process, major HFT firms have mostly turned to market-making as their main strategy.